 The Bitcoin Policy Institute, a non-profit organization supporting bitcoin initiatives, has launched the Peer-to-Peer Rights Fund, a project seeking to protect bitcoin’s decentralized nature from regulatory overreach. The fund’s first objective is to aid in the defense of the founders of Samourai Wallet given the relevance of the case for the industry. Peer-to-Peer Rights Funds […]
Bitcoin News
Former Alameda Research Boss Sam Trabucco Reemerges to Defend Ryan Salame Before Sentencing
 Reports indicate that Sam Trabucco, the former co-CEO of the cryptocurrency trading firm Alameda Research, penned a letter to the judge set to sentence Ryan Salame, co-CEO of FTX Digital Markets. Trabucco’s letter emerged amidst numerous inquiries about his whereabouts throughout the ongoing turmoil. In his message, Trabucco referred to Salame as his “best friend” […]
Bitcoin News
Nigerian Central Bank Governor Denies Using Forex Reserves to Defend Local Currency
 The Nigerian central bank governor has refuted claims that the bank is using the country’s foreign exchange reserves to shore up the naira. The governor attributes the decline in reserves to debt repayments and other payments, which are made because they help to maintain Nigeria’s credibility. Maintaining Nigeria’s Credibility Yemi Cardoso, governor of the Central […]
Bitcoin News
XRP Price Prediction: Can Bulls Defend This Key Support?
XRP price started a downside correction from the .7450 resistance. The bulls are now struggling to keep the price above the .5850 support zone.
- XRP started a fresh decline after it failed to clear the .7450 resistance.
- The price is now trading below .650 and the 100 simple moving average (4 hours).
- There is a key bearish trend line forming with resistance at .640 on the 4-hour chart of the XRP/USD pair (data source from Kraken).
- The pair could start a fresh rally if there is a close above the .6650 resistance zone.
XRP Price Trims Gains
After a steady increase, XRP price struggled to extend gains above the .750 resistance. The price started a downside correction from the .7442 high, like Ethereum and Bitcoin.
There was a steady decline below the .700 and .665 support levels. The price even declined below the .600 support. A low was formed near .5874 and the price is now consolidating losses. There was a minor increase above the .620 level.
The price spiked above the 23.6% Fib retracement level of the downward move from the .7442 swing high to the .5874 low. However, the bears were active near .650. There is also a key bearish trend line forming with resistance at .640 on the 4-hour chart of the XRP/USD pair.
Ripple’s token price is now trading below .620 and the 100 simple moving average (4 hours). On the upside, immediate resistance is near the .640 zone. The first key resistance is near .6650 or the 50% Fib retracement level of the downward move from the .7442 swing high to the .5874 low, above which the price could rise toward the .70 resistance.
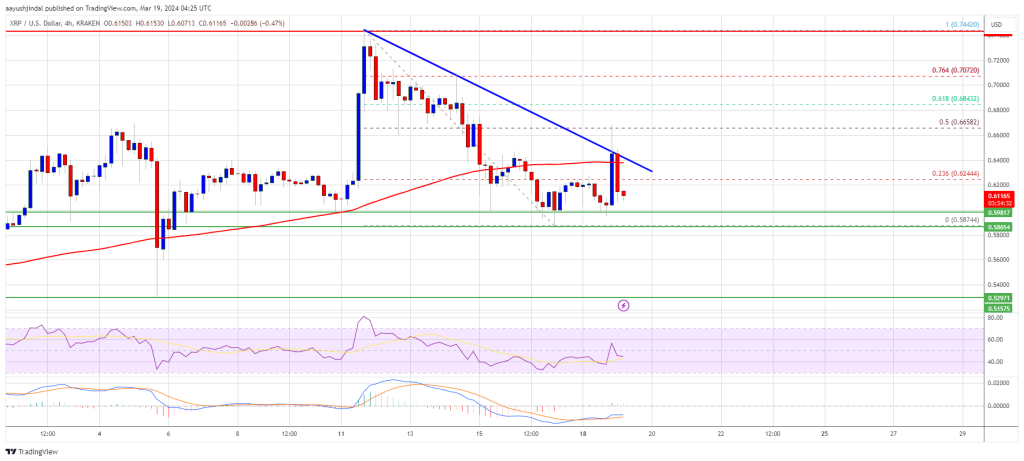
Source: XRPUSD on TradingView.com
A close above the .70 resistance zone could spark a strong increase. The next key resistance is near .7450. If the bulls remain in action above the .7450 resistance level, there could be a rally toward the .800 resistance. Any more gains might send the price toward the .820 resistance.
More Losses?
If XRP fails to clear the .6650 resistance zone, it could start another decline. Initial support on the downside is near the .5980 zone.
The next major support is at .5850. If there is a downside break and a close below the .5850 level, the price might accelerate lower. In the stated case, the price could retest the .520 support zone.
Technical Indicators
4-Hours MACD – The MACD for XRP/USD is now gaining pace in the bearish zone.
4-Hours RSI (Relative Strength Index) – The RSI for XRP/USD is now below the 50 level.
Major Support Levels – .5980, .5850, and .5200.
Major Resistance Levels – .640, .6650, and .700.
Economic Intelligence Unit: Nigerian Central Bank Lacks Capacity to Defend Local Currency
 The Economic Intelligence Unit has stated that the Central Bank of Nigeria cannot halt the rapid depreciation of the local currency. The continued volatility of the naira is expected to result in erratic regulation, primarily affecting businesses that hold foreign exchange. Nigeria Presses Ahead With Reforms The Economic Intelligence Unit (EIU) has stated that the […]
Bitcoin News
Bitcoin Technical Analysis: BTC Holds Steady Above $43K as Bulls Defend Support

Bitcoin’s price is holding above the ,000 range after bulls defended key support levels over the weekend. The leading crypto asset is up 2% week-to-date and 5.6% over the past two weeks.
Bitcoin
On the 1-hour chart, bitcoin’s price action shows a short-term uptrend, with higher lows indicating continued buying interest. The bulls have managed to defend support around ,243, which could now act as a potential entry point on pullbacks. Resistance builds around the ,210 range as bulls have yet to cross it.
Zooming out to the 4-hour chart, the picture is somewhat choppier but an uptrend is emerging, with a series of higher highs and higher lows. The critical support to watch is around ,859, where the bulls could look to enter long positions. On this chart, resistance stands at ,738, where selling pressure may emerge.
On the daily timeframe, bitcoin is consolidating after a previous downtrend. While still rangebound, the market bias appears tilted to the upside here. The key support at ,505 was held firmly during the recent pullback, keeping the bulls in control. The resistance line is at ,048, the year’s all-time price high.
Overall, the oscillators and moving averages (MAs) corroborate the uptrend across the short, medium, and long-term timeframes. The relative strength index (RSI), Stochastic, commodity channel index (CCI), and moving average convergence/divergence (MACD) all signal bullish momentum at press time.
The multiple timeframe analysis suggests bitcoin’s uptrend remains intact. Traders can look to buy dips with tight stop losses placed below critical support levels. Initial upside targets exist around resistance zones, but traders should also consider trailing stop losses to capitalize on extended moves to the upside. The bulls remain in control so long as support continues holding.
Bull Verdict:
The confluence of bullish signals across the short, medium, and long-term timeframes paints a decisively bullish picture. Bitcoin appears poised to continue its uptrend as long as critical support levels hold. Traders can look to buy the dips, targeting the overhead resistance zones. The path of least resistance remains to the upside.
Bear Verdict:
While bitcoin has shown some bullish signals, the risk of a trend reversal remains if critical support levels fail to hold. Traders should exercise caution when looking for long entries, maintaining tight stop losses below support. The choppy price action suggests potential exhaustion among bulls. Until bitcoin can gain upside momentum above resistance, the bears may look to trap bullish traders.
Register your email here to get weekly price analysis updates sent to your inbox:
What do you think about bitcoin’s market action on Monday? Share your thoughts and opinions about this subject in the comments section below.
SEC Sues Kraken: Crypto Exchange Plans to ‘Vigorously Defend’ Its Position in Court

The U.S. Securities and Exchange Commission (SEC) has sued cryptocurrency exchange Kraken for the second time this year, alleging that the crypto trading platform operates as an unregistered securities exchange, broker, dealer, and clearing agency. Kraken disagreed with the securities regulator’s claims, insisting: “We do not list securities, and plan to vigorously defend our position.”
SEC Sues Kraken Again
The U.S. Securities and Exchange Commission (SEC) announced Monday that it has charged “Payward Inc. and Payward Ventures Inc., together known as Kraken, with operating Kraken’s crypto trading platform as an unregistered securities exchange, broker, dealer, and clearing agency.” This is the SEC’s second lawsuit against Kraken this year. The first was in February over the crypto exchange’s staking program, which Kraken agreed to pay million to settle.
In its lawsuit filed on Monday, the SEC alleged that since at least September 2018:
Kraken intertwines the traditional services of an exchange, broker, dealer, and clearing agency without having registered any of those functions with the Commission as required by law.
Moreover, the SEC alleged that “Kraken’s business practices, deficient internal controls, and poor recordkeeping practices present a range of risks for its customers.” The securities regulator further claimed that “Kraken commingles its customers’ money with its own, including paying operational expenses directly from accounts that hold customer cash.” In addition, the watchdog has accused Kraken of listing crypto securities.
The SEC is seeking “injunctive relief, conduct-based injunctions, disgorgement of ill-gotten gains plus interest, and penalties.”
Kraken Intends to Fight Back
Following the SEC’s lawsuit announcement, Kraken issued a statement, stating: “We disagree, and intend to vigorously defend our position in court.” The exchange detailed:
The complaint against Kraken alleges no fraud, no market manipulation, no customer losses due to hacking or compromised security, and no breaches of fiduciary duty.
“It includes big dollar amounts but does not allege a single one of those dollars is missing or misused — no Ponzi scheme, no failure to maintain adequate reserves, and no failure to preserve the identity of client funds 1:1. Indeed, none of these things would be true,” the company emphasized.
Kraken CEO Dave Ripley posted on social media platform X: “We strongly disagree with the SEC claims, stand firm in our view that we do not list securities, and plan to vigorously defend our position. As we have seen before, the SEC argues that Kraken should ‘come in and register’ with the agency, when there is no clear path to registration.”
What do you think about the SEC suing Kraken again this year after the crypto exchange paid million to settle the previous lawsuit? Let us know in the comments section below.
Polygon Price Speculation: Can MATIC Defend The $0.5 Threshold?
Polygon (MATIC) has been treading in the water for much of September, caught in a tight range that reflects the uncertainty gripping the cryptocurrency market. As the altcoin hovers around the .50 mark, traders are closely eyeing a significant technical indicator that could spell trouble for its price trajectory.
The altcoin’s price, currently at .508295 according to CoinGecko, has shown signs of weakness, with a 2.4% decline in the past 24 hours and a 7.3% dip over the past week.
However, the real concern for MATIC investors lies in the potential reversal from the down-sloping trendline. This trendline, intact since February 2023, has kept MATIC in check for months. If breached, it could unleash a wave of selling pressure that might push the price below the critical .50 level.
Polygon Faces Increasing Selling Pressure On The Horizon
Traders are well aware that when an asset approaches a long-standing downtrend resistance line, it often faces increased selling pressure. Analysts suggest that a reversal from this trendline could lead to an 18% price decline, potentially dragging MATIC down to the next key support level at .42. It’s a make-or-break moment for the altcoin, and its fate hangs in the balance.
For those who remain bullish on Polygon’s native coin, patience is key. A daily close above the resistance trendline would signal a significant shift in market sentiment. Such a breakthrough could provide the bulls with the momentum they need to initiate a recovery rally. If successful, MATIC may set its sights on initial resistance at .63, with an even more ambitious target of .69.
Polygon 2.0: A Potential Game Changer
Adding a layer of complexity to this price analysis is Polygon’s recent announcement of Polygon 2.0. This strategic overhaul envisions a fundamental shift in Polygon’s blockchain architecture and an expansion beyond Ethereum to include various other blockchains. Polygon aims to execute this transformation in the early fourth quarter, potentially paving the way for a surge in interest and demand for its native coin.
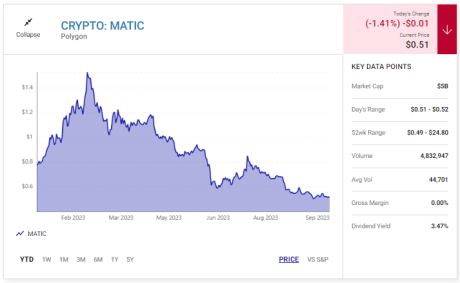
As MATIC teeters on the edge of a crucial technical juncture, the cryptocurrency market remains a battleground of uncertainty. Traders and investors must exercise caution and closely monitor developments around the down-sloping trendline. The success or failure of MATIC to break free from this resistance could determine its price trajectory in the coming weeks.
Moreover, the impending rollout of Polygon 2.0 adds an extra layer of anticipation to an already dynamic cryptocurrency landscape, promising potential surprises for MATIC holders and the wider crypto community.
(This site’s content should not be construed as investment advice. Investing involves risk. When you invest, your capital is subject to risk).
Featured image from Shutterstock
Chainlink Bulls Must Defend The $7 Support Line For A Successful Recovery
Over the last week, Chainlink lost most of the gains it secured in the previous two months. In the past week, LINK depreciated by close to 6%. On the daily chart, Chainlink fell by 4% and is moving close to its immediate support level.
The overall structure of Chainlink remained bearish at the time of writing. Demand for the altcoin remained low as buying pressure couldn’t recover over the past few weeks. Accumulation dipped on the chart too.
For buyers to regain strength on their charts, the altcoin has to stay above its immediate price floor. The bulls could recover over the subsequent trading sessions if that support level remains steady.
The LINK price continued to move on a descending trendline, but a slight push from buyers could bring the altcoin to trade near its overhead price ceiling. For Chainlink to secure gains, broader market strength remains crucial. Bitcoin has to trade above the ,000 price for major altcoins to appreciate on their respective charts.
Chainlink Price Analysis: One-Day Chart
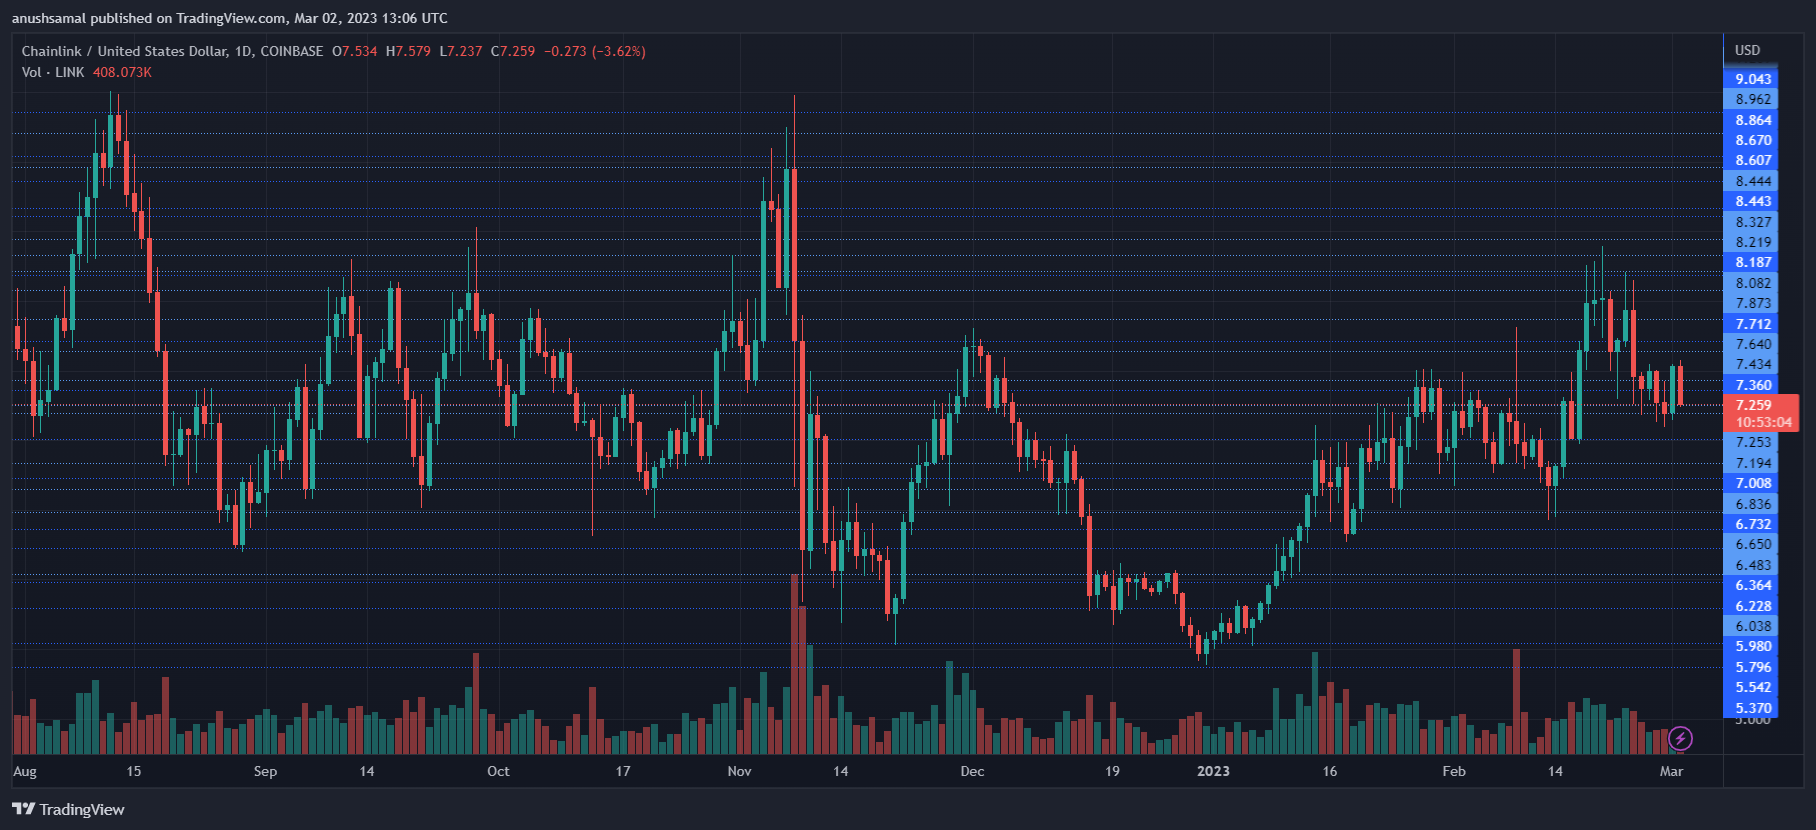
LINK was trading at .20 at the time of writing. The coin has to remain on the local support line for it to witness recovery. If LINK falls through the mark, it will bring back the bears in full force.
If LINK loses the mark, it will park at .80. Overhead resistance for the altcoin was .60; breaching that level will take the altcoin to .80. If LINK remains above .80 for a considerable period, it could target .
Trading at will invalidate the bearish thesis. The amount of Chainlink traded in the last session declined, meaning the buying strength remained low on the chart.
Technical Analysis
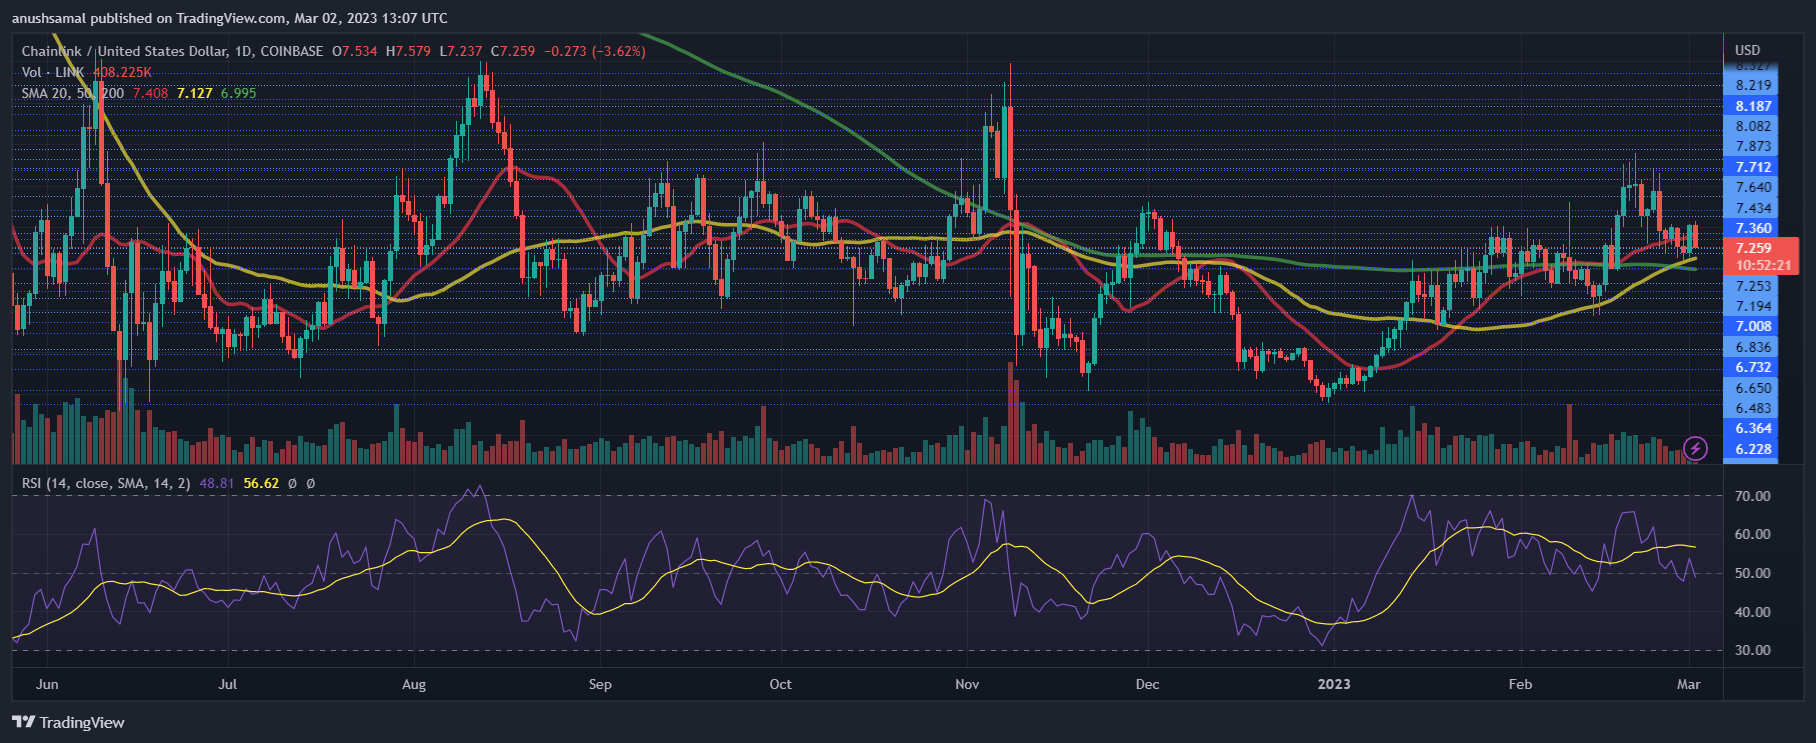
Over the last few weeks, buying strength has constantly attempted to recover but has met with resistance from the bears each time. The Relative Strength Index fell below the neutral zone, indicating bearish strength.
It suggested sellers had the upper hand; the indicator also formed a downtick. On the same note, the asset price slipped below the 20-Simple Moving Average (SMA) line as sellers continued to drive the price momentum in the market.
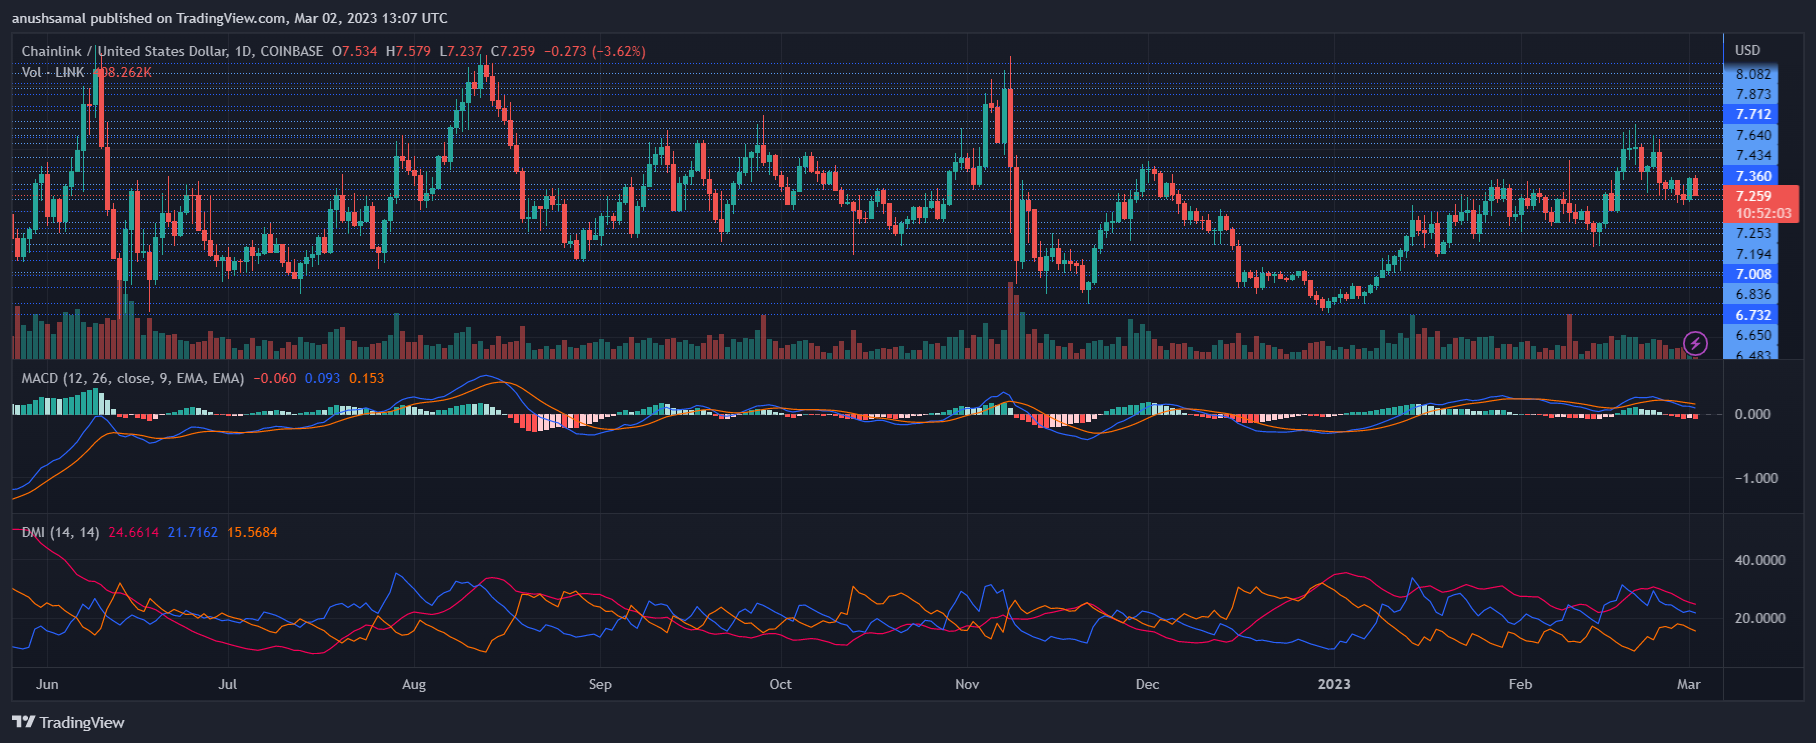
About the low buying pressure, the altcoin also displayed sell signals. The Moving Average Convergence Divergence depicted red histograms tied with sell signals. This often means the price can experience another fall over successive trading sessions.
The Directional Movement Index suggests the price direction and strength of the same. The negative indicator signaled downward price movement as the -DI line (orange) crossed over the +DI line (blue). The Average Directional Index (red) dropped near the 20-mark, which revealed that the present price trend was losing strength.
Dogecoin Moves Close To Support level, Will The Bulls Defend This Mark?
The Dogecoin price had managed to bounce off its vital support line of .080. Although the meme coin traded above the aforementioned price mark, the bulls could not hold onto the recovery. Over the last 24 hours, DOGE has managed to move up by 0.8%, confirming lateral trading. In the past, Dogecoin has retraced by 4%.
At the moment, Dogecoin has been stuck under its stiff barrier for multiple weeks now; and unless the meme-coin breaches that level, it will continue to struggle in the market.
The market structure continued to depict a bearish structure as DOGE stood right above its support level. Demand for the meme coin was also low as buying strength did not recover over the past few weeks.
Accumulation also fell as buying pressure was low. With Bitcoin slightly recovering on its daily chart, other altcoins too could move north over the upcoming trading sessions. If BTC breaches ,000, major altcoins will note a recovery. Currently, DOGE is trading 89% below its all-time high secured in 2021.
Dogecoin Price Analysis: One-Day Chart
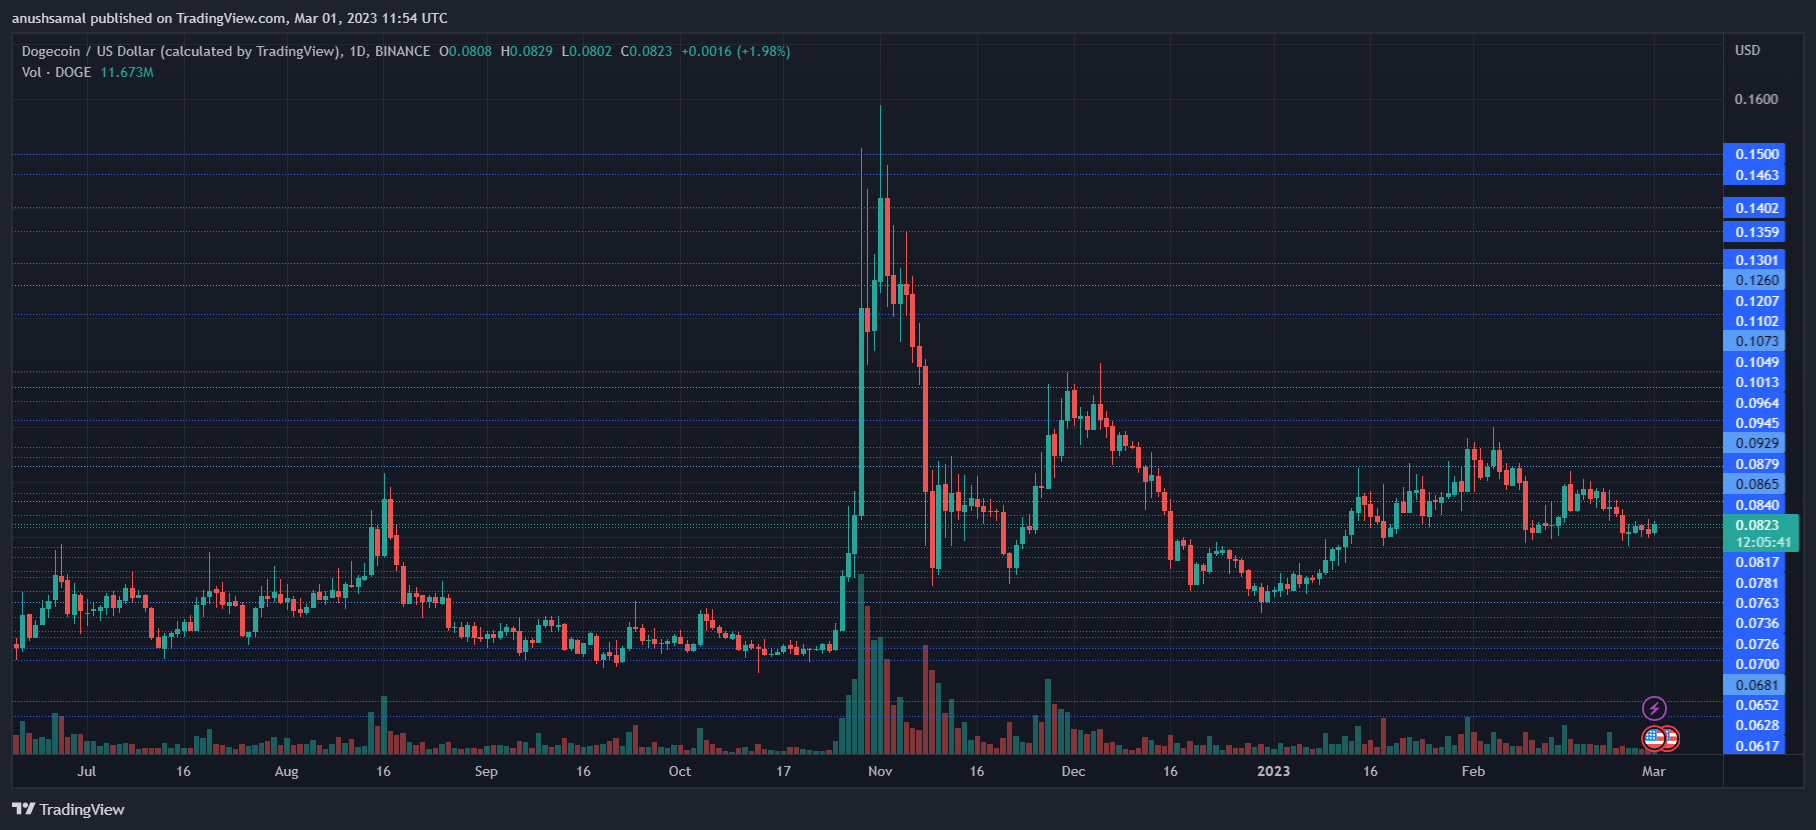
DOGE was trading at .082 at the time of writing. This is positive as it is still above .080, which has acted as a crucial support level for the meme coin. However, a fall from this mark will take the coin to .0780, but DOGE might fall further and park at .076 before the next signs of recovery.
Over the next trading sessions, Dogecoin has to just remain above the .080 mark. Overhead resistance for Dogecoin stood at .084, and a move above that could take the coin to .089, which will act as a stiff price ceiling.
Surpassing that mark will bring the bulls back to full form. The amount of Dogecoin traded in the last session was high, which indicated that sellers were dominating the market.
Technical Analysis
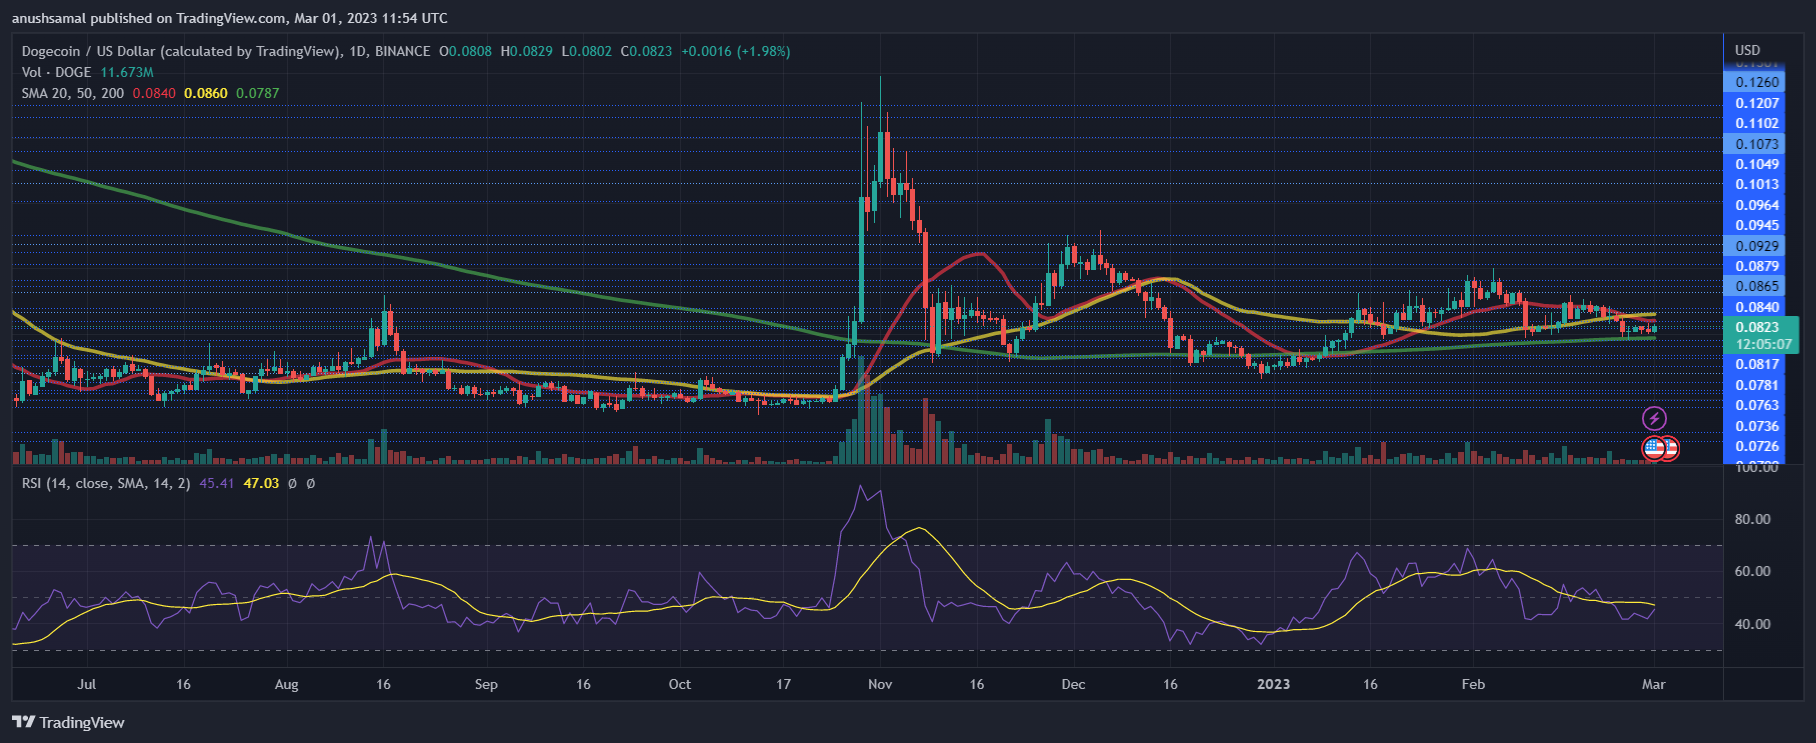
DOGE noted low buying strength for most of this month as the coin was stuck under immediate resistance. The Relative Strength Index was below the neutral line, which meant that buyers were still lower than sellers in the market.
The indicator, however, noted an uptick as an indication of buying strength trying to recover on the daily chart. Similarly, the Dogecoin price slipped below the 20-SMA to represent bearish strength as sellers were driving the price momentum in the market.
The price might attempt another leg up as the coin formed a golden cross where the 50-SMA (yellow) crossed over the 20-SMA (red), representing upcoming bullish price action.
In consonance with low buying strength, DOGE displayed sell signals on the daily chart. The Moving Average Convergence Divergence indicates price momentum and trend reversals; it formed red histograms, which are linked to sell signals for the asset. However, these sell signals were declining in size.
The Chaikin Money Flow measures the volume of capital inflows and outflows at a given time. The indicator noted an uptick and moved above the half-line, which meant that the capital inflows increased at press time.