 Riot Platforms Inc., an integrated bitcoin mining company, reported revenues exceeding .3 million in the first quarter of 2024. The revenue increase was slight, rising from .2 million to .3 million. Remarkably, this was achieved even as Riot Platforms experienced a 36% decrease in the number of bitcoins mined, down to 1,364. Modest Growth Noted […]
Bitcoin News
From Peak to Present: GBTC’s Bitcoin Holdings Decrease by 266,827 BTC in 71 Days
 As of March 22, the bitcoin holdings of Grayscale’s Bitcoin Trust (GBTC) have diminished by 27,917.37 compared to its status three days prior, now amounting to 350,252 bitcoin valued at approximately .2 billion. Since evolving into an exchange-traded fund (ETF) listed on public exchanges, GBTC has shed billions in bitcoin over the preceding 71 days. […]
Bitcoin News
Polkadot (DOT) Market Cap Dips: Q3 Sees 16% Decrease In Value
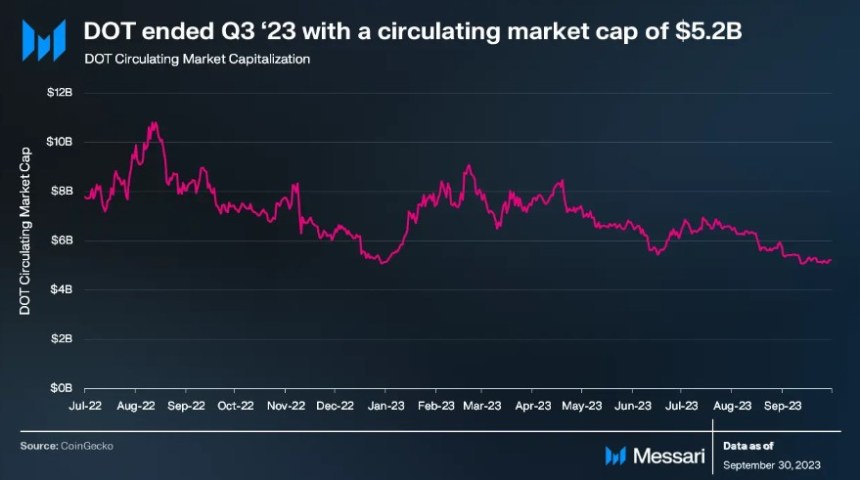
Polkadot (DOT), one of the prominent blockchain networks in the crypto space, experienced a 16% decline in market capitalization in the third quarter (Q3) of 2023, according to a recent report from Messari.
This decline came after a moderate downturn in the overall cryptocurrency market during Q3, despite favorable court rulings for XRP and Grayscale. The total crypto market capitalization declined by 5.8%, with Bitcoin (BTC) and Ethereum (ETH) falling by 7.5% and 10.0%, respectively.
Polkadot Closes Q3 With .2 Billion Market Cap
As reported by Messari, Polkadot’s market capitalization closed at .2 billion, positioning it as the 13th largest crypto asset by market cap in Q3 2023 (currently 15th).
Polkadot’s financial structure is based on a weight-based fee model, which differs from the gas-metering model in other networks, such as Ethereum.
Transaction fees in Polkadot are determined and charged before execution, with the calculation comprising a weight fee reflecting computational resources, a length fee based on transaction size, and an optional tip to incentivize block authors.
In Q3 2023, Polkadot generated revenue amounting to ,000, representing a 3% decrease compared to the previous quarter. Messari suggests that Polkadot’s revenue tends to be relatively lower compared to its competitors due to the network’s structural design.
On the other hand, the native token of Polkadot, DOT, serves three primary purposes: governance, staking, and parachain bonding. During Q3 2023, the staking percentage of DOT rose by 12% compared to the previous quarter, reaching 49%.
This increase led to reduced staking rewards and a 12% decline in the annualized nominal yield to 15%. According to Messari, the close alignment of Polkadot’s staking rate with the ideal rate demonstrates the effectiveness of its mechanism.
Polkadot’s OpenGov Milestone
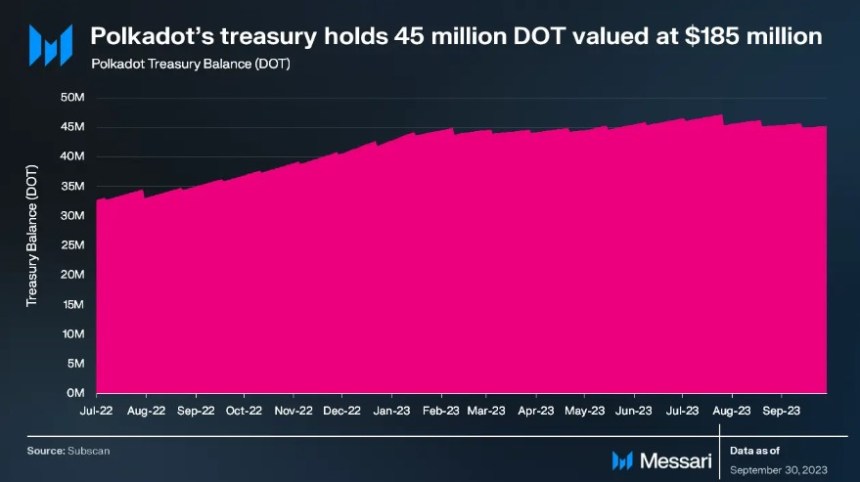
The Polkadot treasury supported various initiatives in Q3, including software development, bounties, client upgrades, and community events like meetups and hackerspaces.
According to Messari, the implementation of OpenGov on June 15 marked a significant milestone, revolutionizing treasury management and enabling concurrent proposals with distinct requirements. At the end of the quarter, the Polkadot treasury held approximately 45 million DOT (5 million).
Furthermore, Polkadot has recently completed the official release of Polkadot 1.0, marking the achievement of a significant milestone outlined in the Polkadot whitepaper.
The network’s codebase has been fully transitioned to a repository managed by the community through Polkadot OpenGov and the Technical Fellowship. The roadmap for the next iteration, Polkadot 2.0, will be determined through community discussions and consensus.
Founder Gavin Wood has proposed ideas for additional mechanisms to allocate Polkadot’s block space and for creating treaty-like agreements between multiple blockchains called “accords.”
As of this writing, the DOT token has exhibited a noteworthy upward trend since October 19, closely following Bitcoin’s lead. Presently, the token is trading at ,839, reflecting a notable increase of over 16% within the past fourteen days.
Featured image from Shutterstock, chart from TradingView.com
Shiba Inu Burn Rate Takes A Steep Dive: 91% Decrease In 24 Hours
Shiba Inu (SHIB) has recently experienced a dramatic decline in its burn rate. This plunge, amounting to a staggering 90.57%, comes at a time when the SHIB token is facing a sharp drop in its market price.
Typically, lower token prices present more extensive opportunities for token burning as it becomes more affordable to acquire additional SHIB tokens for the purpose of destroying them. However, it appears that the prevailing negative sentiment in the market is dampening the burn attempts.
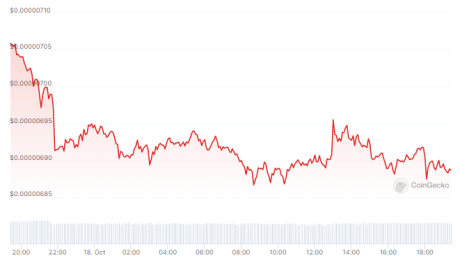
At the time of writing, the SHIB token is trading at .00000692 according to CoinGecko, marking a 1.9% decline over the past 24 hours. On a more optimistic note, the token has seen a 1.2% increase in the past seven days. It’s evident that SHIB is experiencing some turbulence in its value.
Shiba Inu: Path To Revival
Yet, Shiba Inu’s burning program is making waves by bucking the trend. In a surprising turn of events, the token’s burn rate surged by over 200%, leading to the elimination of 53 million SHIB tokens and a reduction in its overall supply. This ambitious initiative is part of a strategic effort to make SHIB scarcer and, hopefully, more valuable over time.
The successful execution of Shiba Inu’s burning program has been cited as one of the potential catalysts for a future increase in SHIB token value. The reduction in token supply can create a sense of scarcity, which often drives demand among investors.
Additionally, Shiba Inu’s innovative layer-2 blockchain solution, known as Shibarium, is another factor that could fuel a rally in SHIB’s price.
The Rise Of Shibarium
Shibarium, Shiba Inu’s layer-2 blockchain solution, was unveiled to the crypto world at the end of August, and it has since made significant strides. The network has achieved several remarkable milestones in the months following its launch.
Shibarium’s potential impact on the future of Shiba Inu cannot be underestimated, as it opens up new horizons for this meme-inspired cryptocurrency.
As Shiba Inu embarks on its journey to foster innovation and adapt to the evolving crypto landscape, the development of Shibarium stands out as a beacon of hope. The network’s rapid progress and achievements are a testament to the dedication and creativity of the Shiba Inu development team.
If Shibarium continues to hit milestones and gain traction, it could become a driving force behind the resurgence of SHIB’s value, ultimately defying the bearish market sentiment that currently looms over the crypto world.
These factors could potentially set the stage for a remarkable revival in SHIB’s value, illustrating the resilience and determination of the Shiba Inu ecosystem in the face of market challenges.
(This site’s content should not be construed as investment advice. Investing involves risk. When you invest, your capital is subject to risk).
Featured image from Coopers Fire
Ordinals Sales In Freefall: 97% Decrease Sparks Worries About Bitcoin NFT’s Extinction
Bitcoin Ordinals, once the shining star of the NFT world, is experiencing a significant downturn in both sales volume and transactions, igniting discussions about the lasting appeal of these digital collectibles.
According to a recent report from DappRadar, the fervor that propelled Bitcoin Ordinals to record-breaking heights earlier this year has dwindled, with sales volume plummeting by over 97% from its peak in May 2023.
Ordinals: A Rapid Descent In Three Months
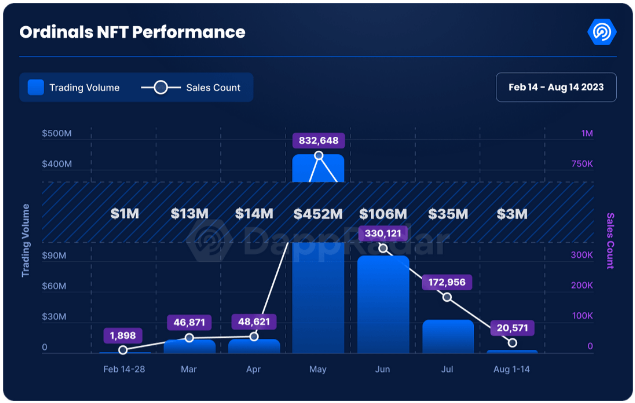
The meteoric rise of Bitcoin Ordinals, which saw its sales volume soar to a staggering 2 million in May, has taken a sharp nosedive. This once-flourishing market has seen its sales volume dwindle to a mere million in mid-August, marking a jaw-dropping 97% decline within a span of just three months.
The data paints a stark picture: June witnessed a 76.5% plunge, with sales volume hitting 0 million, while July followed suit with a 66.9% drop, settling at million. As August unfolds, a bleak 91.4% drop to million in sales volume underscores the challenges facing Bitcoin Ordinals.
Beyond The Numbers: Transaction Count And Its Implications
While fluctuations in sales volume could be attributed to the ebbs and flows of the market, the report highlights another concerning trend: a consistent reduction in transaction count.
Transactions have dwindled by a staggering 88.1% in August, sinking to a mere 20,571 compared to the robust 832,648 transactions witnessed just three months prior.
This sharp decline in transactions suggests that the interest in trading Bitcoin Ordinals is diminishing, casting a shadow of doubt on its long-term viability and relevance within the competitive NFT landscape.
Looking Ahead: A Temporary Setback Or Systemic Issue?
The coming months are poised to be pivotal in determining whether this downward spiral is merely a temporary setback or indicative of more profound challenges for Bitcoin Ordinals and NFTs tied to the cryptocurrency.
As the NFT ecosystem continues to evolve, the fate of Bitcoin Ordinals hangs in the balance. While its spectacular rise showcased the potential of NFTs within the world of digital art and collectibles, the current slump urges stakeholders to reevaluate strategies and adapt to the shifting dynamics of the market.
The waning sales volume and transaction counts of Bitcoin Ordinals have raised pertinent questions about the enduring allure of NFTs tied to the cryptocurrency.
As the NFT landscape navigates through these challenges, the industry watches closely, eager to discern whether this decline signifies a fleeting setback or signals a more profound reckoning.
(This site’s content should not be construed as investment advice. Investing involves risk. When you invest, your capital is subject to risk).
Featured image from Kyodo News/Getty
Bitcoin Fees Decrease, But Over 257,000 Pending Transactions Await Confirmation

Although the Bitcoin blockchain’s average transaction fees have decreased since surpassing per transfer on May 8, there are still over 257,000 pending transactions awaiting confirmation. Furthermore, from May 1 onwards, the network has successfully verified anywhere from 355,000 to over 682,000 transactions per day. Presently, approximately 188 blocks or 0.343 gigabytes must be mined by bitcoin miners to resolve the backlog of unconfirmed transactions.
Bitcoin’s Consistent Backlog: 188 Blocks to Clear Pending Transactions
At the time of writing, there remains a significant backlog of pending bitcoin transfers awaiting confirmation. With the average block interval set at ten minutes per block, it would require approximately 1.30 days to clear this backlog. However, a substantial portion of the backlog has been resolved since May 7 and 8, 2023, when the number of unconfirmed bitcoin transactions exceeded 500,000.
On May 8, according to data from bitinfocharts.com, the average transaction fee skyrocketed to per transaction. As of June 4, 2023, the average transaction fee stands at 0.00012 BTC or .15. The same website displays a median-sized transaction fee of 0.000053 BTC or .44 per transaction. As of 3:51 p.m. Eastern Time (ET) on June 4, 2023, according to mempool.space statistics, there are approximately 257,141 pending transactions awaiting confirmation.
To address a significant portion of this backlog, approximately 188 blocks must be successfully mined. Mempool.space provides fee data categorized into four tiers, including a “no priority” transfer costing .31 per transaction, a “low priority” transfer at .69 per transaction, a “medium priority” transaction priced at .84, and a high priority transfer for .99. At the same time, a significant portion of the blame for the high throughput and the backlog can be attributed to the nearing 11 million milestone reached by Ordinal inscriptions.
When comparing average transfer fees, Bitcoin outperforms Ethereum’s network fees, with data revealing that the average ETH transfer fee amounts to 0.0029 ETH or .46 per transaction. The median-sized network fee on Ethereum is 0.0012 ETH or .30 per transaction. Interestingly, Etherscan’s gas tracker, similar to mempool.space, displays lower fees for ether transfers compared to the figures shown on bitinfocharts.com.
For instance, at 3:51 p.m. (ET) on Sunday, a high-priority ETH transaction only incurs a fee of .84 per transfer. While Bitcoin established a record of 682,000+ transactions per day on May 1, Ethereum surpasses this by clearing anywhere between 930,000 to 1 million transactions daily.
What are your thoughts on the current state of Bitcoin transactions? Are the decreasing fees and ongoing backlog a cause for concern or a temporary challenge? Share your thoughts and opinions about this subject in the comments section below.
Market Strategist Michael Wilkerson Believes US Inflation Could Rise to 12% by Year-End Despite Predictions of Decrease

While several market strategists and analysts expect U.S. inflation to drop considerably in 2023 compared with last year, Michael Wilkerson, founder of Stormwall Advisors, thinks the inflation rate could climb as high as 12% by the end of this year. The country’s inflation rate has cooled down over the past seven months, but Wilkerson insists that the U.S. Federal Reserve “is going to run out of firepower.”
Stormwall Advisors’ Michael Wilkerson Believes U.S. Will ‘See Another Spike up’ in Inflation
Over the last two months, many reports have stated that inflation has peaked, and in the U.S., the consumer price index (CPI) has dropped for seven consecutive months since its high in June 2022. In a recent interview between Kitco News anchor Michelle Makori and Michael Wilkerson, founder of Stormwall Advisors, Wilkerson expressed his expectation of another surge in U.S. inflation. While acknowledging that his view is in the minority, Wilkerson emphasized that “inflation doesn’t move in a linear path; you do see some cycling.”
“I don’t believe we’ve seen the end of inflation and I do think we’re gonna see another spike up,” Wilkerson said during his interview. “Whether it’s 8% or 12%, nor can I say precisely what it will be by the end of 2023, but I do believe that it is possible that we find ourselves back in that range this year.”
Wilkerson explained how the M2 money supply has grown since 2008 and has further ballooned during the Covid-19 pandemic. As the executive of Stormwall Advisors and author of “Why America Matters: The Case for a New Exceptionalism,” Wilkerson asserted that the increase in the money supply inevitably results in an accompanying increase in prices, as evidenced by historical patterns. He believes that, from the perspective of policymakers, inflation is a preferable option since it is the “lesser of two evils.”
“The Fed is going to run out of firepower,” Wilkerson told Makori. “Ultimately, this becomes a trade-off between tamping down on inflation, slaying the inflationary dragon, and allowing recession and unemployment to rise. And governments, always and everywhere, choose inflation,” he added.
Several analysts and economists believe, however, that inflation will decrease this year. For example, economist Mohamed El-Erian of the University of Cambridge expects inflation to become “sticky” at around 4% in midyear. Adam Posen, the president of the Peterson Institute for International Economics and former Bank of England official, anticipates that U.S. inflation will reach the 3% range by the end of 2023. “Getting from the high inflation where we are now towards 3% is baked in,” Posen said at the end of Dec. 2022.
During his conversation with Makori, Wilkerson shared a contrarian view and emphasized that price inflation would eventually catch up. “The money supply increased by 40 percent just from the year 2000,” Wilkerson said. “There has never been a time in history when the money supply increased by that much without resulting in inflation — price inflation always catches up with money supply inflation.”
Do you agree with Wilkerson’s contrarian view on inflation, or do you think the predictions of other economists will hold true? Share your thoughts about this subject in the comments section below.
BUSD Stablecoin Drops from Top 10 Crypto Assets Amid Significant Decrease in Dominance

After Paxos announced that it would no longer mint the stablecoin BUSD, 4.98 billion BUSD stablecoins have been removed from circulation to date. The Paxos-managed stablecoin has also fallen out of the top ten crypto assets by market capitalization, slipping below dogecoin’s valuation with a market cap of around .12 billion, compared to the meme coin’s .24 billion.
BUSD Redemption: Almost Billion Worth of Stablecoins Removed from Circulation in 12 Days
Since Paxos announced on Feb. 13, 2023, that it would no longer issue the dollar-pegged crypto asset BUSD, nearly billion worth of BUSD stablecoins have been redeemed. At the time of the announcement, there were approximately 16.1 billion BUSD coins in circulation, but today there are around 11,129,348,406 BUSD circulating. Throughout the past 12 days and the redemption of 4.98 billion BUSD, the dollar-pegged crypto asset has remained at parity with the U.S. dollar.
On Feb. 25, 2023, Binance’s reserve portfolio showed that the crypto exchange held .01 billion in BUSD. Globally, BUSD had a 24-hour trade volume of around .84 billion, with Binance being the most active BUSD exchange, according to coingecko.com stats. The majority of BUSD trades were paired with the stablecoin tether (USDT), while the Turkish lira still accounted for 2.80% of all BUSD trades on Saturday.
Currently, out of the .1 trillion crypto economy, BUSD accounts for 1.007% of the aggregate value. That dominance has decreased significantly over the past 12 days, and BUSD was officially removed from the top ten crypto coin positions this weekend. As of writing, BUSD is the 11th largest market valuation out of the thousands of crypto assets in existence, with a market cap below dogecoin (DOGE) and above lido staked ether (STETH).
What do you think about the nearly billion worth of BUSD stablecoins redeemed over the past 12 days, causing the asset to drop from the top ten positions? Share your thoughts on this subject in the comments section below.
Next Bitcoin Mining Difficulty Change Estimated to Decrease as Block Times Have Lengthened
The last two mining difficulty changes on the Bitcoin network have driven difficulty to an all-time high, causing a decrease in hashrate and block interval speed. Before the latest difficulty retarget increase of 4.68%, block intervals were faster than the 10-minute average, at approximately 8 minutes 54 seconds to 9 minutes 31 seconds. However, since the change, block times have slowed, with statistics showing durations of 10 minutes 44 seconds to 10 minutes 36 seconds.
Slower-Than-Average Block Intervals May Lead to Decrease in Bitcoin Mining Difficulty
The next mining difficulty change is slated for Feb. 12, 2023. At the time of writing, metrics indicate the difficulty could drop as low as 5.6% below the current rate. The decline in estimated mining difficulty for Bitcoin is due to slower-than-average block intervals. Prior to the last two difficulty increases, block times were faster, leading to the increases. Currently, data shows that block times have slowed since the last difficulty change, with times ranging from 10 minutes 44 seconds to 10 minutes 36 seconds.
Bitcoin’s hashrate has been below average, with an average of 279 exahash per second (EH/s) over the past 2,016 blocks. As of 11:30 a.m. ET on Feb. 4, 2023, statistics show the hashrate at 258 EH/s. On Feb. 1, 2023, the total hashrate dropped to 217 EH/s after reaching a peak of 279 EH/s the previous day. The hashrate then increased, reaching 309 EH/s on Feb. 2, before declining 16.50% to its current level of 258 EH/s.
As of Saturday, the top Bitcoin mining pool is Foundry USA, with 90.61 exahash per second (EH/s) or 33.4% of the total hashrate. Foundry is followed by Antpool (18.14%), F2pool (14.08%), Binance Pool (13.13%), and Viabtc (9.07%). Thirteen known Bitcoin mining pools are contributing hashrate to the blockchain, while unknown miners, known as stealth miners, control 1.67% of the hashrate, or 4.53 EH/s. If the slowdown in block intervals results in a difficulty decrease eight days from now, miners will receive a two-week reprieve from the all-time high difficulty.
What impact will the decrease in Bitcoin’s mining difficulty have on the cryptocurrency’s overall network and hashrate? Let us know what you think about this subject in the comments section below.
TA: Bitcoin Price Starts Corrective Decrease, Can Bulls Protect Losses
Bitcoin extended increase above the ,000 level against the US Dollar. BTC is correcting losses, but it might find support near the ,000 support zone.
- Bitcoin climbed further higher above ,000 before it faced sellers.
- The price is trading near ,750 and the 100 hourly simple moving average.
- There was a break below a key bullish trend line with support near ,250 on the hourly chart of the BTC/USD pair (data feed from Kraken).
- The pair is correcting gains, but dips could be limited below the ,000 level.
Bitcoin Price Corrects Gains
Bitcoin price extended increase above the ,200 resistance zone. BTC even spiked above the ,000 level on two occasions before the bears took a stand.
A high was formed near ,420 and the price is now correcting lower. There was a move below the 23.6% Fib retracement level of the key increase from the ,660 swing low to ,420 high. Besides, there was a break below a key bullish trend line with support near ,250 on the hourly chart of the BTC/USD pair.
Bitcoin price is now trading near ,750 and the 100 hourly simple moving average. On the upside, an initial resistance is near the ,000 level.
Source: BTCUSD on TradingView.com
The next major resistance is near the ,200 level. A clear move above the ,200 level might send the price towards the ,000 resistance. Any more gains may perhaps call for a test of the ,400 resistance zone. The next major resistance is near the ,500 level, where the bears might appear.
More Losses in BTC?
If bitcoin fails to start a fresh increase above ,200, it could continue to move down. An immediate support on the downside is near the ,500 zone. The first major support is seen near the ,000 zone.
The 50% Fib retracement level of the key increase from the ,660 swing low to ,420 high is also near the ,000 level. A downside break below the ,000 support zone could lead the price towards the ,500 level. Any more losses might push the price towards the ,500 support zone in the coming sessions.
Technical indicators:
Hourly MACD – The MACD is slowly losing pace in the bearish zone.
Hourly RSI (Relative Strength Index) – The RSI for BTC/USD is now below the 50 level.
Major Support Levels – ,500, followed by ,000.
Major Resistance Levels – ,200, ,000 and ,400.