 On Tuesday, the U.S. Bureau of Labor Statistics released its Consumer Price Index (CPI) report, indicating a 0.3% rise in January. Following the release, all three major stock indices experienced a decline, Treasury yields climbed, and crypto assets took a hit, moving downward from their recent peaks. Stocks Dip, Crypto Slumps as January CPI Data […]
Bitcoin News
Ethereum Bears Keep Pushing, Why Decline Isn’t Over Yet
Ethereum price is again moving lower from the ,325 resistance. ETH could decline heavily if there is a move below the ,270 support zone.
- Ethereum is showing a few bearish signs from the ,325 zone.
- The price is trading below ,300 and the 100-hourly Simple Moving Average.
- There is a key bearish trend line forming with resistance near ,300 on the hourly chart of ETH/USD (data feed via Kraken).
- The pair might start a fresh increase if it manages to clear the ,325 resistance zone.
Ethereum Price Struggles Below ,325
Ethereum price attempted a fresh increase above the ,300 level. However, ETH faced strong selling interest near the ,325 zone. A high was formed near ,327 and the price started a fresh decline, like Bitcoin.
There was a move below the ,300 support zone. The price even spiked below ,280 and traded below the 50% Fib retracement level of the upward move from the ,241 swing low to the ,327 high. Ethereum is now trading below ,300 and the 100-hourly Simple Moving Average.
The bulls are now protecting the ,270 support or the 61.8% Fib retracement level of the upward move from the ,241 swing low to the ,327 high. On the upside, the first major resistance is near the ,300 level. There is also a key bearish trend line forming with resistance near ,300 on the hourly chart of ETH/USD.
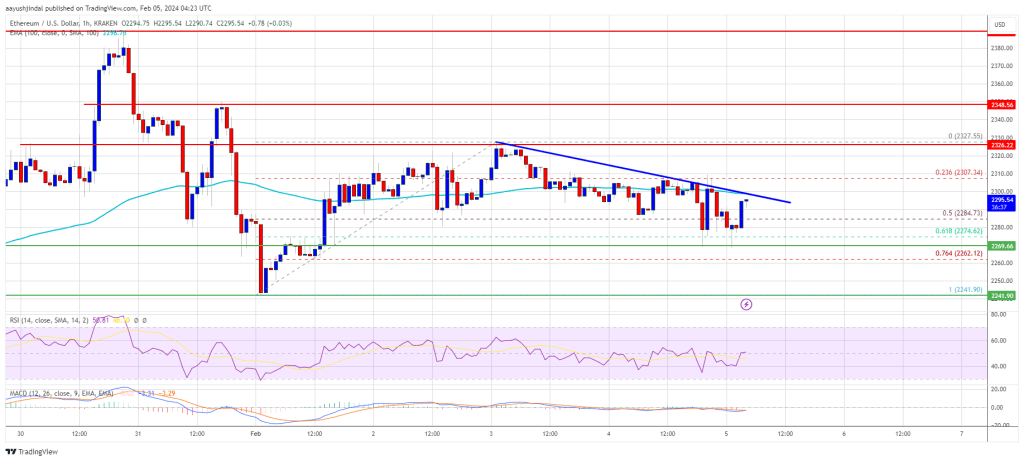
Source: ETHUSD on TradingView.com
The next major resistance is near ,325, above which the price might rise and test the ,380 resistance. If the bulls push the price above the ,380 resistance, they could aim for ,440. A clear move above the ,440 level might send the price further higher. In the stated case, the price could rise toward the ,500 level.
More Losses in ETH?
If Ethereum fails to clear the ,325 resistance, it could start another decline. Initial support on the downside is near the ,270 level.
The next key support could be the ,240 zone. A clear move below the ,240 support might send the price toward ,200. The main support could be ,120. Any more losses might send the price toward the ,080 level.
Technical Indicators
Hourly MACD – The MACD for ETH/USD is losing momentum in the bearish zone.
Hourly RSI – The RSI for ETH/USD is now below the 50 level.
Major Support Level – ,240
Major Resistance Level – ,325
Socialfi’s Shining Star Friend.tech Dims: A Tale of Decline and Disinterest

Just a few months back, social finance (socialfi) platforms were the talk of the town, with Friend.tech leading the charge amidst surging popularity. Yet, as the curtains closed on October 2023, this once-celebrated socialfi platform witnessed a sharp decline in user engagement, and data from defillama.com revealed a steep fall in its revenue.
From Crypto Craze to Quiet Decline
During the height of the socialfi buzz in mid-August, crypto enthusiasts couldn’t stop discussing platforms like Friend.tech, a decentralized network driven by social tokens. Friend.tech introduced a novel concept allowing users to purchase and sell “keys” to initiate conversations with others, essentially letting individuals capitalize on their social influence. By Aug. 21, 2023, Friend.tech boasted an impressive tally of 1.51 million transactions and 0K in revenue within a 24-hour span.
Come mid-September 2023, daily transactions on Friend.tech fluctuated between 250,000 and over 500,000. Yet, the platform began to experience a marked downturn in activity and revenue post-Oct. 29, 2023. Transactions nosedived by nearly 90%, and revenue tumbled from a mid-September peak of .14 million to under ,000 by February 3, 2024. According to defillama.com, the total value locked (TVL) in Friend.tech also saw a reduction, dropping from million to a present .33 million.
Nowadays, mentions of Friend.tech on social media platforms like X are few and far between, save for discussions on its rapid decline. Haseeb Qureshi, the managing partner at the cross-border crypto venture fund Dragonfly, lamented on X, “Wow. Friend.tech really went from crypto darling to desertion in about 4 months.” Besides Friend.tech, the Arbitrum blockchain mimic, Post.tech, too has been facing a similar slump in activity.
A glance at Google Trends further reveals that interest in Friend.tech has been waning since the tail end of August. The search term “Friend.tech” hit its zenith with a score of 100 during the week of Aug. 20 to Aug. 26, 2023. Currently, the search interest for “Friend.tech” on Google Trends hovers at a mere 3 out of 100. Despite the global downturn in interest, the top five regions still showing curiosity in the socialfi platform include China, Nigeria, Singapore, Switzerland, and Portugal.
Why do you think interest in Friend.tech has declined? Share your thoughts and opinions about this subject in the comments section below.
Bitcoin Price Decline To Resume? These Could Be The Factors To Watch
Bitcoin price struggled to clear the ,750 resistance. BTC is now declining and there could be more losses if there is a move below the ,800 level.
- Bitcoin price is slowly moving lower from the ,750 resistance zone.
- The price is trading below ,800 and the 100 hourly Simple moving average.
- There was a break below a connecting bullish trend line with support near ,500 on the hourly chart of the BTC/USD pair (data feed from Kraken).
- The pair could continue to decline if there is a close below the ,800 level.
Bitcoin Price Starts Another Decline
Bitcoin price attempted more gains above the ,500 resistance zone. BTC cleared the ,500 resistance zone, but the bears were active near the ,800 zone.
The bulls made more than two attempts to clear ,800 but failed. A high was formed near ,742 and the price started a fresh decline. There was a move below the ,000 level. Besides, there was a break below a connecting bullish trend line with support near ,500 on the hourly chart of the BTC/USD pair.
Bitcoin is now trading below ,800 and the 100 hourly Simple moving average. A low was formed near ,888 and the price is now consolidating losses. Immediate resistance is near the ,350 level. It is near the 23.6% Fib retracement level of the downward move from the ,742 swing high to the ,888 low.
The next key resistance could be ,800 or the 50% Fib retracement level of the downward move from the ,742 swing high to the ,888 low, above which the price could start a decent increase. The next stop for the bulls may perhaps be ,200.

Source: BTCUSD on TradingView.com
A clear move above the ,200 resistance could send the price toward the ,800 resistance. The next resistance is now forming near the ,200 level. A close above the ,000 level could push the price further higher. The next major resistance sits at ,500.
More Losses In BTC?
If Bitcoin fails to rise above the ,800 resistance zone, it could continue to move down. Immediate support on the downside is near the ,800 level.
The first major support is ,200. The main support could be ,950. If there is a close below ,950, the price could gain bearish momentum. In the stated case, the price could dive toward the ,000 support.
Technical indicators:
Hourly MACD – The MACD is now losing pace in the bearish zone.
Hourly RSI (Relative Strength Index) – The RSI for BTC/USD is now below the 50 level.
Major Support Levels – ,800, followed by ,200.
Major Resistance Levels – ,350, ,800, and ,800.
Peckshield Report Reveals Decline in Crypto Losses Despite Persistent Threats in 2023

Peckshield’s latest report reveals a mix of challenges and advancements in the crypto world. Despite a notable decrease in overall losses to hacks and scams, decentralized finance protocols remain heavily targeted, accounting for a significant portion of the cyber thefts.
Peckshield Report Unveils 27.78% Drop in 2023 Losses and Over 4 Million in Crypto Recovered
In an analysis of the 2023 cryptocurrency landscape, blockchain security firm Peckshield revealed a decrease in losses due to hacks and scams compared to the previous year, despite ongoing challenges in securing digital assets. The firm’s data, summarized in a report released on Jan. 29, sheds light on the evolving nature of threats in the crypto space and the strategies deployed to mitigate them.
#PeckShieldAlert 2023 saw 600+ major hacks in the crypto space, resulting in ~.61B in losses, with 4.9M recovered.
.51B lost to hacks (excluding #Multichain unauthorized withdrawals) & .1B to scams. This marks a 27.78% decrease from 2022. #DeFi protocols remained prime… pic.twitter.com/G7PIU3WyrX— PeckShieldAlert (@PeckShieldAlert) January 29, 2024
Peckshield’s findings show a 27.78% decline in total losses from cyber thefts in 2023, amounting to approximately .61 billion, compared to around .6 billion in 2022. This decrease is noteworthy in the context of the expanding digital asset ecosystem.
The firm tracked over 600 major hacks throughout the year, with around 4.9 million successfully recovered. This figure represents a significant improvement over the 3 million recovered in 2022, attributed to more active negotiations with hackers and increased implementation of bug bounty programs.
Despite the overall decrease in losses, decentralized finance (defi) protocols continued to be the primary target, accounting for 67% of the total value stolen. This trend highlights the persistent vulnerabilities in the defi sector, which have been a focal point for cybercriminals.
Peckshield’s report also points out that flash loan attacks constituted 40% of the hacks in 2023, underlining the continuing threat in innovative yet potentially exploitable financial mechanisms in the crypto domain.
The recovery of stolen funds was aided by collaboration with centralized exchanges, Tether, and law enforcement agencies. These entities played a crucial role in freezing assets upon detection, thereby facilitating their recovery.
An intriguing aspect of the report is the shift in the nature of illicit crypto transactions. From 2018 to 2021, Bitcoin was the predominant currency in illegal transactions. However, in 2022 and 2023, there was a noticeable shift towards stablecoins, reflecting the changing landscape of cryptocurrency usage in unauthorized activities. This shift towards a preference for stablecoins is corroborated by the recent Chainalysis report that came to the same conclusion.
Do you expect the decline in crypto losses to continue into 2024? Share your thoughts and opinions about this subject in the comments section below.
Ethereum Price Loses Steam – This Resistance Could Spark Another Decline
Ethereum price jumped above the ,280 resistance zone. ETH could gain bullish momentum if it clears the ,330 resistance zone.
- Ethereum started a decent increase above the ,250 resistance zone.
- The price is trading above ,280 and the 100-hourly Simple Moving Average.
- There was a break above a connecting bearish trend line with resistance near ,260 on the hourly chart of ETH/USD (data feed via Kraken).
- The pair might struggle to clear the ,325 resistance zone and might correct lower.
Ethereum Price Revisits Resistance
Ethereum price started a decent increase above the ,250 resistance zone. ETH cleared the ,280 resistance zone like Bitcoin to start a steady recovery wave.
The bulls even pushed the price above the ,300 resistance. There was a break above a connecting bearish trend line with resistance near ,260 on the hourly chart of ETH/USD. A new weekly high was formed near ,327 and the price is now consolidating gains.
It is now trading above the 23.6% Fib retracement level of the upward move from the ,234 swing low to the ,327 high. Ethereum is also trading above ,280 and the 100-hourly Simple Moving Average.
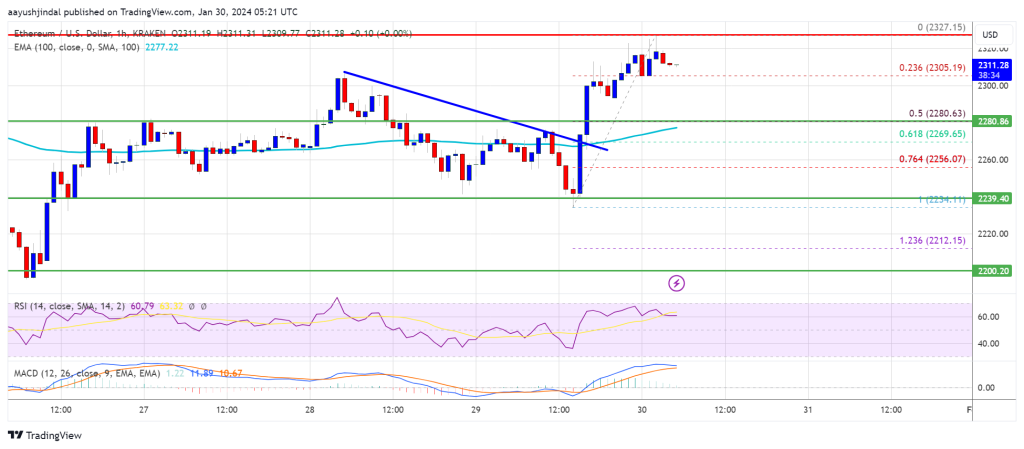
Source: ETHUSD on TradingView.com
On the upside, the first major resistance is near the ,330 level. The next major resistance is near ,350, above which the price might rise and test the ,420 resistance. If the bulls push the price above the ,420 resistance, they could aim for ,450. A clear move above the ,450 level might start a decent increase. In the stated case, the price could rise toward the ,550 level.
Another Bearish Wave in ETH?
If Ethereum fails to clear the ,330 resistance, it could start another decline. Initial support on the downside is near the ,300 level.
The next key support could be the ,280 zone or the 50% Fib retracement level of the upward move from the ,234 swing low to the ,327 high. A daily close below the ,280 support might start another major decline. In the stated case, Ether could test the ,200 support. Any more losses might send the price toward the ,120 level.
Technical Indicators
Hourly MACD – The MACD for ETH/USD is losing momentum in the bullish zone.
Hourly RSI – The RSI for ETH/USD is now above the 50 level.
Major Support Level – ,280
Major Resistance Level – ,330
Morgan Stanley on Decline of US Dollar, JPMorgan Warns of a BTC Selloff, BTC Mining Improved, and More — Week in Review

Morgan Stanley has raised concerns about the potential decline of the U.S. dollar’s dominance due to the increasing interest in digital currencies. Meanwhile, JPMorgan has warned of a potential bitcoin selloff, anticipating a billion outflow from Grayscale’s Bitcoin fund. The profitability of Bitcoin’s SHA256 algorithm in mining operations has significantly improved, now ranking as the third most lucrative proof-of-work network. Finally, Jim Cramer of CNBC’s Mad Money expressed skepticism about bitcoin’s future, doubting its ability to recover amidst ongoing market challenges.
Morgan Stanley Sounds Alarm on US Dollar’s Dominance — Says Crypto Could Significantly Alter Currency Landscape

Morgan Stanley has warned about the risk of the U.S. dollar losing its dominance, fueled by growing interest in digital assets, including bitcoin. The investment bank stated: “A clear shift towards reducing dollar-dependency is evident, simultaneously fueling interest in digital currencies such as bitcoin, stablecoins, and CBDCs.”
JPMorgan Warns of Incoming Bitcoin Selloff With Anticipated Billion Grayscale Outflow

Global investment bank JPMorgan has warned of additional outflow from Grayscale’s bitcoin fund, cautioning that it will put “further pressure on bitcoin prices over the coming weeks.” The bank’s analyst also explained that the billion inflow into new spot bitcoin exchange-traded funds (ETFs) “reflects a rotation from existing bitcoin vehicles” or “from retail investors shifting from digital wallets held with exchanges/retail brokers to cheaper spot bitcoin ETFs.”
Mining Digital Gold — These Are the Most Profitable Proof-of-Work Algorithms in 2024

In September 2022, Bitcoin’s SHA256 algorithm ranked as the seventh most lucrative proof-of-work (PoW) network for mining. Fast forward a year and four months, and this algorithm has ascended to become the third most profitable crypto network for mining operations.
Mad Money Host Jim Cramer Doubts Bitcoin Will Find Its Footing as Selloff Continues

Jim Cramer, the host of CNBC’s Mad Money show, has doubled down on his bearish bitcoin price outlook, predicting that the cryptocurrency will continue to struggle against the backdrop of a plummeting crypto market. “Unlikely that bitcoin finds its footing,” Cramer emphasized, after previously declaring the recent price drop a “nasty beginning” to a significant downward spiral.
Where would you put crypto market sentiment right now? Share your thoughts and opinions about this subject in the comments section below.
Chainalysis Reveals Decline in Crypto Crime, Shift to Stablecoins in 2024 Crime Report

Chainalysis’ latest report reveals a dual trend in the 2023 crypto crime landscape: a notable decrease in overall value of criminal transactions and a surprising shift from bitcoin to stablecoins as the preferred medium for illicit activities.
2024 Chainalysis Report Reveals a Decline in Crypto Criminal Activity, Shift in Currency Preference to Stablecoins
In a revealing analysis of the cryptocurrency landscape, the 2024 Crypto Crime Trends Report by Chainalysis has potentially revealed shifts in the pattern of illicit activities within the digital currency space. The report, which provides a still-developing view of crypto-related crimes in 2023, has highlighted a notable decrease in the overall volume of criminal transactions, alongside a turn towards stablecoins by cybercriminals.
According to Chainalysis, the total value received by illicit cryptocurrency addresses in 2023 fell to .2 billion, marking a considerable decrease compared to previous years. This figure, however, is an underestimation and is expected to rise as more illicit addresses are uncovered. Apropos, the report revised the 2022 illicit transaction volume from an initial estimate of .6 billion to .6 billion, a more than 90% increase. This significant revision is attributed to the identification of new illicit addresses and the inclusion of transactions from sanctioned services.
Another reason the new total is so much higher, is the inclusion of .7 billion in creditor claims against the now-defunct cryptocurrency exchange FTX, following the fraud conviction of its CEO. This decision represents a departure from Chainalysis’ standard methodology, which typically focuses on measurable on-chain activity.
In a notable shift, the report observes that stablecoins have surpassed bitcoin as the preferred currency for illicit transactions. This change in preference aligns with the overall increase in stablecoin usage in both legitimate and illicit crypto activities. Despite this trend, bitcoin continues to dominate in specific criminal activities, such as darknet market sales and ransomware extortion.
Other key findings include a significant reduction in revenues from crypto scamming and hacking, which decreased by 29.2% and 54.3% respectively. The report attributes these reductions to a change in scamming strategies and improvements in defi protocol security.
The report also sheds light on the increasing role of transactions with sanctioned entities, which accounted for a significant 61.5% of all illicit transaction volumes in 2023. This trend raises questions about how to distinguish between criminal activities and legitimate transactions within sanctioned jurisdictions.
The report has garnered mixed reactions on social media, providing a striking example of confirmation bias in action. Both crypto enthusiasts and detractors have cited the report to bolster their opposite opinions on digital assets.
Overall, do you think crypto-based crime represents an increasing or decreasing amount of total crypto transaction volume? Share your thoughts and opinions about this subject in the comments section below.
Bitcoin Transaction Fees See Sharp Decline Since December Peak, Network Congestion Persists

On Jan. 10, 2024, the fee for high-priority transactions is set at 42 satoshis per virtual byte (sats/vB), amounting to .66 per transaction. The average transaction fee stands at 98.9 sats/vB, equivalent to .17 per transfer. Although there has been a decline in onchain fees, they currently remain at their highest level since May 2021. Moreover, the network is still experiencing congestion with 262,143 transactions awaiting confirmation.
Bitcoin’s Onchain Fees Plunge Post-December Peak
Since mid-December 2023, when Bitcoin’s onchain fees peaked at to per average transfer, there has been a significant decrease. The average onchain fees have plunged by over 69% from that peak, currently standing at 0.00025 BTC, or .17 per transfer as of Wednesday. According to bitinfocharts.com, a transaction with a median size fee will incur a cost of 0.000096 BTC, or .32.
Data from mempool.space shows that for high-priority transactions, the cost is now 42 sats/vB, translating to .66 per transaction. As of Jan. 10, 2024, the fee for a no-priority transaction is .28 per onchain transaction. The mempool is currently clogged with 262,143 pending transactions, and block intervals are exceeding the usual 10-minute average. Mempool.space reports the average block time as approximately 10 minutes and 54 seconds.
To process all the unconfirmed transactions, it will take 546 blocks or 743.83 megabytes (MB) of block space. The backlog of unconfirmed transactions has seen a reduction over the past week, coinciding with a slowdown in Ordinal inscription mints. The Bitcoin hash price, which estimates the daily value of 1 petahash per second (PH/s) of hashing power, stands at .66. This figure is slightly down from the .05 per PH/s it reached at 7 a.m. Eastern Time the previous day, Tuesday.
Last week, onchain fees stood higher, with 351,371 transactions in the queue awaiting miner approval. The cost for a high-priority transfer was then 129 sats/vB, amounting to .73, marking a 190% increase compared to today’s rates. The congestion that’s plagued Bitcoin for a year now, coupled with the current fee structure, reflects the dynamic nature of Bitcoin’s network and the ongoing challenges in balancing demand, transaction processing speed, and cost.
What do you think about the latest Bitcoin network fees and the protocol’s miners grappling with congestion in the backlog? Share your thoughts and opinions about this subject in the comments section below.
Analyst Says Expect A Decline To $30,220 If Bitcoin Loses This Support
An analyst has explained how a decline to ,220 or below could happen for Bitcoin if the strong support range below the current price gets lost.
Bitcoin Has Strong Support Between ,560 And ,245 Right Now
In a new post on X, analyst Ali has discussed how Bitcoin is floating above a strong on-chain support wall currently. In on-chain analysis, the potential of any price level to act as support or resistance lies in the amount of Bitcoin that was last purchased at said level.
This is because the investors naturally treat their cost basis or acquisition price in a special way and are thus more prone to make moves when the spot price retests it.
Such a reaction from the investors isn’t relevant when only a few of them share their cost basis at a particular level, but if the level observed a large amount of buying, its retest could indeed end up imparting some effects on the price. This is why the strength of any support or resistance level lies in the density of coins that were acquired at the level.
Now, to see the various price ranges in terms of the Bitcoin acquired at them, Ali has cited the “UTXO Realized Price Distribution” (URPD) from the on-chain analytics firm Glassnode.
This metric prices coins (or more precisely, UTXOs) based on the value at which they were last transferred on the BTC blockchain. Now, here is a chart that shows how this distribution is looking for the asset at the moment:
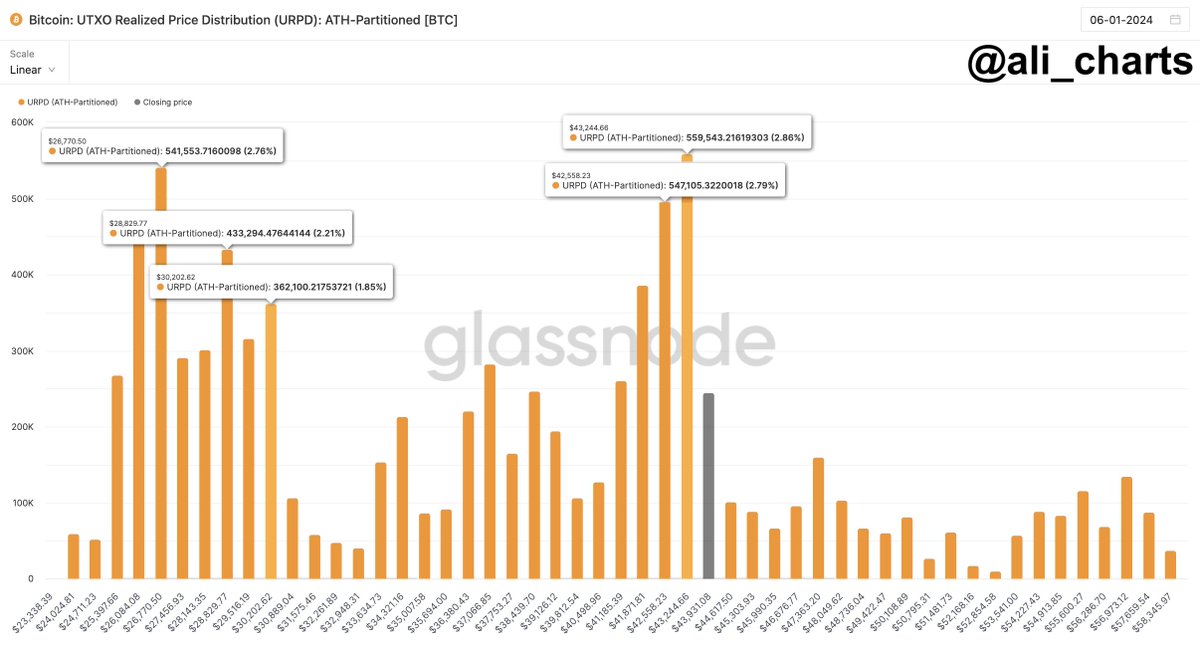
As displayed in the above graph, the price levels between ,560 and ,245 hold the cost basis of a large amount of UTXOs. To be more specific, this range saw the investors acquire a total of 1.11 million BTC.
At present, Bitcoin is a decent distance above this range. This means that the holders who have their cost basis inside it would be in profit right now.
Usually, such holders are more likely to accumulate further when the price retests their cost basis, as they would feel confident that the same level could prove profitable again in the future.
Due to this reason, the retest of a major supply block from above can end up with the cryptocurrency feeling some support. Since the ,650 to ,245 range is quite heavy with investors currently, BTC should have a strong support base to fall back on, should things go wrong.
“If Bitcoin can hold above this level, there is not much significant resistance ahead that will prevent it from advancing further,” explains the analyst. This is because there aren’t any large supply blocks at the upcoming ranges.
Investors in losses (which those with cost basis at the prices ahead would be) can be desperate to exit at their break-even, so a retest of their cost basis can provide resistance. As such, BTC has no major resistance ahead.
“But if ,560-,245 fails to hold, expect a downswing to the next critical area of interest between ,770 and ,220,” warns Ali. From the current spot price, a drop to the upper end of this range, ,220, would mean a drawdown of more than 32% for Bitcoin.
BTC Price
Bitcoin has observed a strong surge during the past day and is now challenging the ,000 level once more.