 Minneapolis Federal Reserve President Neel Kashkari addressed Bank of America’s prediction for a potential Fed interest rate cut this year in an interview with CBS News on Sunday. Bank of America predicts that the Fed will cut rates once this year, likely in December. “I think that’s a reasonable prediction,” Kashkari said, noting that it […]
Bitcoin News
Is Bitcoin About To Skyrocket? Bitfinex Analysts Spot Familiar Patterns From December 2020
According to analysts at Bitfinex, Bitcoin and its recent activity on exchanges reflects a pattern reminiscent of December 2020, hinting at a possible growth phase.
The exchange’s latest report highlights a significant decline in the supply of Bitcoin held by long-term investors on centralized exchanges, reaching its lowest levels in 18 months.
This trend, coupled with the forthcoming halving event, suggests a scenario conducive to further price appreciation, as stated by the analysts.
Potential Growth On The Horizon
The Bitfinex Alpha report underscores the diminishing inactive supply of Bitcoin, particularly those assets stagnant for over a year. This reduction implies that long-term holders either reduce their positions or transfer their assets off exchanges.
Such actions are fundamental to understanding Bitcoin’s price dynamics, especially as the halving event approaches.
With an increasing number of BTC leaving centralized exchanges and a decrease in inactive supply, the market is primed for “potential growth,” according to Bitfinex analysts. They add that this mirrors the conditions observed before the significant market surge in December 2020.
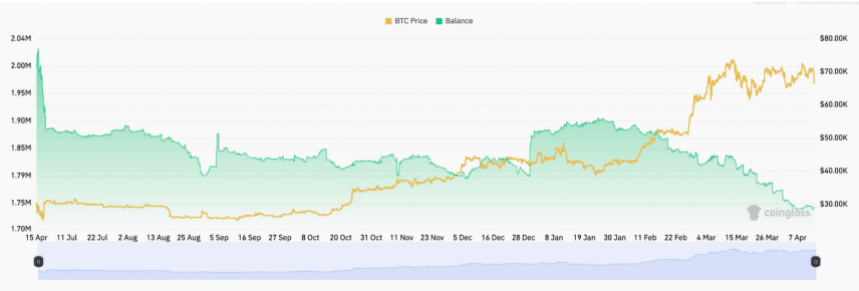
On a broader scale, data from CryptoQuant corroborates Bitfinex’s observations, indicating a continuous decline in Bitcoin exchange reserves since July 2021. This decline, which has seen reserves plummet from 2.8 million to approximately 1.94 million, suggests a sustained trend of Bitcoin leaving exchange wallets.
Bitcoin Latest Price Action
Meanwhile, Bitcoin’s price performance has taken a downturn, notably beginning late last week Friday and continuing throughout the weekend. The top crypto witnessed a significant decline, plummeting from above ,000 to as low as ,000.
Notably, this downward trend has persisted over the past 24 hours, with the asset experiencing a decrease of 4.6% during this period and over 10% in the past week, leading to its current trading price of ,034 at the time of writing.
Amidst these price movements, signs of panic have emerged within the Bitcoin market. Recent data from Whale Alert sheds light on a significant transfer involving 7,690 BTC, valued at 3 million, to Coinbase, the largest cryptocurrency exchange in the United States.

— Whale Alert (@whale_alert) April 16, 2024
While details about the origin of the address, “1Eob1,” remain undisclosed, it’s important to recognize that such transfers to exchanges often signal potential intentions to liquidate holdings. This occurrence typically suggests a readiness to sell off assets within the crypto sphere.
Furthermore, should the entity responsible for this transfer decide to sell off the entirety of the deposited BTC, it could potentially exert a notable influence on the broader Bitcoin market.
Featured image from Unsplash, Chart from TradingView
Bitcoin Signal That Has Held Since December Says It’s Time To Sell
An analyst has explained that an indicator that has been holding for Bitcoin since December is now giving a sell signal for the cryptocurrency.
TD Sequential Is Providing A Sell Signal On Daily Bitcoin Chart Currently
In a new post on X, analyst Ali discussed a TD Sequential sell signal forming in the Bitcoin daily price chart. The “Tom Demark (TD) Sequential” is an indicator in technical analysis used for pinpointing locations of probable tops and bottoms in any asset’s price.
The TD Sequential has two phases. The first is called the “setup” and lasts nine candles. Once nine candles (of the same polarity) are in, the setup completes, and the indicator signals a likely reversal for the price.
The direction of such a reversal naturally depends on the type of candles that formed the setup. If these candles were green, the indicator would imply a top for the asset, while red candles would suggest a bottom.
When the setup finishes, the “countdown” phase begins. In this phase, candles of the same type are counted again, except for thirteen. Once the countdown also completes, another potential reversal could be assumed to have occurred for the price.
Recently, Bitcoin has finished a TD Sequential phase of the former type. Here is the chart shared by the analyst that shows this pattern forming in the daily price of the cryptocurrency:
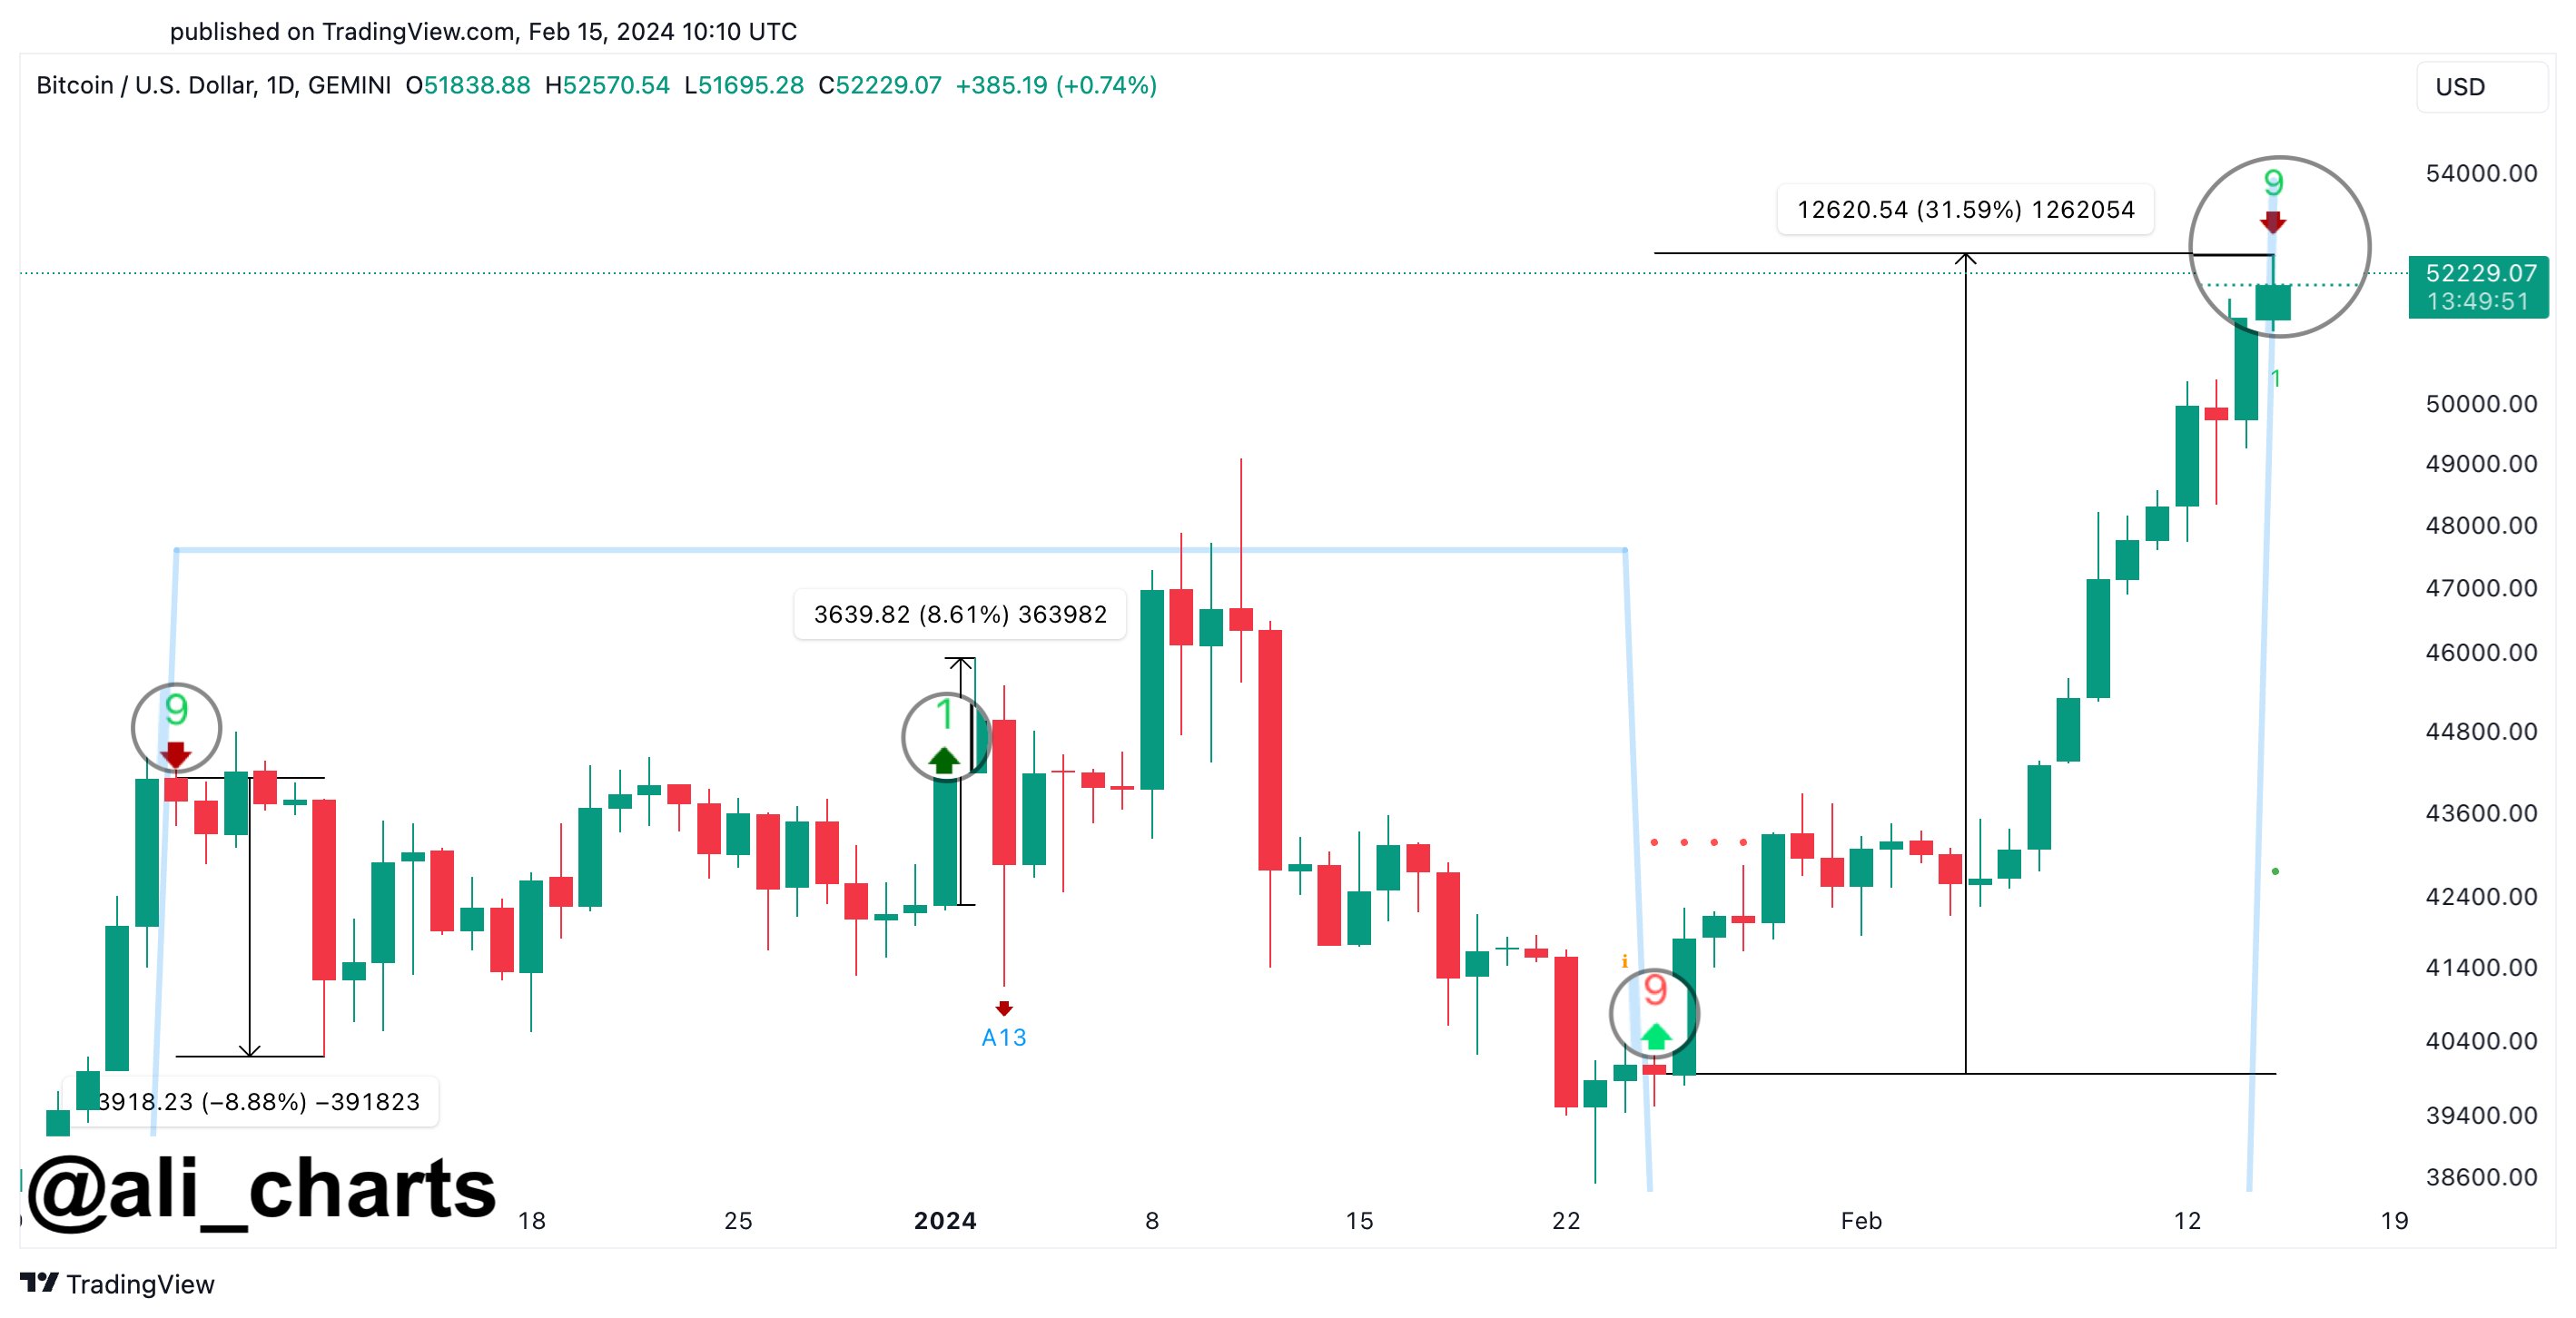
As is visible in the graph, the TD Sequential setup has recently finished with green candles for Bitcoin. These green candles have come for the coin as it has enjoyed some sharp bullish momentum, which has taken its price beyond the ,000 mark.
The fact that the TD Sequential setup has formed with green candles suggests the indicator may now be providing a sell signal for the cryptocurrency’s price.
In the same chart, Ali highlighted the previous instances since December of last year where a setup was completed for the asset. It would appear that both TD Sequential buy and sell signals have held for the coin in this window.
Going by this pattern, the latest TD Sequential reversal signal might also hold for the asset. And as it’s a bearish one this time, the analyst expects a correction lasting for one to four daily candlesticks.
BTC Price
Bitcoin’s recent momentum has meant that the asset has been among the best performers in the sector, registering growth of around 16% during the past week.
Currently, the coin is hovering around the ,500 level. The chart below shows the asset’s trajectory over the last month.
Bitcoin Transaction Fees See Sharp Decline Since December Peak, Network Congestion Persists

On Jan. 10, 2024, the fee for high-priority transactions is set at 42 satoshis per virtual byte (sats/vB), amounting to .66 per transaction. The average transaction fee stands at 98.9 sats/vB, equivalent to .17 per transfer. Although there has been a decline in onchain fees, they currently remain at their highest level since May 2021. Moreover, the network is still experiencing congestion with 262,143 transactions awaiting confirmation.
Bitcoin’s Onchain Fees Plunge Post-December Peak
Since mid-December 2023, when Bitcoin’s onchain fees peaked at to per average transfer, there has been a significant decrease. The average onchain fees have plunged by over 69% from that peak, currently standing at 0.00025 BTC, or .17 per transfer as of Wednesday. According to bitinfocharts.com, a transaction with a median size fee will incur a cost of 0.000096 BTC, or .32.
Data from mempool.space shows that for high-priority transactions, the cost is now 42 sats/vB, translating to .66 per transaction. As of Jan. 10, 2024, the fee for a no-priority transaction is .28 per onchain transaction. The mempool is currently clogged with 262,143 pending transactions, and block intervals are exceeding the usual 10-minute average. Mempool.space reports the average block time as approximately 10 minutes and 54 seconds.
To process all the unconfirmed transactions, it will take 546 blocks or 743.83 megabytes (MB) of block space. The backlog of unconfirmed transactions has seen a reduction over the past week, coinciding with a slowdown in Ordinal inscription mints. The Bitcoin hash price, which estimates the daily value of 1 petahash per second (PH/s) of hashing power, stands at .66. This figure is slightly down from the .05 per PH/s it reached at 7 a.m. Eastern Time the previous day, Tuesday.
Last week, onchain fees stood higher, with 351,371 transactions in the queue awaiting miner approval. The cost for a high-priority transfer was then 129 sats/vB, amounting to .73, marking a 190% increase compared to today’s rates. The congestion that’s plagued Bitcoin for a year now, coupled with the current fee structure, reflects the dynamic nature of Bitcoin’s network and the ongoing challenges in balancing demand, transaction processing speed, and cost.
What do you think about the latest Bitcoin network fees and the protocol’s miners grappling with congestion in the backlog? Share your thoughts and opinions about this subject in the comments section below.
Paypal and First Digital Stablecoins Dominate in December as Binance USD Heads Toward Extinction
The leading stablecoins, in terms of market capitalization, concluded 2023 with a combined value of around 1.69 billion, yet only two of the top ten experienced increases in 30-day supply. Data reveals that tether, the leading U.S. dollar-pegged crypto asset, observed a 2.5% uptick in its supply, while the newcomer, first digital usd, enjoyed a substantial 85.7% rise.
Stablecoin Market Sees Varied Performances Last Month
Although the stablecoin market significantly declined since 2022, it ascended once more towards the close of 2023, reaching heights unseen since last May. Yet, among the top ten stablecoins by market capitalization, only two witnessed an uptick in supply over the last 30 days. From Dec. 1, 2023, to Jan. 1, 2024, tether (USDT), the largest stablecoin by market valuation, experienced a 2.5% boost in supply. Presently, USDT holds a market capitalization of .86 billion.
USDC experienced a slight 0.2% dip, while DAI encountered a 1.7% decline. The greenback-pegged trueusd (TUSD) underwent a 22% contraction in its supply during December. In contrast, the fifth-ranked stablecoin, first digital usd (FDUSD), surged by 85.7%, currently boasting a market valuation of .8 billion. BUSD noted a supply reduction of approximately 39% last month, with its market cap now hovering at just over billion. Additionally, Tron’s USDD also saw a downtick, with 1.3% of its total supply diminishing in the past 30 days.
FRAX and USDP experienced respective declines ranging from 3.2% to 16.7%. Meanwhile, Paypal’s new stablecoin PYUSD notched a significant 68.8% increase, surpassing liquity usd (LUSD) this month. As of Jan. 1, PYUSD’s total supply exceeded 264 million units. In the last 24 hours, the global trade volume has hovered around billion, with stablecoins making up over billion of that activity. This implies that for every ten trades, stablecoins are used in more than six.
In the past month, numerous stablecoin supplies have seen a contraction, yet others have marked considerable growth, forging new paths in the crypto economy. PYUSD, introduced by a behemoth in the payments sector Paypal, stands in contrast to the emerging yet rapidly growing FDUSD, which has swelled impressively in size throughout the end of 2023. Additionally, even after shedding a notable portion of its supply over the preceding year, BUSD continues to maintain strong daily trading volumes.
What do you think about the stablecoin market action in December? Share your thoughts and opinions about this subject in the comments section below.
December 2023 Sees Record Bitcoin Mining Revenue: $1.51 Billion Amassed With Soaring Onchain Fees
In December, bitcoin miners garnered the highest monthly revenue of the year, amassing .51 billion. Additionally, this month marked a record in fee collection, with miners securing 4.83 million in onchain transaction fees.
Bitcoin Miners Smash Records — Highest Monthly Haul of .51 Billion in December 2023
December 2023 has set a new benchmark for monthly revenue garnered by bitcoin (BTC) miners through block discovery and transaction verification. By Dec. 31, 2023, a total of .51 billion was amassed, including 4.83 million in onchain fees. This surpasses the former monthly revenue record set in May, where miners collected a total of 9.22 million, with 5.92 million from onchain fees.

In July, miners collected a total of 5 million, with .21 million from fees. December, however, marked a significant increase, standing 1.64 times greater than May’s record, representing a growth of 64.27% or an additional 0.78 million. At the moment, according to bitinfocharts.com, December’s onchain transaction rates are soaring, with the average fee at 231 satoshis per virtual byte (sats/vB) or .86 per transaction.
On Dec. 31, 2023, the median-sized fee is noted at .60 per transaction or 106.3 sats/vB. Moreover, on Dec. 17, 2023, fees spiked to as much as per transfer, averaging around .43 per transaction — the year’s peak in on-chain fees, surpassing the previous high of on May 8, 2023.
Also, on Dec. 17, the hash price of Bitcoin — the value of a single petahash per second (PH/s) produced daily — hit a 2023 zenith of 3.62 per PH/s, exceeding the earlier record of 5.64 per PH/s on May 8. Despite the high onchain fees, miners face a backlog of over 496,000 unconfirmed transactions and congestion of 430 blocks.
What do you think about the record-breaking haul bitcoin miners gathered in December 2023? Share your thoughts and opinions about this subject in the comments section below.
Bitcoin Reigns Supreme in NFT Market With Record-Breaking $853 Million in December Sales
In November, Bitcoin clinched the leading position in monthly non-fungible token (NFT) sales, and interestingly, this month Bitcoin continued to retain its top status, amassing a total of 3 million in sales.
NFT Sales Surge: Bitcoin Holds Top Spot With Unprecedented December Rise
Although NFT sales have declined in the past week, falling over 35% from the previous week, December witnessed a record-breaking .7 billion in NFT transactions. This marked an increase of more than 69% compared to November’s figures, with Bitcoin continuing to dominate NFT sales across blockchains. Moreover, BTC-based NFT sales soared 127.63% above the chain’s November totals, according to cryptoslam.io statistics.

In December, Bitcoin’s NFT sales reached 3 million, while Ethereum’s NFT sales totaled 4.79 million. BTC-focused NFT sales outpaced ETH’s, being 2.34 times greater in December. Solana secured the third spot with about 5.14 million in NFT sales, experiencing a 312% increase from November’s Solana-centric NFT figures. Following the top three, Polygon and Arbitrum were the subsequent leading blockchains in NFT sales.
The highest-valued NFT transaction of December featured a digital copy of Vincent Van Gogh’s Self-portrait, 1888 (Van Gogh’s painting #216), which commanded a price of .19 million. Ethereum hosted the sale of Frxethredemption Ticket #33, bringing in 8,433 this month. Additionally, Cardano’s Deep Vision #05128 fetched 1,750, while BNB’s Lockdealnft #91 garnered 9,824. Completing the list of December’s five most costly NFTs was Solana’s Boogle #009, selling for 4,209.
Out of the top ten NFT collections in terms of sales, seven of them derive from the Bitcoin blockchain. Solana’s Tensorians took the fifth position in terms of sales and the chain’s Mad Lads collection held the eighth spot. Arbitrum’s Sentry Node collection took the ninth position this past month. In December there were 11,290,812 NFT transactions between 469,389 sellers and 600,744 NFT buyers.
As Bitcoin secures the top spot in NFT sales for November and December, amassing impressive figures, the crypto community watches with bated breath. Will this be a sustaining trend or a fleeting moment of dominance in the NFT world? Only time will tell if Bitcoin can maintain its lead or if the tides will turn, reshaping the landscape of NFT sales in the blockchain world.
What do you think about the NFT sales in December? Share your thoughts and opinions about this subject in the comments section below.
2023 Marks Bitcoin’s Spirited December Surge: A Glimpse Into Crypto’s Festive Frenzy
On Nov. 26, Bitcoin.com News highlighted the crypto community’s anticipation and hope for a ‘Bitcoin Santa Claus rally’ to manifest this year. Following the data collected from Dec. 1 to Dec. 24, 2023, the recent increase of 15.93% against the U.S. dollar has been recorded as the seventh most significant December surge since 2010.
2023 Witnesses a 15.93% Bitcoin Surge, Ranking Seventh in December Gains
Indeed, Santa granted bitcoin enthusiasts a 15.93% boost this December, yet it’s unlikely to be remembered as an official ‘Bitcoin Santa Claus rally‘ akin to the ones seen in 2017 and 2011. From Dec. 1, 2023, to the eve of Christmas, BTC soared from ,721 per unit to an impressive peak of ,730. Nonetheless, it secured the seventh spot in the record books, marginally outpacing the 5.6% increase seen from Dec. 1 to Dec. 24 in 2012.

The year 2017 marked BTC’s most significant December rally, escalating from ,947 to ,815 between Dec. 1 and Dec. 24, reflecting a 48.94% surge. In a similar period in 2011, BTC experienced a 34.02% rise, climbing from .91 to .90 per coin. Meanwhile, 2016 recorded what seems to be the last ‘Santa Claus rally’, with a noteworthy 21.46% uptick against the dollar, elevating the price from 3 on Dec. 1 to 2 by Christmas Eve.
In 2010, bitcoin experienced a 19.05% rise within the same December period, while 2020 saw an 18.86% increase. The year 2015 witnessed BTC climbing by 17.29%. Aside from 2023’s and 2012’s gains, the years 2022, 2018, 2019, 2021, 2014, and 2013 all endured bearish Decembers. Specifically, in 2022, BTC’s value fell by 2.16% from Dec. 1 to Christmas Eve, and in 2018, it declined by 2.39% during the same December timeframe.
Subsequently, in the following December, bitcoin’s price saw a 2.77% decrease between those dates. In 2021, the price experienced a double-digit downturn, plummeting by 10.70%, and in 2014, BTC’s worth diminished by 11.72%. The period from Dec. 1 to Dec. 24, 2013, was notably the most drastic, with BTC prices plunging 41.18%. On Dec. 1, 2013, BTC traded at ,103 per coin, but by the 24th, it had fallen sharply to 9 per unit.
As the crypto community reflects on the fluctuations and festive rallies of bitcoin’s December history, it’s clear that the journey has been as volatile as it has been exhilarating. The 2023 surge, though not record-breaking, adds another chapter to this ongoing saga, illustrating the unrelenting enthusiasm and spirit that defines the crypto market.
What do you think about this December’s market performance compared to other years? Share your thoughts and opinions about this subject in the comments section below.
XRP In December 2023: Decoding An 800% Nostalgia And The Hope For $1
XRP has been under a cold spell in December for years, with red charts and cold winds every year. Some buyers are still scared about the market because they remember the 66% drop in 2021. The sounds of 2018, a year with an amazing 800% rise, sound like a faraway Christmas carol.
They remind the XRP community of a time when XRP believed in the magic of year-end wonders. Even though December charts used to be full of holiday cheer, XRP was stuck by the shadow of past trends, hoping that its luck would improve by the end of the year.
Will This Month Be Different For XRP?
While it’s cold outside in December 2023, there are hints of hope for change in the air. The big question is whether this month will be different, and whether XRP can finally break free from the Scrooge-like grip that has been limiting its year-end results.
CryptoRank’s data, which is often like a Grinch to XRP’s holiday mood, still shows a sad picture of past December coming back. There is a cemetery of red bars across the chart (below).
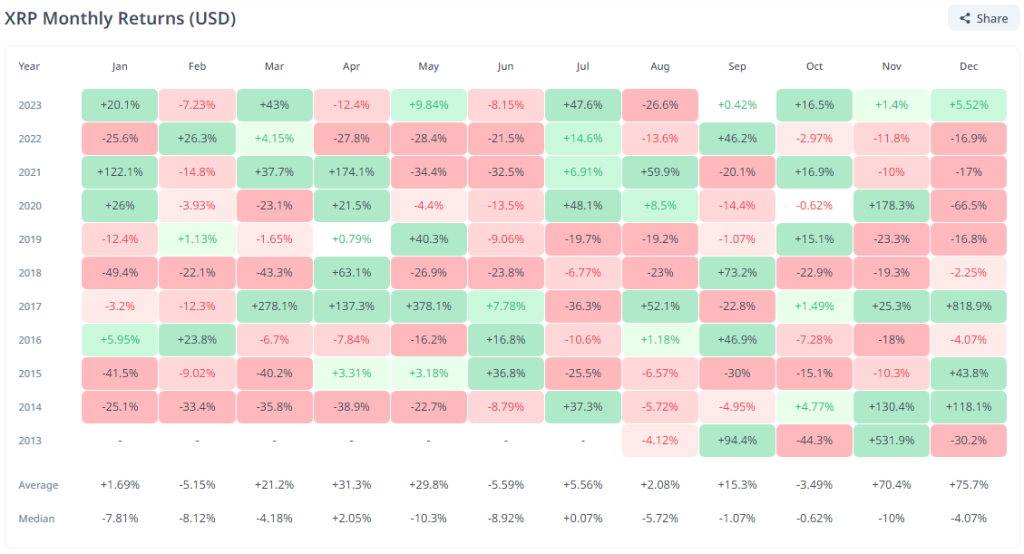
Each one shows a year of loses at the end of the year. In the middle of this cold landscape, though, sits a defiant evergreen: 2017. Its shimmering 818% gains serve as a reminder of XRP’s hidden potential.
The averages for XRP in December on the crypto market show two parts of the story. A 75% average return shines like a holiday ornament, a memory of times when the market was rising around this time of the year.
A (minus) 4% median, on the other hand, forms a shadow, a lump of coal that shows how volatile XRP’s December performances have often been. Still, this December feels different. There’s a soft hint of change in the air, like a mistletoe of promise.
When you look at XRP’s past of chilly Decembers, even a small 2% rise that might not seem important in other situations feels like a big deal. Even though the wins in December might not last, the bigger picture shines with newfound warmth.
With a respectable 20.4% quarterly gain, the fourth quarter of 2023 has been very good. It was the second-best quarter of the year and the first positive Q4 since 2017.
But the rumors about December are more than just changes in prices. Technical indicators are pointing to a possible bull run, which would be very different from the normal drop at the end of the year. There will be some hard times ahead for XRP.
Hope Lingers For XRP
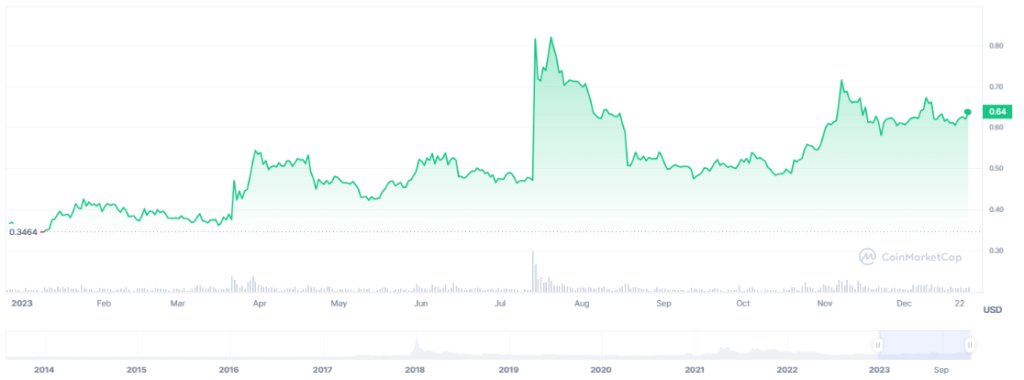
Three important barrier levels—.63, .66, and .70—will stand in the way of its possible upward trend. For XRP to break free from its past limits, it needs to take over these points that were once battlegrounds between bulls and bears.
Even though the road is steep, it’s not impossible. It’s still not clear what will cause such a change, but the technical signs and resistance seen this month are a sign of hope. If XRP can break through these levels of resistance, it could be on track for a big rise, possibly hitting the all-time high of before the current year ends.
This is more than just a story of numbers and charts; it’s a story of strength, going against the grain, and a glimmer of hope in the cold grip of December. In this story, XRP, which was dormant at one point, wakes up full of promise.
The rumors from December make one thing clear: the winter blues might be melting away and a better future could be on the horizon. Only time will tell if 2024 is the spring of a new XRP.
Featured image from Freepik
Bitcoin Mining Difficulty Hits Record 72 Trillion Amid Hashrate Surge and $600M Spent on ASICs in December
On Dec. 23, 2023, Bitcoin’s mining difficulty soared to a record level at block height 822,528. The difficulty surged by 6.98%, marking the most substantial escalation in nine months, since March 23. This increment set a new precedent, making the discovery of block rewards more arduous than ever with a difficulty hitting an unprecedented 72.01 trillion.
Bitcoin’s Mining Difficulty Soars to Historic 72 Trillion
The ascent in mining difficulty signifies a considerable leap, climbing from 67.30 trillion to a strenuous 72.01 trillion. This metric of Bitcoin’s mining difficulty is defined by a specific target hash value that miners aspire to attain.
Essentially, with a difficulty level of 72 trillion, miners are tasked with generating a hash value beneath this threshold to successfully mine a new block. Post this 6.98% rise, it’s anticipated that the next difficulty adjustment will be around Jan. 5, 2024.
Coinciding with the spike in difficulty, the network’s hashrate has reached new zeniths, achieving an all-time high on Dec. 24, 2023. Data from Luxor’s hashrateindex.com reveals that the seven-day simple moving average (SMA) of BTC’s hashrate has hit 538 exahash per second (EH/s).
This record-breaking figure was achieved shortly after the network reported a historic 527 EH/s peak on December 20. As of December 24, around 50 mining pools are contributing SHA256 hashrate to the BTC network, with Foundry USA at the forefront, commanding 32.30% or 173.55 EH/s of the total hashrate.
Antpool is not far behind, contributing 26.95% or 144.81 EH/s. Collectively, these two pools dominate, holding 59.25% of Bitcoin’s aggregate hashrate over the preceding three days. Currently, just a hair over 17,000 blocks remain until the anticipated halving event, projected to occur around the end of March or the beginning of April 2024.
This surge in hashrate aligns with the significant expansion in bitcoin mining operations. Throughout 2023, the leading three application-specific integrated circuit (ASIC) manufacturers unveiled their latest next-generation mining rigs. Mining entities have aggressively incorporated these new machines into their operations, substantially boosting efficiency, particularly in joules per terahash.
The Financial Times reports a notable investment surge with publicly listed mining companies expending 0 million on new machinery in December, and a total of .3 billion on ASIC acquisitions over the year, according to The Miner Mag.
What do you think about the network’s difficulty skyrocketing to a new peak? Share your thoughts and opinions about this subject in the comments section below.