 The Bitcoin Office of El Salvador (ONBTC) has launched a site that allows anyone to confirm the treasury holdings of the country, offering a large degree of transparency in its finances. The site, composed as a custom instance of mempool space, a popular block explorer, confirms that the country has been purchasing one bitcoin per […]
Bitcoin News
Sui Surpasses Solana in Daily Transactions Amidst Spam Token Frenzy
 Sui, a scalability-focused blockchain, has surpassed Solana, a top 10 cryptocurrency network, in activity levels, registering 41 million transactions on April 3. The activity overheating on Sui is caused by ‘spam’, a Sui native token designed to stress test the network’s capabilities, assigning tokens to users equivalent to the number of transactions issued. Sui Surpasses […]
Bitcoin News
Record-Breaking Q1 For Polkadot: Daily Active Addresses Hit 514,000 As DOT Price Surges 7%
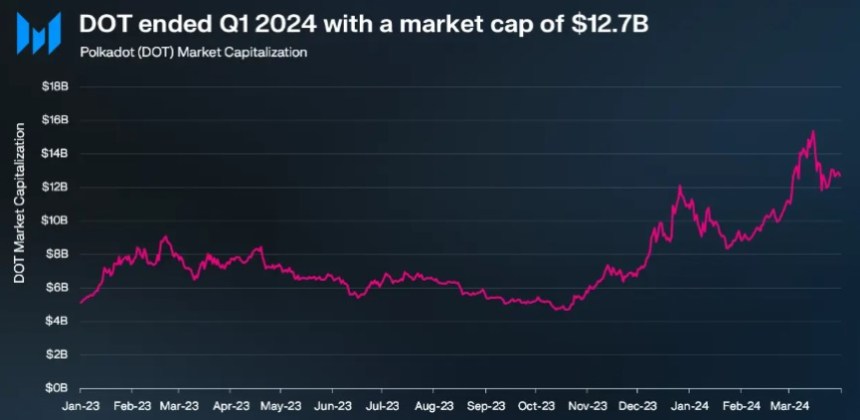
According to a Messari report, the Polkadot (DOT) blockchain protocol made significant progress in the first quarter (Q1) of the year in terms of market capitalization, revenue, and Cross-Consensus Message Format (XCM) activity, as well as a record increase in daily active addresses.
DOT’s Market Cap Surges 16% QoQ
During Q4 2023, Polkadot’s market capitalization experienced a notable 111% quarter-on-quarter (QoQ) increase, reaching .4 billion. Building on this momentum, Q1 2024 witnessed a further 16% QoQ rise, elevating the circulating market cap to .7 billion.
Despite these gains, DOT’s market capitalization remains 80% below its all-time high of .5 billion, set on November 8, 2021.
In Q4 2023, Polkadot’s revenue also skyrocketed by 2,880% QoQ, amounting to .8 million. Per the report, this surge was primarily attributed to an exponential increase in extrinsics, driven by the Polkadot Inscriptions.
However, revenue metrics for Q1 2024 declined significantly on a QoQ basis, with revenue in USD dropping by 91% to 1,000 and revenue in DOT decreasing by 92% to 28,800. It is worth noting that Polkadot’s revenue tends to be relatively lower compared to its competitors due to the network’s structural design.
Polkadot’s XCM activity continued to show growth in Q1 2024. Daily XCM transfers surged by 89% QoQ to reach 2,700, while non-asset transfer use cases, known as “XCM other,” witnessed a 214% QoQ increase, averaging 185 daily transfers.
The total number of daily XCM messages grew 94% QoQ to 2,800, demonstrating the network’s dynamic ecosystem. In addition, the number of active XCM channels grew 13% QoQ to a total of 230.
Polkadot’s Parachain Network Soars To New Heights
Q1 2024 marked a significant kick-off to the year for Polkadot’s parachains, with active addresses reaching an all-time high of 514,000, representing a substantial 48% QoQ growth.
Moonbeam emerged as the leading parachain with 217,000 monthly active addresses, a solid 110% QoQ increase. Nodle followed closely with 54,000 monthly active addresses, doubling from the previous quarter.
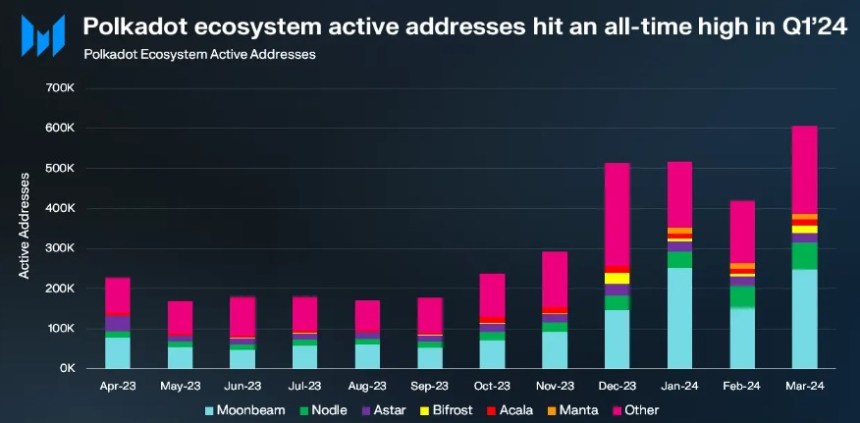
Astar on the other hand, experienced a modest 8% QoQ growth to reach 26,000 active addresses, while Bifrost Finance grew slightly by 2% QoQ to 10,000 addresses. However, Acala experienced a decline, with monthly active addresses falling to 13,000, down 16% QoQ.
Notably, the Manta Network stood out among parachains in Q1 2024, with a significant surge in daily active addresses, reaching 15,000. According to Messari, this increase was fueled by the successful launch of the MANTA token TGE and subsequent listing on Binance, propelling Manta’s Total Value Locked (TVL) to over 0 million.
Polkadot Price Sees Upside Potential Ahead
In terms of price action, Polkadot’s native token DOT has regained bullish momentum following a sharp drop to the .8 price mark after reaching a yearly high of on March 14.
Currently, DOT has regained the .25 level, up 7% over the past week. However, DOT’s trading volume decreased slightly by 4.7% compared to the previous trading session, amounting to 0 million over the past 24 hours, according to CoinGecko data.
If the bullish momentum persists, Polkadot faces its first resistance at the .4 zone, which serves as the last threshold before a potential retest of the resistance wall.
On the other hand, the .4 support floor has proven to be successful after being tested for two consecutive days this week, highlighting its significance as a key level to watch for the token’s upward movement prospects.
Featured image from Shuttestock, chart from TradingView.com
Cardano’s Mysterious Surge: What’s Behind The $13 Billion Daily Transaction Boom?
Cardano (ADA), the smart contracts platform known for its energy-efficient Proof-of-Stake consensus mechanism, has been generating buzz lately. On-chain data reveals a significant uptick in large transactions, hinting at a potential return of the whales – major investors who can significantly impact cryptocurrency prices.
Whales Making Waves On The Cardano Sea
IntoTheBlock, a blockchain analytics firm, reported a surge in Cardano transactions exceeding 0,000. Over the past week, the average daily volume for these large transactions reached nearly billion.
Cardano whales are busy, with an average large transaction volume of .84B a day in the last 7 days.
For comparison, this is a third of Bitcoin’s current volume, 5x as much as Litecoin’s volume and over 16x that of Dogecoin! pic.twitter.com/xU2XMoEQbM
— IntoTheBlock (@intotheblock) April 29, 2024
This represents a third of Bitcoin’s transaction volume within the same timeframe, showcasing a surge in activity on the Cardano network. Interestingly, the data dwarfs Dogecoin’s large transaction volume by a whopping 16 times, highlighting the increased interest in Cardano compared to the meme coin.
Unveiling The Mystery: Are Whales Buying Or Selling?
While the high transaction volume is undeniable, its implication for Cardano’s price remains unclear. Large transactions can represent both buying and selling activity, making it difficult to predict a definitive price direction.
However, the sustained volume exceeding billion throughout the week, even during a recent price dip, suggests continued movement within the network. This could indicate institutional investors entering the Cardano market or signify significant internal token transfers within the ecosystem.
Data Hints At Bullish Undercurrents
While the exact nature of the large transactions remains to be seen, Santiment, another on-chain analytics platform, provides a potentially bullish signal. Their data suggests a growing accumulation trend among large holders.
Addresses containing between 100,000 and 100 million ADA have been steadily increasing their holdings since the beginning of April. This accumulation by whales could be a positive sign for Cardano’s future price, indicating their confidence in the project’s long-term potential.
Technical Analysis Paints A Target-Rich Environment
Market analyst Cobra Vanguard has weighed in on the recent developments, employing technical analysis to predict Cardano’s price trajectory. Vanguard identifies an expanding price channel that Cardano has been trading within since the start of the year.
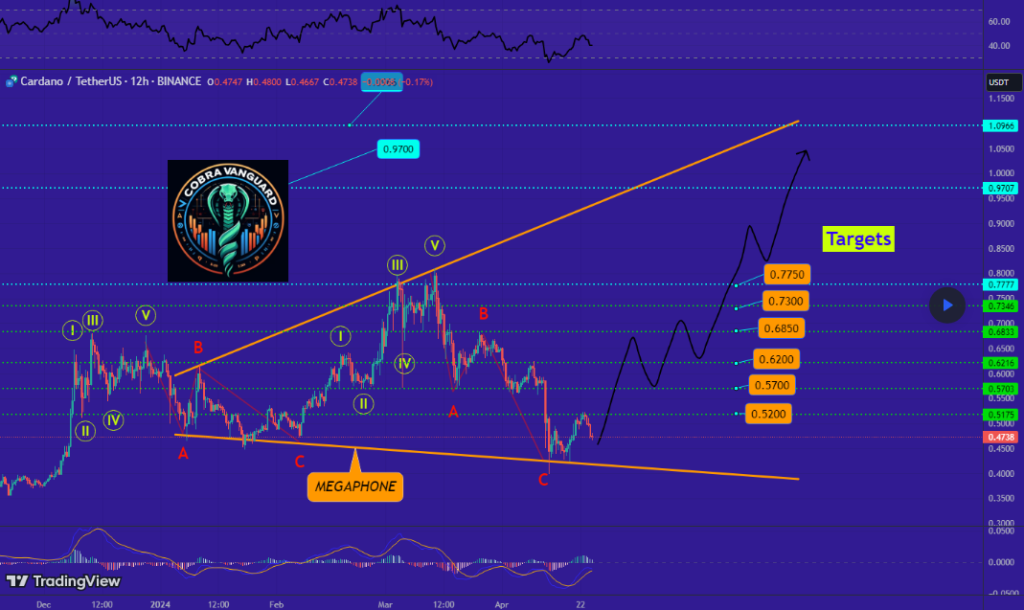
This pattern suggests higher highs and lower lows, potentially indicating continued price volatility. Based on this analysis, Vanguard outlines several price targets for ADA, with the first hurdle at .52.
If successfully breached, the analyst predicts further climbs towards .57, .61, and .67. The ultimate target sits at a bullish .77, potentially marking a significant price increase for Cardano.
Cardano: A Sea Of Opportunity Or A Whale’s Playground?
The recent surge in large transactions on the Cardano network has undoubtedly generated excitement within the cryptocurrency community.
While the exact reasons behind the high volume remain unclear, the potential involvement of whales and the uptick in accumulation by large holders paint a cautiously optimistic picture.
Featured image from Invyce, chart from TradingView
Bitcoin Daily Transactions Just Hit A New ATH – What’s Driving It?
The Bitcoin network has witnessed a surge in trading activity in the days after the halving, as shown by on-chain data. Although the just concluded halving brought a lot of attention to Bitcoin, the recent surge in trading activity can be attributed to something else.
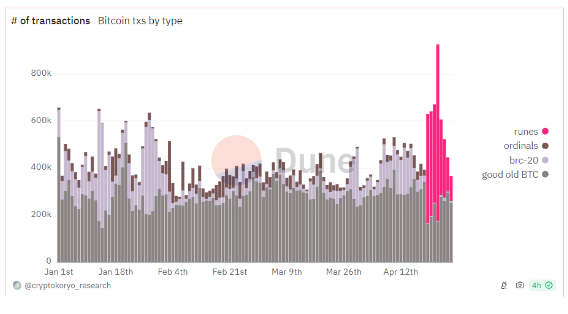
According to data from on-chain analytics platform IntoTheBlock, the number of daily BTC transactions has grown rapidly in the past few days to reach a new high of 927,000 thanks to a new token standard called Runes.
Bitcoin Daily Transactions Reach New All-Time High
Bitcoin’s price has been skyrocketing since the beginning of the year with interest in the top cryptocurrency exploding. All that new interest means more people buying, selling, and trading BTC, which has led to a huge increase in the number of daily transactions.
Despite the increase in activity, the number of daily transactions failed to break above the 724,000 record for the past four months, until recently this week.
The main catalyst for this activity surge is the recent launch of the Runes token standard on the Bitcoin blockchain. The Runes Protocol is a new token standard on BTC that gives users a more efficient way of creating fungible tokens.
The additional functionality provided by Runes opens up new possibilities for Bitcoin, allowing users to create non-fungible tokens more efficiently than the existing BRC-20 token system.
The Runes token standard surged immediately among developers and users after launch, constituting over 68% of Bitcoin transactions recorded. According to Dune’s analytics dashboard, the number of Runes transactions surged to 753,000 on Tuesday, April 23. As a result, the total number of transactions on the day crossed over 927,000 to break the 724,000 record set in December 2023.
Bitcoin hit a new all-time high in daily transactions!
Following the launch of Runes, The number of Bitcoin transactions has increased rapidly, hitting 927,000 on Tuesday. This breaks the previous high of 724k set in December of 2023 pic.twitter.com/30JXbrLmdR
— IntoTheBlock (@intotheblock) April 26, 2024
On the other hand, the hype surrounding the Runes token standard seems to have faded so quickly. The number of transactions on Runes has now fallen to 104,800 in the past 24 hours, constituting 26% of the total number of transactions.
Bitcoin Price Prediction
At the time of writing, Bitcoin is trading at ,711 with a price resistance now around ,500. Bitcoin’s price trajectory can be very tough to predict. Many Bitcoin analysts and traders are still looking forward to a bullish effect of the just concluded halving on the price of the cryptocurrency. A Bitcoin bull flag has just been formed which suggests the possibility of an uptrend very soon.
However, crypto expert Peter Brandt believes Bitcoin might have already reached its top in the current market cycle. His theory is based on the exponential decay thesis which shows that the percentage gain of Bitcoin price has reduced in succeeding market cycles.
Featured image from Pexels, chart from TradingView
Shiba Inu Burn Rate Sees 81% Daily Increase, But Why Is Participation Low?
The Shiba Inu burn rate has seen another daily increase, which is a welcome development for the community. However, the figures being burned paint another picture, especially when it comes to participation from Shiba Inu holders in the SHIB burning initiative.
Shiba Inu Burn Rate Rises 81%
The Shiba Inu daily burn rate saw a significant uptick, rising an impressive 81% in a single day. While this surge is a positive for the meme coin, the number of tokens burned to cause this surge are far from impressive.
According to data from the Shiba Inu burn tracking website Shibburn, a total of 4.64 million SHIB tokens were burned in the last day. To put this in perspective, the total value of the tokens burned for the day is around 5.
Additionally, given that this constitutes an 81% increase, it means an even smaller amount of tokens were burned the prior day. Shibburn’s records show that the previous day saw a total of 1.9 million tokens burned, which is around worth of coins.
This drastic decline in the number of coins being burned on a daily basis suggests muted participation from investors. This could be directly tied to Shiba Inu’s price struggle over the last few weeks, which has seen investors take a more conservative stance to protect their positions.
SHIB Price Crashes 21%
The Shiba Inu burn rate is not the only thing that has been seeing a decline in the last week, its price has also taken a hit. According to data from the token tracking platform Coinmarketcap, the Shiba Inu price is down 15% in the last week alone.
As a result of this 15% decline, the SHIB price has now dropped to .000023, which also represents a 50% drop from its March peak of .000044. However, its daily trading volume has seen a bullish reversal, rising 12% in the last day to 5 million. A rise in volume can often signal a return in interest to a cryptocurrency. If this is the case, then the Shiba Inu price may be headed for a reversal as investors start to place their bets once more.
At the time of writing, the SHIB price is still trending at .0000228, showing small daily gains of 4%. However, despite the negative headwinds the meme coin has experienced, it continues to maintain a market cap above .5 billion, which makes it the 11th-largest cryptocurrency in the market, ahead of the likes of Avalanche and Polkadot.
Ethereum Sees Notable Rise In Daily Activity, But Why Is Price Down?
Ethereum’s network has seen notable growth recently in both daily active users and daily transaction volume, yet the price of ETH, Ethereum’s native cryptocurrency, has undergone corrections in the past few days. Notably, Ethereum is down by over 10% in the past seven days, underperforming Bitcoin and the S&P 500.
While this decline can be felt through the majority of large cryptocurrencies in the industry, the number of daily active Ethereum addresses has been steadily rising over the past month.
Ethereum’s Network Activity Surges But Price Remains Stagnant
An increase in network activity is usually a bullish sign for the price of cryptocurrencies as more activity means more demand. Interestingly, the number of daily active Ethereum addresses has increased by over 46% since January 3.
This increase in active addresses largely came with a surge in price over the past few months. Ethereum shot up from ,909 on February 24 to reach a two-year high of over ,000 on March 12, representing a surge of over 39%. According to data from YCharts, the number of daily active addresses increased simultaneously from 432,647 to 515,145 during the same time frame.
However, Ethereum has been on a price decline since its brief cross over ,000 and is currently down by 17% in the past 10 days. On the other hand, the network has witnessed a continued surge in activity in terms of on-chain data, with the number of daily active addresses now at 618407 in the past 24 hours, its highest point since October 2023.
According to data from IntoTheBlock, ETH’s daily average volume has been steadily growing in a similar manner to the one recorded in 2020’s early bull market. This growth has now pushed the amount of ETH transferred on Ethereum to its highest level since May 2022 this week.
Can Ethereum Resume Its Uptrend?
At the time of writing, Ethereum is trading at ,355. The price of any cryptocurrency, including ETH, depends heavily on market sentiment and speculation. While growing adoption and network activity are positive signs for long-term price growth, speculation is what really drives the price, at least in the short term.
At the same time, its price remains under pressure from several areas. One of such pressures is a recent report that the SEC is poking around Ethereum and the Ethereum Foundation and is looking to classify ETH as a security.
As the second-largest cryptocurrency, ETH’s classification as a security could cause chaos that would eventually cascade into other crypto assets.
Ethereum seems to have now formed a minor support at the ,280 price level. Failure to hold above this price point could mean a further move to the downside.
Featured image from Pexels, chart from TradingView
Stablecoins Steal The Spotlight: $150 Billion Market Cap, $122 Billion Daily Trades
Stablecoins have recently achieved a significant milestone, surpassing 0 billion in market capitalization, with daily trading volume reaching 2 billion. This achievement marks a notable resurgence and growth in the stablecoin sector, with implications for the broader cryptocurrency ecosystem.
Market Dynamics And Growth Factors
Stablecoins are digital assets designed to maintain a stable value by pegging their price to a reserve asset, such as the US dollar or other fiat currencies. They serve as a crucial bridge between traditional finance and the crypto space, offering stability and liquidity for users and investors.
The recent surge in the stablecoin market can be attributed to several key factors. Firstly, the growing demand for stable assets in the volatile crypto market has driven increased adoption of stablecoins as a safe haven for traders and investors. Additionally, the rise of decentralized finance (DeFi) platforms has fueled the demand for stablecoins as a means of conducting transactions, providing liquidity, and earning yields.
Tether’s Dominance And Market Impact
Tether (USDT), one of the most widely used stablecoins, has played a significant role in driving the growth of the stablecoin market. With a market capitalization exceeding 0 billion, Tether’s dominance underscores its position as a key player in the crypto space.
Undoubtedly dominant in this sector, Tether commands a 70% market share. With a market capitalization of over billion, USD Coin (USDC), the second largest stablecoin, grants Circle’s stablecoin a market share exceeding 20%. At the time of writing, DAI held a 3% market share and .7 billion, placing it in third position.
Tether’s market impact extends beyond its role as a stable asset, as it has faced scrutiny and regulatory challenges due to concerns about its reserve backing and transparency. Despite these challenges, Tether’s resilience and continued dominance highlight the strong demand for stablecoins and their utility in the digital economy.
Crypto Enthusiasts Celebrate Stablecoins’ Rising Market Cap
The crypto community is cheering the rising market cap of stablecoins, seeing it as a sign of coming prosperity.
Total Stablecoin Mcap:
Mar 21st. 7b.
Feb 21st. 8b.
Jan 21st. 3b.
Dec 21st. 0b.
Nov 21st. 7b.
Oct 21st. 4b.it is impossible and stupid to not be bullish on DeFi whilst this chart is just up and to the right for the last 6 months. pic.twitter.com/qkcERkIXi8
— ZeroToTom (@zerototom) March 21, 2024
A growing market cap suggests more money is flowing into crypto, providing much-needed liquidity for trading and potentially pushing prices up. Additionally, stablecoins offer a safe haven during market dips, potentially encouraging more investors to enter the broader crypto market. This increased comfort and investment could fuel the entire market’s growth.
Implications For The Crypto Ecosystem
The surpassing of 0 billion in stablecoin market capitalization signifies a maturing and expanding crypto ecosystem. Stablecoins have become essential infrastructure in the digital economy, enabling seamless transactions, cross-border payments, and financial services innovation.
Featured image from Xverse, chart from TradingView
Arbitrum Outpaces Ethereum in Daily Transactions Amidst L2 Networks’ Surge
 Recent statistics reveal that the layer two (L2) network Arbitrum has experienced a significant increase in daily transactions. On Tuesday, the network’s daily transactions even exceeded those on the Ethereum platform. Additionally, following Ethereum’s Dencun upgrade, other L2 networks such as Optimism have also witnessed an uptick in activity. Arbitrum Transfers Spike Metrics indicate that […]
Bitcoin News
GBTC Experiences Its Largest Daily Drain Yet, Nearly 239,000 BTC Gone in Under 70 Days
 According to the latest statistics, Grayscale’s Bitcoin Trust (GBTC) experienced its most significant outflow on March 18, 2024, totaling 3 million. Onchain experts have closely observed GBTC’s activities as a considerable number of bitcoin have been moved out of the trust’s reserves. Record-Breaking Outflow Hits Grayscale Bitcoin Trust Grayscale has continued to face outflows, marking […]
Bitcoin News