 Asian currencies have reached their lowest levels in over 19 months as the U.S. dollar strengthens, driven by expectations of prolonged elevated U.S. interest rates. The Bloomberg Asia Dollar Index fell by 0.1% on Thursday, marking its lowest point since November 2022. Significant declines in the Philippine peso, Indian rupee, and South Korean won are […]
Bitcoin News
XRP Price Dips Again: What’s Causing The Continued Slide?
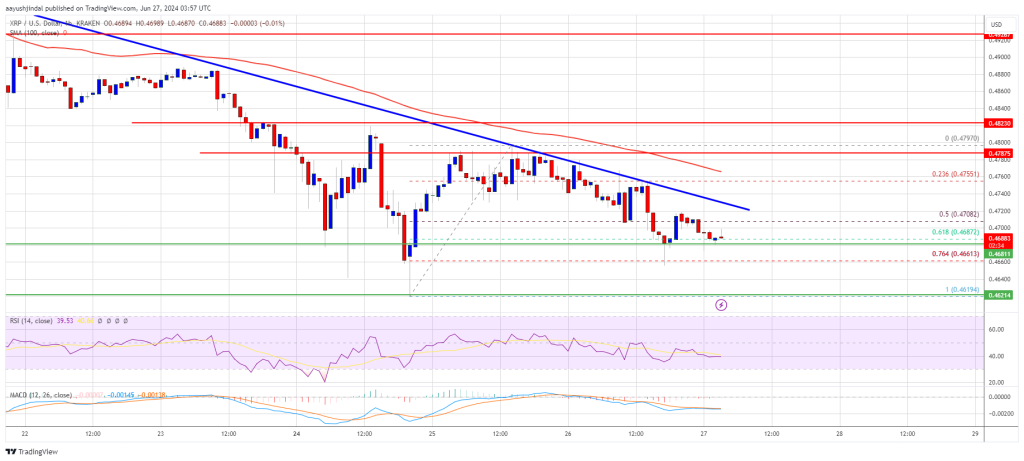
XRP price struggled to recover above the .480 resistance zone. The price is again moving lower and might drop below the .4680 support.
- XRP price failed to extend gains above the .4800 resistance zone.
- The price is now trading below .4750 and the 100-hourly Simple Moving Average.
- There is a major bearish trend line forming with resistance at .4720 on the hourly chart of the XRP/USD pair (data source from Kraken).
- The pair might again face rejections near .4720 and .480.
XRP Price Retreats
XRP price attempted a recovery wave above the .4720 level like Bitcoin and Ethereum. However, the bears were active near the .480 resistance zone. A high was formed at .4797 and the price started a fresh decline.
There was a move below the .4750 and .4720 levels. The price declined below the 50% Fib retracement level of the upward move from the .4619 swing low to the .4797 high. There is also a major bearish trend line forming with resistance at .4720 on the hourly chart of the XRP/USD pair.
The price is now trading below .4750 and the 100-hourly Simple Moving Average. However, it is finding bids near the 61.8% Fib retracement level of the upward move from the .4619 swing low to the .4797 high.
On the upside, the price is facing resistance near the .4720 level. The first major resistance is near the .4750 level. The main hurdle is still near .480.
A clear move above the .480 resistance might send the price toward the .4850 resistance. The next major resistance is near the .500 level. A close above the .500 resistance zone could send the price higher. The next key resistance is near .5120. Any more gains might send the price toward the .5250 resistance.
More Losses?
If XRP fails to clear the .4720 resistance zone, it could continue to move down. Initial support on the downside is near the .4680 level.
The next major support is at .4620. If there is a downside break and a close below the .4620 level, the price might continue to decline. In the stated case, the price could even trade below the .4320 support in the near term.
Technical Indicators
Hourly MACD – The MACD for XRP/USD is now gaining pace in the bearish zone.
Hourly RSI (Relative Strength Index) – The RSI for XRP/USD is now below the 50 level.
Major Support Levels – .4680 and .4620.
Major Resistance Levels – .4720 and .4800.
Ethereum Technical Analysis: ETH Faces Bearish Sentiment Amidst Continued Downtrend
 Ethereum’s price stands at ,311, with a market capitalization of 4 billion. The 24-hour intraday trading range has fluctuated between ,277 and ,500, while the 24-hour trade volume has reached .82 billion. A technical analysis across various timeframes highlights significant bearish indicators. The confluence of oscillators and moving averages suggest a continuation of the downward […]
Bitcoin News
Bitcoin Technical Analysis: BTC Faces Continued Downtrend Amidst High Selling Pressure
 Bitcoin’s price continues its downward trajectory, coasting along at ,950 per unit on June 21, 2024. Despite showing potential entry points, the market is experiencing significant selling pressure across all time frames. Technical indicators suggest a cautious approach for traders as bearish trends dominate the charts. Bitcoin In the short term, the 1-hour chart indicates […]
Bitcoin News
Despite Runes’ Transaction Dominance, Bitcoin Miners See Continued Revenue Drop
 According to recent data, transactions linked to the Runes protocol have been notably high in block utilization since its implementation on April 19. Figures from April 23 show that transactions involving Runes accounted for 81% of block usage on that day. In contrast, traditional financial activities constituted only 18.8% of the transactions processed. As Runes […]
Bitcoin News
World Gold Council Sees Gold as Underowned, Forecasts Continued Rally
 The World Gold Council, an authority in global gold markets, expects the recent gold price rally to continue, supported by geopolitical risks, steady central bank purchases, and demand for coin and jewelry. The council also sees gold ETFs fueling a future rise in prices given their precious metal’s low ownership levels. World Gold Council Paints […]
Bitcoin News
Michael Howell Predicts Continued Surge in Global Liquidity Benefiting Stocks, Gold, and Crypto

Crossborder Capital’s Michael Howell, a veteran in global finance, offered a liquidity-based view on the current state of the economy. He challenged the prevailing narrative of monetary tightening with evidence of a rise in liquidity, which in turn should uplift stocks, gold, and cryptocurrencies.
Michael Howell of Crossborder Capital Focused on Rising Global Liquidity and Its Market Impact
Michael Howell is the founder and CEO of Crossborder Capital, a London-based FCA registered, independent research and investment company with over billion assets under management. Previously he was Head of Research for Baring Securities and Research Director of Solomon Brothers. With a deep understanding of international finance and economics, Howell has become a prominent figure in analyzing global liquidity trends and their impact on markets. Recently, he appeared on Forward Guidance to shed light on the current macroeconomic landscape, emphasizing the continued rise in global liquidity and its positive effects on liquidity-sensitive assets such as stocks, gold, and cryptocurrencies. The whole episode is well worth a listen.
At the heart of Howell’s analysis is the observation that, contrary to popular belief, the Federal Reserve has been subtly injecting liquidity into markets. This covert approach stands in stark contrast to the narrative of monetary tightening that has dominated headlines. Despite a reduction in the Fed’s balance sheet last year, Howell noted that Fed liquidity actually increased by 12 to 15%. This trend is not just a fleeting phase but part of a longer-term pattern of monetary inflation, as central banks globally engage in what Howell described as shadow quantitative easing and shadow yield curve control.
He observed that the draining of the Reverse Repo (RRP) facility and the Bank Term Funding Program (BTFP) contributed significantly to the rise in Fed liquidity last year. He anticipates that central bank liquidity will continue to unlock, especially once the RRP is fully drained, and suggested that the BTFP could even be renewed.
Adding to the complexity of the situation is the U.S. Treasury’s strategic decision to shorten the maturity of its debt issuance. This move, Howell explained, mechanically reduced the private sector’s liquidity needs to absorb government paper, particularly aiding the banking sector in managing its systemic overexposure to duration.
All of this may point to a transition from a rebound phase to a calm phase. Howell noted that the financial sector and high-beta securities such as crypto tend to do their best in such calm phases.
Regarding cryptocurrency, Howell mentioned that there could be particular positive influences. He stated that cryptocurrency might be the younger generation’s preferred hedge against monetary inflation, a sentiment that aligns with the increasing interest in digital assets among younger investors. If true, crypto could move more than gold as the preferred vehicle for younger investors.
What do you think about Howell’s basic argument that a rise in global liquidity will generally benefit liquidity sensitive assets like stocks, gold, and crypto? Share your thoughts and opinions about this subject in the comments section below.
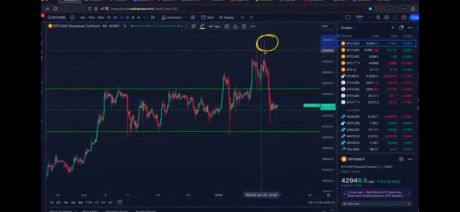
Parabolic Bitcoin Indicator Points To Continued Bull Run Despite 15% Crash
Recently, Bitcoin experienced a significant drop, crashing 15% from its 2024 highs around ,000. This decline followed closely on the heels of the approval of 11 spot Bitcoin Exchange-Traded Funds (ETFs), a move that was initially met with optimism in the crypto community. The sudden downturn has left investors and traders analyzing the charts for clues about Bitcoin’s next move.
Is The Bullish Bitcoin Trend Over?
In the wake of this decline, technical analysis offers a beacon of insight. Notably, the correction was marked by a bearish engulfing candle on the daily chart, signaling a potential reversal in Bitcoin’s upward trend.
Accompanying this was a nasty wick – a long upper shadow on the candlestick chart, indicating a significant sell-off after prices peaked.
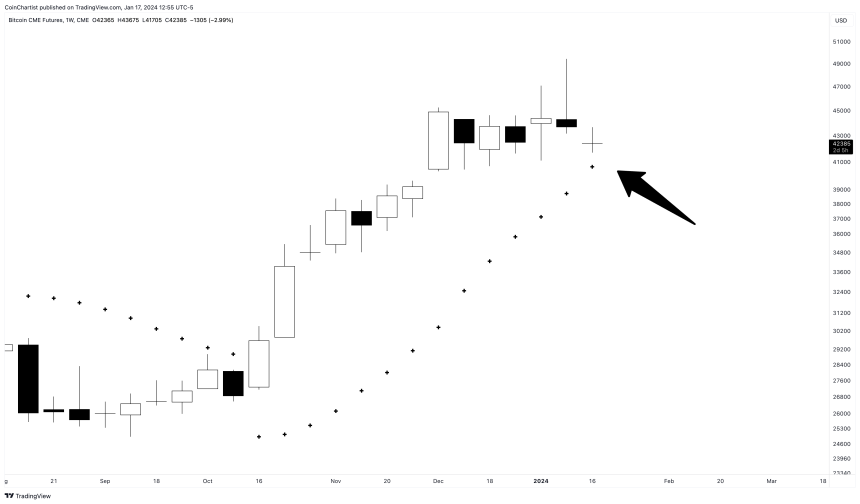
Further complicating the landscape was the opening of the CME BTC Futures with a sizeable gap down. Such gaps are often viewed as potential resistance levels, reinforcing the bearish sentiment.
Stop And Reverse: A Ray Of Hope
However, amidst these seemingly negative signals, a ray of hope shines through from a “parabolic” technical indicator – the Parabolic SAR (Stop and Reverse).
Despite the tumultuous market conditions, the weekly BTCUSD Parabolic SAR indicator remains untagged, suggesting that the long-term uptrend is still intact.
This indicator, known for its effectiveness in identifying potential reversals in the market’s direction, paints a different picture from the immediate bearish signals and sentiment.
What Is The Parabolic SAR?
To fully grasp the significance of the Parabolic SAR in this context, it’s essential to understand what it is and how it functions. The Parabolic SAR is a popular technical analysis tool used primarily to determine the direction of an asset’s momentum and to provide entry and exit points.
The ‘SAR’ in Parabolic SAR stands for ‘Stop and Reverse.’ This indicator is represented on charts as a series of dots placed either above or below the price bars. A dot placed below the price is viewed as a bullish signal, while a dot above is bearish.
The unique aspect of the Parabolic SAR is its ability to act as a trailing stop loss. As the price of an asset moves, the Parabolic SAR adjusts, moving closer to the price line. This adjustment provides a dynamic method for traders to manage their positions, securing profits while limiting potential losses.
In the context of Bitcoin’s current situation, the Parabolic SAR’s position – still below the price bars on the weekly chart – suggests that the long-term bullish trend is not yet disrupted.
Bitcoin Bearish Forecast: Analyst Signals Continued Downfall
The price of Bitcoin appears to be experiencing a bearish moment in the past few days now despite the approval of multiple Bitcoin Spot Exchange-Traded Funds (ETFs), which has raised speculations about the token’s future.
Bitcoin Could See Further Collapse
Bitcoinhyper, a cryptocurrency analyst, has offered his insights on the current state of Bitcoin. The analyst unveiled his predictions to the community during one of his YouTube videos.
According to him, BTC is currently undergoing a decline, which could potentially lead to a further collapse in price. In the beginning, Bitcoinhyper noted an upswing in the price of Bitcoin to ,000 following the approval of BTC spot ETFs by the SEC.
However, the market did not react as anticipated, and there was a notable decline from the ,000 price mark. “Unfortunately, we got a significant dump, and in rejection, from ,000,” he stated.
The analyst highlighted that BTC was up for several days before the ETF approval, with experts anticipating the crypto would hit ,000. Thus, in a surprising turn of events, the asset’s price witnessed a drop of about 16%.
In spite of the Bitcoin spot ETF approval, the market’s perception swiftly took an unpleasant shift. The correction took retail investors by surprise as they were unprepared since they had assumed that the price would rise.
With the crypto asset experiencing such a collapse in price, it is believed that the market will see a massive liquidation. Remarkably, during this decline, liquidations were not as large as anticipated.
Bitcoinhyper noted that during the decline, around .8 million in short positions were liquidated, which is less than expected. The news caused traders to become overconfident while ignoring the possibility of a correction.
No Positive Impact On BTC Price Despite Substantial Inflow
Reportedly, Bitcoin saw a whopping .18 billion inflow in digital assets funds worldwide following ETF approval. Despite the significant inflow of capital, the anticipated impact of boosting the price of BTC has not yet been realized.
On Monday, January 15, the price of BTC dropped below the support level of ,000 as traders turned to Ethereum and other tokens. The approval of ETFs might be a “sell the news” moment, as BTC had dropped by 16% since the announcement.
As of now, it is crucial to observe that the market is becoming less enthusiastic about Bitcoin ETFs. A lot of people are now discussing the potential for an Ethereum ETF.
Currently, Bitcoin is trading at ,951, indicating a decline of over 7% in the past seven days. Its trading volume is up by 3.86% in the last 24 hours, while its market cap is up by 0.75%, according to CoinMarketCap.
Synthetix (SNX) Shines As TVL Hits $670M, Analyst Predicts Continued Upswing
Synthetix (SNX), currently positioned as the 54th largest cryptocurrency, has been closely aligned with the overall market trend. Over the past 30 days, SNX has experienced a substantial uptrend of 60%, while its year-to-date performance shows an impressive price increase of over 108%.
These notable achievements indicate the potential for continued bullish momentum for the decentralized protocol and its native token.
Significant Growth For Synthetix As Demand For On-Chain Derivatives Surges
Renowned cryptocurrency analyst and writer, Jake Pahor, has expressed a highly optimistic outlook on SNX, hailing it as the ultimate “picks & shovels play” in anticipation of the forthcoming bull market.
Pahor highlights Synthetix’s pivotal role as the backbone for derivatives trading in the decentralized finance (DeFi) sector. The protocol has already amassed an annualized revenue of million, serving as a platform that enables the creation and trading of synthetic assets such as commodities, stocks, and currencies.
While Synthetix may not have user-facing front-ends, it powers popular DeFi applications like Kwenta, Polynomial, dHedge, and Lyra. As the demand for permissionless trading of spot synthetics and on-chain derivatives of traditional assets continues to rise, Synthetix stands poised for significant growth in the coming years, according to Pahor.
Notably, a key driver of Synthetix’s success lies in the fees generated on every synthetic asset exchange, ranging from 0.1% to 1% (average 0.3%). These fees are directed towards SNX stakers, creating a rewarding incentive structure.
SNX, sUSD, and eSNX are the three primary tokens utilized within the Synthetix ecosystem, each serving distinct purposes in staking, collateralization, and protocol functionality.
With a circulating supply of 326.5 million SNX tokens and a total supply of 327.2 million, Synthetix boasts a market cap of .14 billion, placing it at the forefront of the Synthetics category. The protocol’s treasury holds a healthy 5.96 million, including stablecoins, BTC/ETH, and its token SNX.
SNX Bulls Poised For Breakout Opportunity
Synthetix operates under the governance of four key bodies: Spartan Council, Treasury Council, Ambassador Council, and Grants Council. These councils’ Decisions and proposals are subject to majority votes from SNX stakers, ensuring a democratic and community-driven approach to protocol development.
It was established as Havven in 2017, a stablecoin protocol, the project rebranded in 2018 to become Synthetix, focusing on synthetic assets and derivatives trading.
According to Pahor’s analysis, with a “strong ecosystem” of projects built on its infrastructure and a first-mover advantage, Synthetix has established itself as the market leader in the Synthetics category.
Furthermore, the impending release of Synthetix V3, including Perps, Base, and USDC, is expected to be a significant catalyst for the protocol. Additionally, the protocol’s DEX perps feature aims to compete with centralized exchanges, while the Infinex front-end promises a user experience akin to traditional CEX trading.
Currently, SNX is trading at .455, reflecting a significant 4.7% uptrend over the past 24 hours. This positive momentum follows a 31% gain over the last fourteen days.
In the immediate future, SNX faces a crucial hurdle in surpassing the resistance level at .58, which is necessary to retest its recently achieved yearly high of .810. As SNX reached this high only a few hours ago, its next target is to surpass the mark, a level not seen since August 2022.
On the other hand, if a short-term pullback or correction unfolds for SNX, it will be crucial for bullish investors to defend the .035 support level. Maintaining this level can sustain a favorable bullish trend throughout the remainder of the month.
Featured image from Shutterstock, chart from TradingView.com