 Based on onchain metrics, the Mt Gox funds, once consolidated into a single address holding over .6 billion in bitcoin, have now been distributed to three separate addresses as of Tuesday morning. Mt Gox Funds Redistribution An examination of the onchain transfers from the Mt Gox bitcoin cache reveals that the funds have been allocated […]
Bitcoin News
Ethereum Price Consolidates: Here Are The Next Key Levels To Watch
Over some days, the price of Ethereum has been in a consolidation zone, moving between ,949 and ,627. This is a result of the rally that happened a few days ago which led to the crypto asset’s price making over 10% movement on the upside.
When prices are consolidating, it can only be considered that it is building momentum to either break above the consolidation zone or below it. At this point, we cannot tell the next action the price will take.
In this article, we will see the possible outcome if there is a break out from the consolidation. As of the time of writing, the price of ETH was up by 0.66%, trading around ,752 above the 100-day Simple Moving Average (SMA) in the last 24 hours.
Ethereum On The 4-Hour Chart
Looking at Ethereum’s chart on the 4-hour timeframe, it can observed that the price is trading above the 100-day moving average, suggesting ETH’s price is on a bullish trend and could break above the consolidation zone.

Also, with the help of the MACD indicator, although the MACD histograms are trending below the MACD zero line, these are already showing signs of weakness as the histogram color is becoming faint.
The MACD line and the MACD signal line are also seen moving toward the MACD zero line but as long as they are still above the zero line, there could be a possible reverser.
With this MACD formation, it could be suggested that the price of Ethereum is still bullish and there is a possibility it could break above the consolidation zone
Finally, using the Relative Strength Index (RSI) also to analyze the price action in the 4-hour timeframe, it can be seen that the RSI line is attempting to back up after failing to cross below the 50 lines, suggesting that the price is still bullish.

Possible Outcomes If There Is A Breakout In Either Direction
Conclusively, if there is a break out above the consolidation zone, the price of ETH might continue to move upward toward the ,094 resistance level. Should the price surpass this resistance level, it might move further upward to create a new high for the year.
On the contrary, if Ethereum breaks below the consolidation zone, the price might begin to move toward the ,263 support level. A breakout below this level might cause a continuous downward movement toward the ,864.04 support level.
XRP Price Consolidates, Gearing Up for Its Next Major Breakout
XRP price extended its decline below the .520 support. The price is now trading in a range and eyeing an upside break above the .5320 resistance.
- XRP extended losses and declined below the .5120 support.
- The price is now trading above .5250 and the 100-hourly Simple Moving Average.
- There is a key bearish trend line forming with resistance at .5325 on the hourly chart of the XRP/USD pair (data source from Kraken).
- The pair could gain bullish momentum if it clears the .5365 resistance zone.
XRP Price Holds Ground
In the past two sessions, XRP price saw a steady decline below the .5320 level. There were a few swing moves like Bitcoin and Ethereum. The price even spiked below the .5120 support zone.
A low was formed at .5028 and the price is now correcting losses. There was a move above the .5200 and .5250 resistance levels. The price climbed above the 50% Fib retracement level of the downward move from the .5477 swing high to the .5028 low.
The price is back above .5250 and the 100-hourly Simple Moving Average. Immediate resistance is near the .5320 level. There is also a key bearish trend line forming with resistance at .5325 on the hourly chart of the XRP/USD pair.
The first key resistance is near .5365 or the 76.4% Fib retracement level of the downward move from the .5477 swing high to the .5028 low. A close above the .5365 resistance zone could send the price higher.
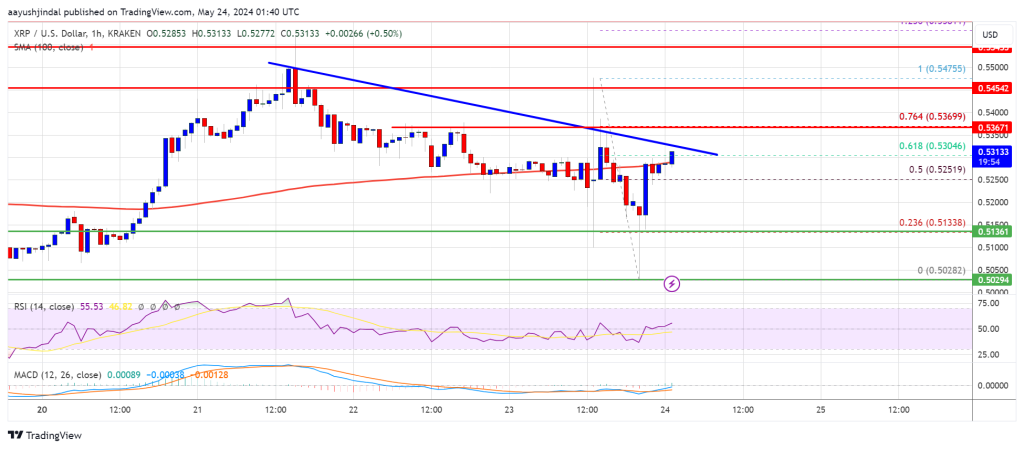
The next key resistance is near .5480. If the bulls push the price above the .5480 resistance level, there could be a steady increase toward the .5570 resistance. Any more gains might send the price toward the .5800 resistance.
Another Decline?
If XRP fails to clear the .5320 resistance zone, it could start another decline within the range. Initial support on the downside is near the .5250 level and the 100 hourly SMA.
The next major support is at .5140. If there is a downside break and a close below the .5140 level, the price might gain bearish momentum. In the stated case, the price could decline and retest the .5030 support in the near term.
Technical Indicators
Hourly MACD – The MACD for XRP/USD is now gaining pace in the bullish zone.
Hourly RSI (Relative Strength Index) – The RSI for XRP/USD is now above the 50 level.
Major Support Levels – .5250 and .5140.
Major Resistance Levels – .5320 and .5365.
Ethereum Price Consolidates: Steadying Before the Next Move?
Ethereum price started a consolidation phase above the ,650 support. ETH seems to be preparing for the next move up toward ,000 in the near term.
- Ethereum started a consolidation after it tested the ,840 resistance zone.
- The price is trading above ,700 and the 100-hourly Simple Moving Average.
- There is a short-term contracting triangle forming with support at ,690 on the hourly chart of ETH/USD (data feed via Kraken).
- The pair could continue to move up unless there is a break below the ,450 support.
Ethereum Price Holds Support
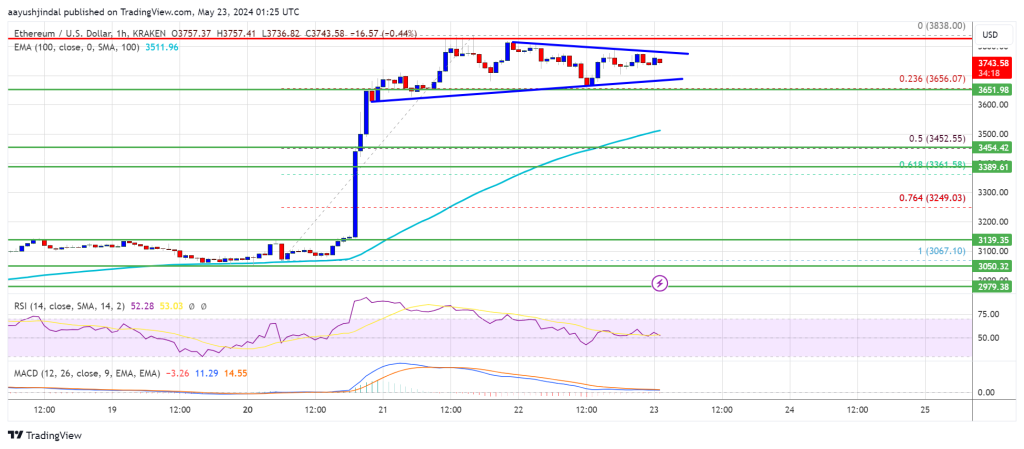
Ethereum price extended its increase above the ,500 and ,650 resistance levels. ETH outperformed Bitcoin and even climbed above the ,800 level. A new weekly high was formed at ,838 and the price is now consolidating gains.
It is holding gains above the 23.6% Fib retracement level of the upward move from the ,065 swing low to the ,838 high. Ethereum is now trading above ,700 and the 100-hourly Simple Moving Average. There is also a short-term contracting triangle forming with support at ,690 on the hourly chart of ETH/USD.
Immediate resistance is near the ,780 level. The first major resistance is near the ,840 level. An upside break above the ,840 resistance might send the price higher. The next key resistance sits at ,920, above which the price might gain traction and rise toward the ,000 level.
If there is a clear move above the ,000 level, the price might rise and test the ,080 resistance. Any more gains could send Ether toward the ,200 resistance zone.
Downside Break In ETH?
If Ethereum fails to clear the ,780 resistance, it could start a downside correction. Initial support on the downside is near the ,690 level and the trend line.
The next major support is near the ,650 zone. A clear move below the ,650 support might push the price toward ,450 or the 50% Fib retracement level of the upward move from the ,065 swing low to the ,838 high. Any more losses might send the price toward the ,360 level in the near term.
Technical Indicators
Hourly MACD – The MACD for ETH/USD is losing momentum in the bullish zone.
Hourly RSI – The RSI for ETH/USD is still above the 75 zone.
Major Support Level – ,650
Major Resistance Level – ,840
Bitcoin Price Consolidates Gains: Stability in the Crypto Market Amid Recent Surge
Bitcoin price rallied and tested the ,500 zone. BTC is now consolidating gains and might attempt another increase toward ,500.
- Bitcoin started a consolidation phase from the ,500 resistance zone.
- The price is trading above ,000 and the 100 hourly Simple moving average.
- There is a key bullish trend line forming with support at ,150 on the hourly chart of the BTC/USD pair (data feed from Kraken).
- The pair could start another increase unless the bears push it below ,800.
Bitcoin Price Remains Supported
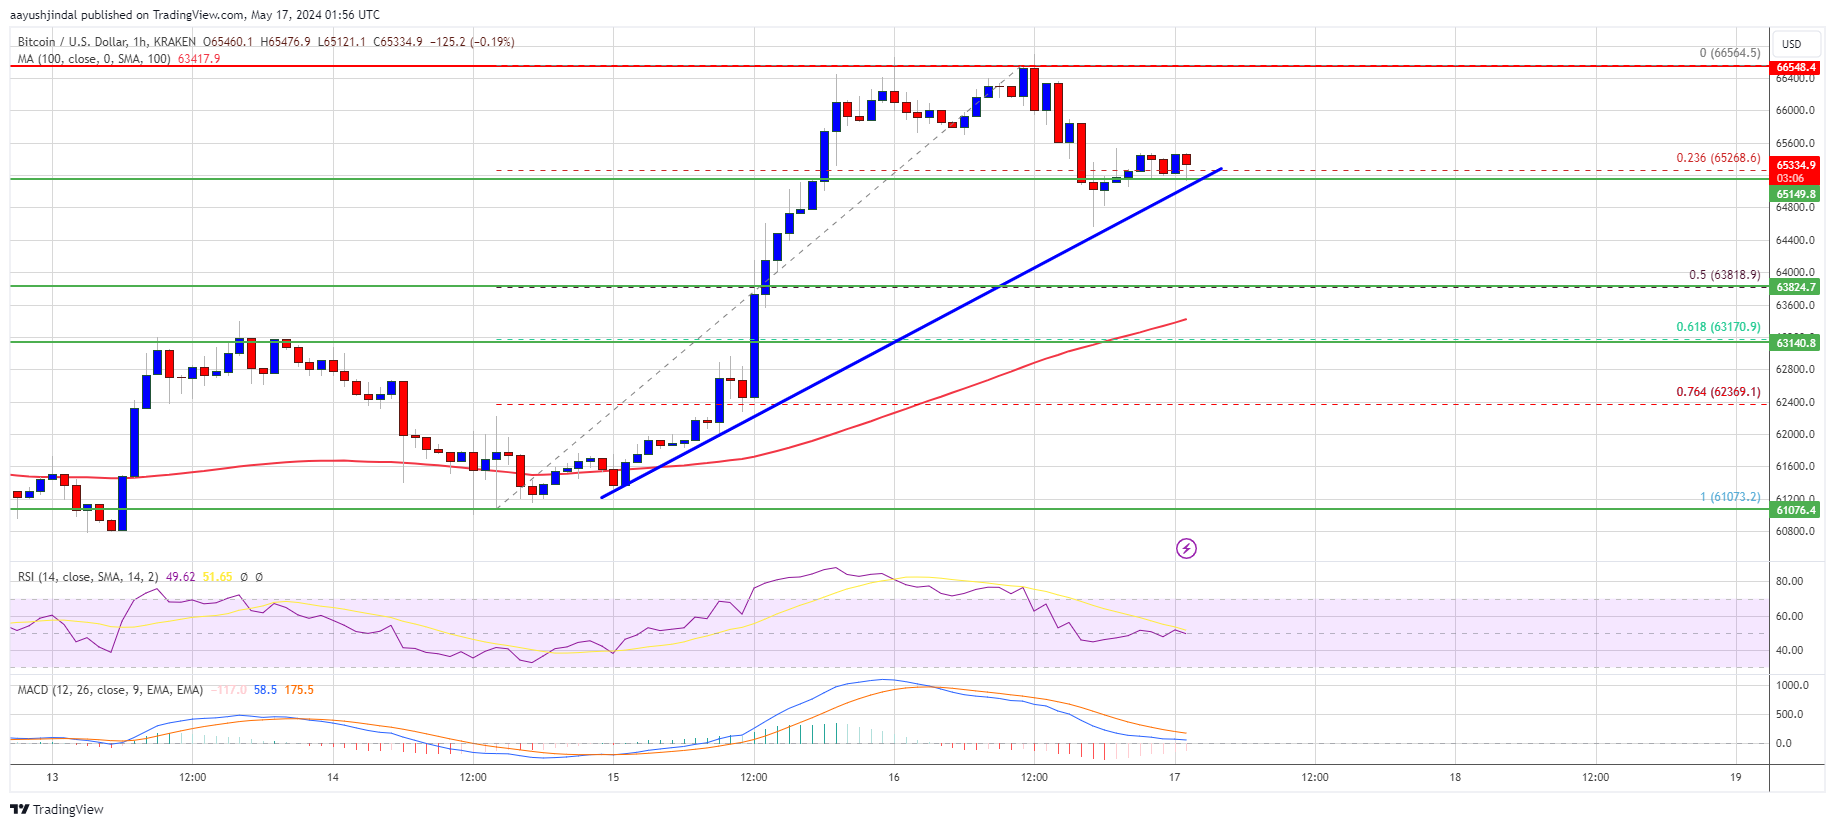
Bitcoin price formed a base and started a fresh increase above the ,500 level. BTC even cleared the ,500 resistance and tested the ,500 region. A new weekly high was formed at ,565 and the price is now consolidating gains.
There was a minor decline below the ,000 level. The price dipped below the 23.6% Fib retracement level of the upward move from the ,073 swing low to the ,565 high.
Bitcoin price is now trading above ,000 and the 100 hourly Simple moving average. There is also a key bullish trend line forming with support at ,150 on the hourly chart of the BTC/USD pair. Immediate resistance is near the ,600 level.
The first major resistance could be ,000. The next key resistance could be ,500. A clear move above the ,500 resistance might send the price higher. In the stated case, the price could rise and test the ,200 resistance.
If the bulls remain in action, the price could rise toward the ,000 resistance zone. Any more gains might send BTC toward the ,000 barrier.
Another Decline In BTC?
If Bitcoin fails to climb above the ,000 resistance zone, it could continue to move down. Immediate support on the downside is near the ,150 level and the trend line.
The first major support is ,200. The main support is now forming near ,800 or the 50% Fib retracement level of the upward move from the ,073 swing low to the ,565 high. Any more losses might send the price toward the ,150 support zone in the near term.
Technical indicators:
Hourly MACD – The MACD is now losing pace in the bullish zone.
Hourly RSI (Relative Strength Index) – The RSI for BTC/USD is now above the 50 level.
Major Support Levels – ,150, followed by ,800.
Major Resistance Levels – ,000, ,500, and ,200.
XRP Price Consolidates Below $0.530: What Could Trigger More Losses?
XRP price is consolidating losses above the .500 support. The price could extend losses if it fails to recover above the .530 resistance zone.
- XRP extended losses and traded below the .530 support.
- The price is now trading below .5250 and the 100-hourly Simple Moving Average.
- There was a break above a connecting bearish trend line with resistance at .5150 on the hourly chart of the XRP/USD pair (data source from Kraken).
- The pair could start another increase if the bulls push the price above .530.
XRP Price Stable Above .50
Recently, XRP price extended losses and traded below the .5250 support, like Bitcoin and Ethereum. There was a move toward the .5080 support. A low was formed at .5087 and the price is now consolidating losses.
There was a minor increase above the .5120 resistance. Besides, there was a break above a connecting bearish trend line with resistance at .5150 on the hourly chart of the XRP/USD pair. However, the pair is still trading below .5250 and the 100-hourly Simple Moving Average.
Immediate resistance is near the .5250 level. It is near the 23.6% Fib retracement level of the downward move from the .5699 swing high to the .5087 low. The first key resistance is near .530 and the 100-hourly Simple Moving Average.
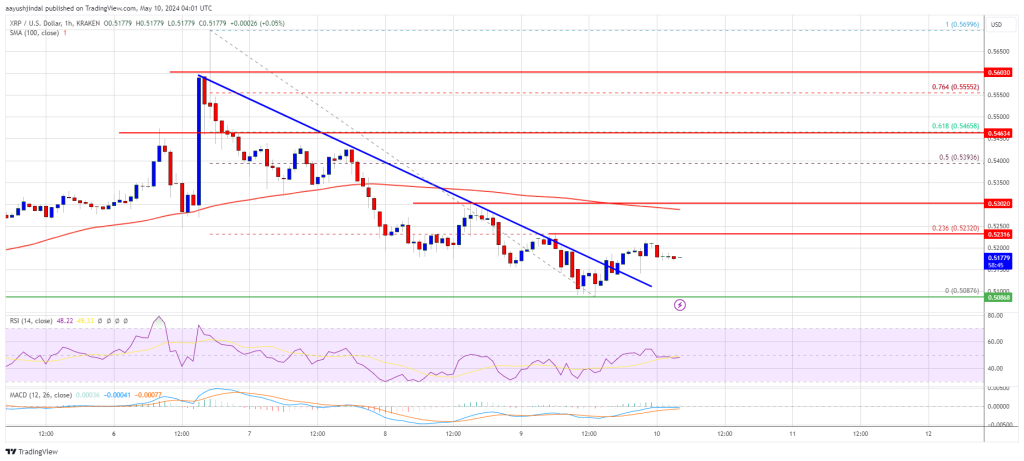
Source: XRPUSD on TradingView.com
A close above the .530 resistance zone could spark a strong increase. The next key resistance is near .5465. If the bulls remain in action above the .5465 resistance level, there could be a rally toward the .580 resistance. Any more gains might send the price toward the .600 resistance.
More Losses?
If XRP fails to clear the .530 resistance zone, it could start another decline. Initial support on the downside is near the .5150 level.
The next major support is at .5080. If there is a downside break and a close below the .5080 level, the price might accelerate lower. In the stated case, the price could retest the .4840 support zone.
Technical Indicators
Hourly MACD – The MACD for XRP/USD is now losing pace in the bearish zone.
Hourly RSI (Relative Strength Index) – The RSI for XRP/USD is now below the 50 level.
Major Support Levels – .5150 and .5080.
Major Resistance Levels – .5250 and .530.
Ethereum Technical Analysis: ETH Consolidates After Testing Key Resistance Levels
 As ethereum continues to navigate a period of significant price fluctuations, traders are keenly observing a variety of technical signals from the 1-hour, 4-hour, and daily charts. The combination of oscillators and moving averages provides a nuanced view of potential entry and exit points. Ethereum The 1-hour chart for ethereum (ETH) reveals notable fluctuations, with […]
Bitcoin News
Bitcoin Price Consolidates Below Hurdles, Can BTC Bounce Back?
Bitcoin price is consolidating below the ,000 resistance zone. BTC must surpass ,000 and ,000 to move into a bullish zone again.
- Bitcoin is struggling to gain pace for a move above the ,000 resistance zone.
- The price is trading below ,000 and the 100 hourly Simple moving average.
- There was a break above a connecting bearish trend line with resistance at ,000 on the hourly chart of the BTC/USD pair (data feed from Kraken).
- The pair could gain bullish momentum if it clears the ,000 resistance zone.
Bitcoin Price Eyes Upside Break
Bitcoin price failed to clear the ,000 resistance zone. BTC started another decline and traded below the ,000 support zone. It even declined below ,000 before the bulls emerged.
A low was formed near ,551 and the price is now attempting a fresh recovery wave. There was a break above a connecting bearish trend line with resistance at ,000 on the hourly chart of the BTC/USD pair. The pair climbed above the 23.6% Fib retracement level of the recent decline from the ,898 swing high to the ,551 low.
Bitcoin price is trading below ,000 and the 100 hourly Simple moving average. Immediate resistance is near the ,250 level. It is close to the 50% Fib retracement level of the recent decline from the ,898 swing high to the ,551 low.
The first major resistance could be ,850. The next resistance now sits at ,000. If there is a clear move above the ,000 resistance zone, the price could continue to move up. In the stated case, the price could rise toward ,500.
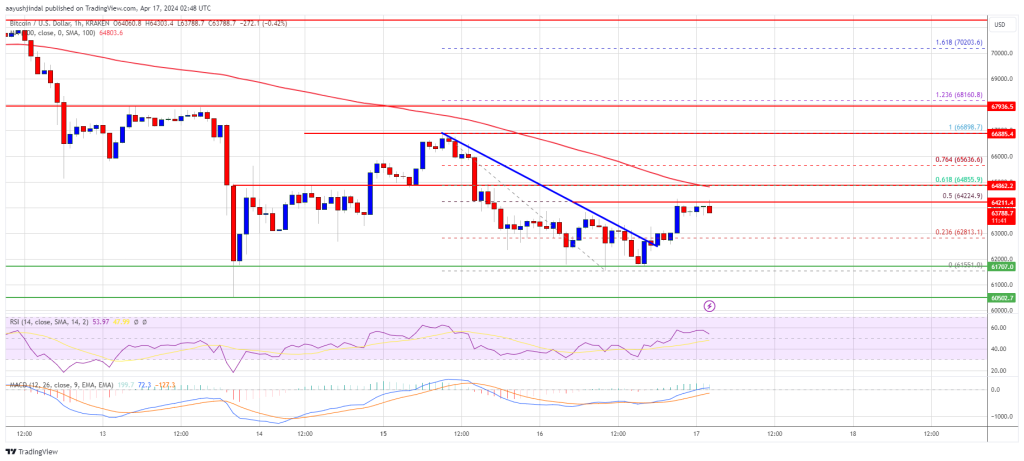
Source: BTCUSD on TradingView.com
The next major resistance is near the ,200 zone. Any more gains might send Bitcoin toward the ,000 resistance zone in the near term.
Another Decline In BTC?
If Bitcoin fails to rise above the ,000 resistance zone, it could start another decline. Immediate support on the downside is near the ,800 level.
The first major support is ,000. If there is a close below ,000, the price could start to drop toward the ,500 level. Any more losses might send the price toward the ,500 support zone in the near term.
Technical indicators:
Hourly MACD – The MACD is now losing pace in the bullish zone.
Hourly RSI (Relative Strength Index) – The RSI for BTC/USD is now above the 50 level.
Major Support Levels – ,000, followed by ,000.
Major Resistance Levels – ,850, ,000, and ,000.
Bitcoin Technical Analysis: Price Consolidates Following Bearish Downturn
 On Wednesday, bitcoin’s trade volume and overall value provided insights into its current technical situation. With a daily trading volume reaching .30 billion and a total market value of .29 trillion, the cryptocurrency’s liquidity and market breadth still stands strong. However, recent downturns have left traders wary. Currently, bitcoin has declined by 6% this week […]
Bitcoin News
Bitcoin Price Consolidates Losses But Recovery Could Face Hurdles
Bitcoin price extended its decline below the ,000 support zone. BTC is now consolidating losses and might attempt a recovery wave toward ,000.
- Bitcoin price declined further below the ,500 and ,000 levels.
- The price is trading below ,500 and the 100 hourly Simple moving average.
- There is a key bearish trend line forming with resistance near ,200 on the hourly chart of the BTC/USD pair (data feed from Kraken).
- The pair could recover but the bears might remain active near ,000.
Bitcoin Price Drops Further
Bitcoin price turned red after it broke the ,000 support zone. BTC extended its decline below the ,500 and ,000 levels. Finally, it tested the ,500 region.
A low was formed near ,572 and the price is now consolidating losses. There was a move above the ,000 level. The price even tested the 23.6% Fib retracement level of the downward move from the ,306 swing high to the ,572 low.
Bitcoin is now trading below ,000 and the 100 hourly Simple moving average. There is also a key bearish trend line forming with resistance near ,200 on the hourly chart of the BTC/USD.
Immediate resistance is near the ,000 level. The first major resistance could be ,200 and the trend line. If there is a clear move above the ,200 resistance zone, the price could start a fresh increase. In the stated case, the price could rise toward the 50% Fib retracement level of the downward move from the ,306 swing high to the ,572 low at ,950.
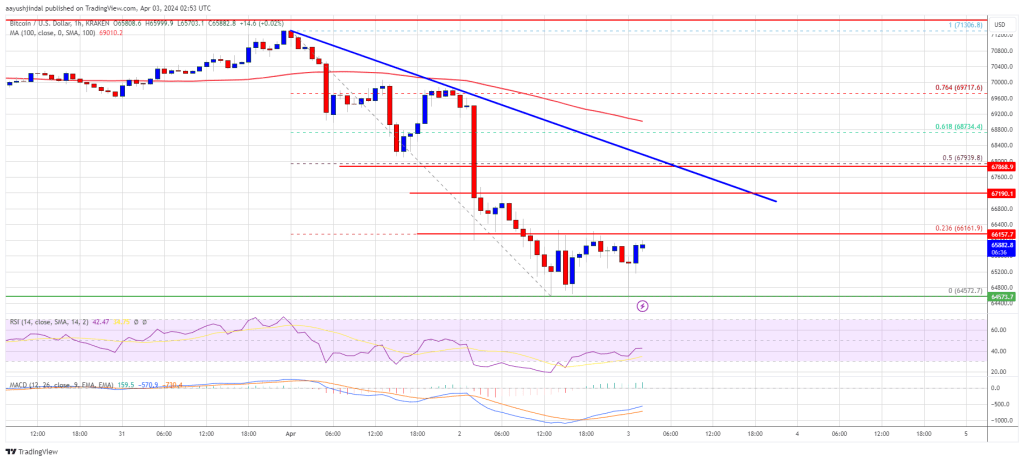
Source: BTCUSD on TradingView.com
The next major resistance is near the ,500 zone. Any more gains might send Bitcoin toward the ,000 resistance zone in the near term.
More Losses In BTC?
If Bitcoin fails to rise above the ,200 resistance zone, it could continue to move down. Immediate support on the downside is near the ,200 level.
The first major support is ,500. The next support sits at ,000. If there is a close below ,000, the price could start a drop toward the ,500 level. Any more losses might send the price toward the ,500 support zone in the near term.
Technical indicators:
Hourly MACD – The MACD is now losing pace in the bearish zone.
Hourly RSI (Relative Strength Index) – The RSI for BTC/USD is now below the 50 level.
Major Support Levels – ,200, followed by ,500.
Major Resistance Levels – ,000, ,200, and ,950.