 The U.S. Securities and Exchange Commission’s (SEC) newest surveillance tool, the Consolidated Audit Trail (CAT), has sparked significant concerns among privacy advocates and legal experts, who warn of an unprecedented expansion of government monitoring over financial transactions. SEC’s CAT Sparks Privacy Concerns and Legal Challenges Recent developments, such as the SEC implementation of the Consolidated […]
Bitcoin News
Bitcoin, Ethereum Technical Analysis: BTC Retreats From Recent High, ETH Consolidated Gains

Bitcoin retreated from a recent multi-week high on Saturday, as sentiment shifted bearish to start the weekend. The drop comes following a four-day win streak, leading many to see today’s declines as profit-taking. Ethereum was marginally higher.
Bitcoin
Bitcoin slipped from a two-week high to start the weekend, as bears moved to snap a recent four-day win run.
BTC/USD hit a bottom of ,240.70 earlier in today’s session, which comes following a peak at ,840.50 the day before.
The fall appears to have come as bulls were unable to sustain recent pressure that saw BTC climb to its strongest point since August 31.
From the chart, the drop coincides with the relative strength index (RSI) failing to move above a ceiling of 53.00
At the time of writing, price strength is now tracking at 51.27, with a floor of 41.00 a potential target.
Bulls will likely look to avoid market consolidation and force a breakout of the 53.00 level, which could lead bitcoin back above ,000.
Ethereum
Ethereum (ETH) was marginally higher in today’s session, with the price remaining above a key support level.
Following a low of ,613.25 on Friday, ETH/USD rose to an intraday high of ,652.11 earlier in the day.
Saturday’s gains have somewhat eased, with the world’s second-largest cryptocurrency now trading at ,637.80.
Like bitcoin, this comes as bulls were unable to facilitate a break out of a resistance level, in this instance at the 48.00 zone.
Price strength currently sits at a reading of 46.39, with earlier volatility easing as the session progresses.
Despite ETH now consolidating, a potential upward cross of the 10-day (red) and 25-day (blue) moving averages could lift prices in the coming days.
Register your email here to get weekly price analysis updates sent to your inbox:
Will ethereum consolidate for the rest of the weekend? Leave your thoughts in the comments below.
MATIC On The Upper Side Of The Consolidated Range, Breakthrough Incoming?
MATIC has been on the rise for the past week now. Over the last 24 hours, MATIC increased 2%, and the coin gained close to 14% in the past week. The altcoin was moving within a range but was not precisely rangebound as it approached the immediate resistance mark.
The technical outlook of the altcoin pointed towards the bulls, depicting strength. The accumulation of MATIC increased, which also means that demand for the coin shot up. If demand increased slightly, the altcoin would move past the local resistance over the subsequent trading sessions.
As the king coin consolidates, Bitcoin will need to show some strength and move above the ,000 mark. Many altcoins have been struggling to break past their immediate resistance mark.
As buying strength for MATIC noted an uptick, it also signified that the coin would soon move toward the overbought region. The range within which MATIC was moving fell between .16 and .28. Currently, Polygon (MATIC) is trading 57% below its all-time high secured in 2021.
MATIC Price Analysis: One-Day Chart
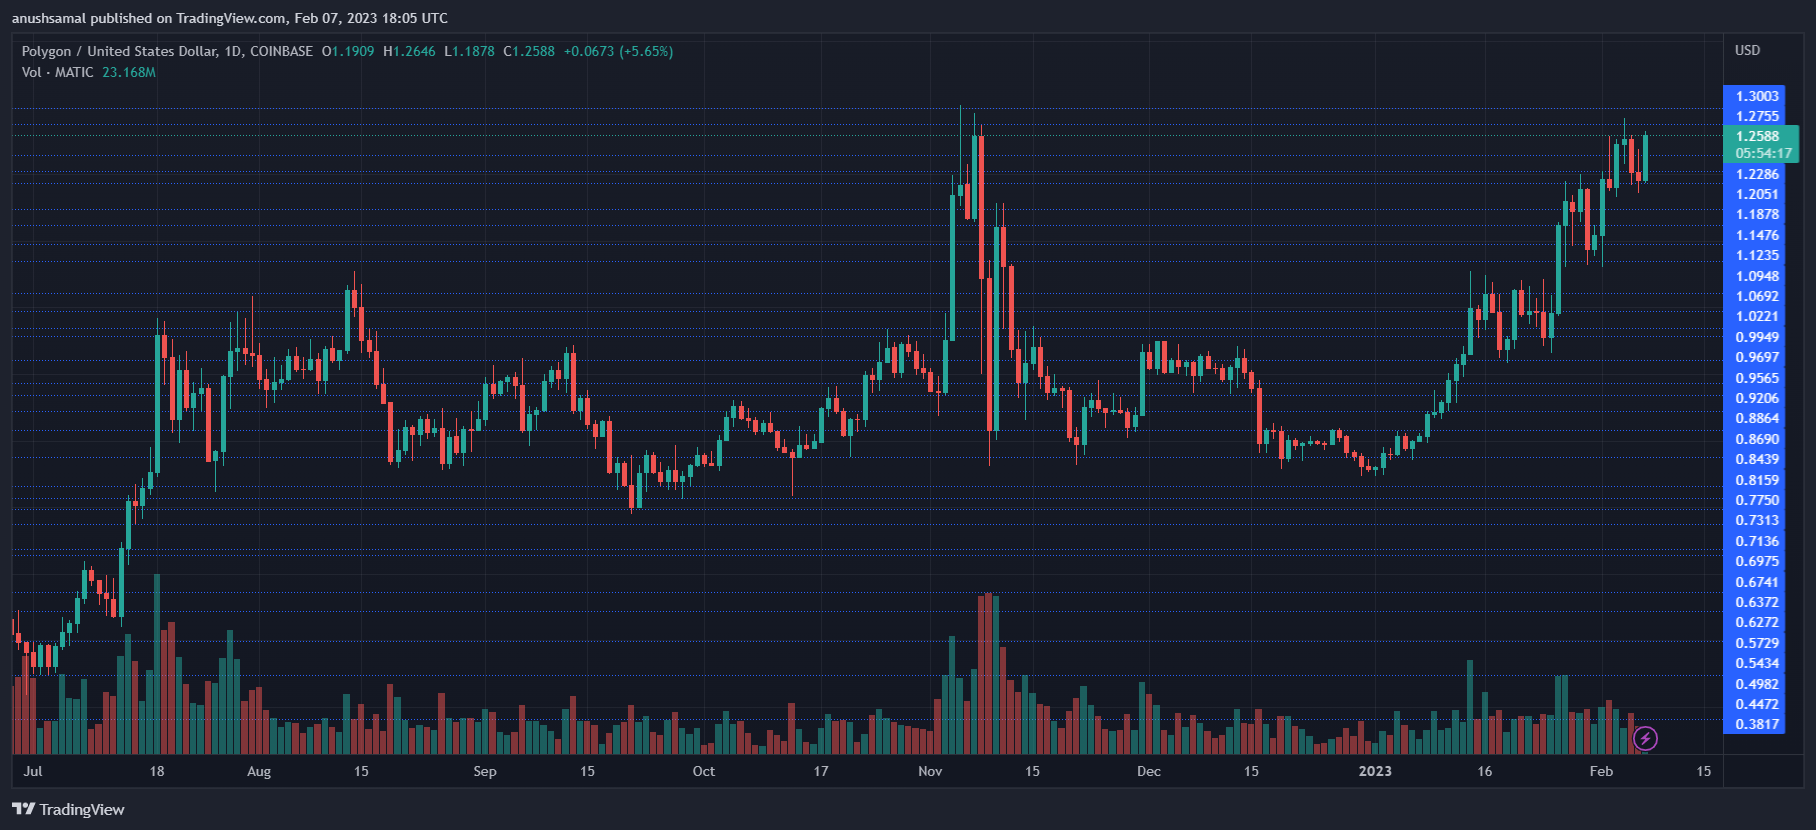
The altcoin was trading at .24 at the time of writing. Over the last week, the coin broke past important resistance levels; for instance, the .18 level acted as a strong barrier. After MATIC crossed that level, the coin moved up more quickly until it touched the .25 level.
The level above had weakened the bulls briefly. At the moment, a buying force will take the coin above the .27 level, causing it to reach .30.
On the flip side, if the altcoin starts to retrace, the first stop is at .20, and another drag by the bears will make it land below .18, causing the coin to fall further. The amount of MATIC traded in the last session was green, which indicated that the coin was under buying pressure.
Technical Analysis
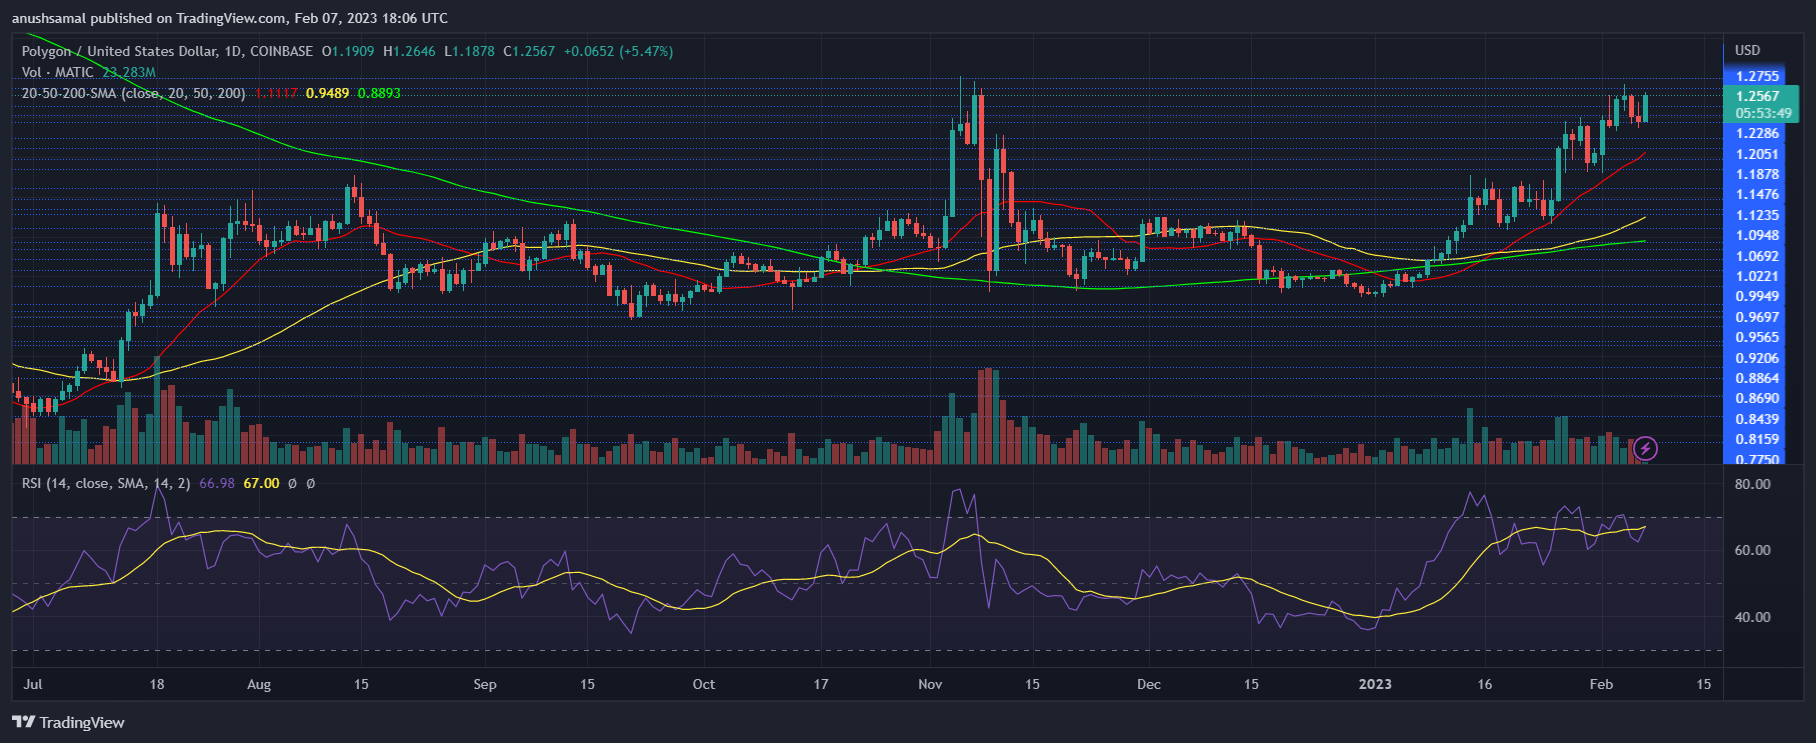
Polygon (MATIC) had hovered around the overbought zone for the past few weeks, and the coin was overvalued at the moment. The Relative Strength Index noted a sharp uptick and moved above the 60-mark, which meant that the coin was planning to move further north.
On a similar note, MATIC’s price moved above the 20-Simple Moving Average line as buyers drove the price momentum in the market. The coin also shot past the 50-SMA and 200-SMA lines, which suggested a further rally for MATIC.
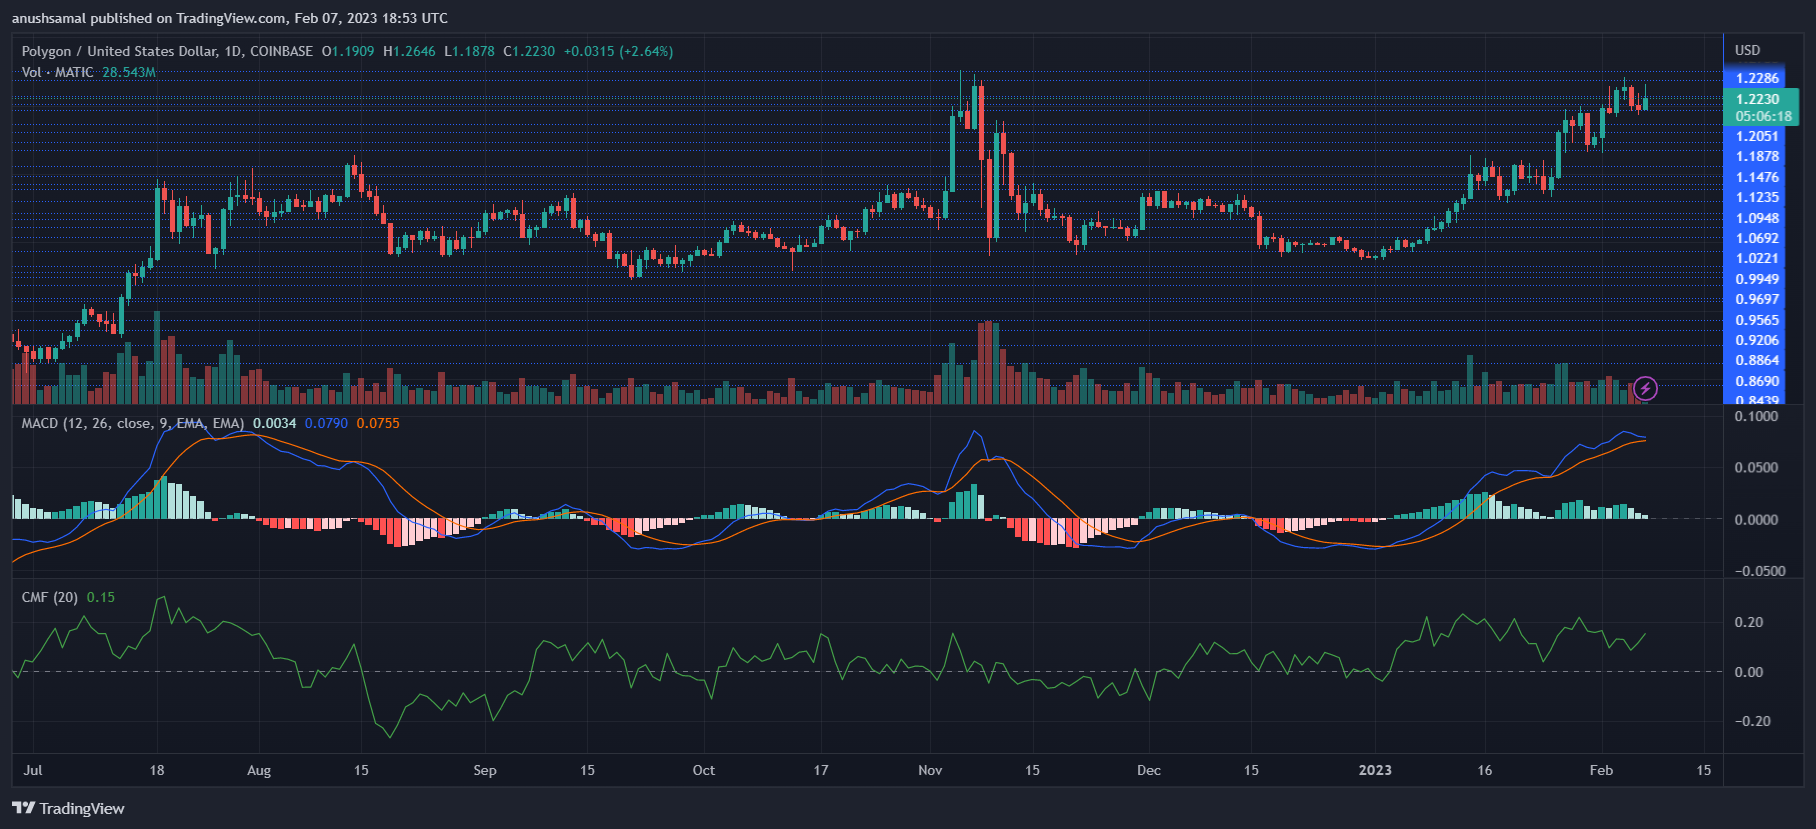
Other technical indicators also showed that the bulls were in command, as there were buy signals for investors. The Moving Average Convergence Divergence (MACD) underwent a bullish crossover and formed green signal bars, indicating a buy signal.
This implied a further increase in price for MATIC. MACD indicates price momentum and reversals. The Chaikin Money Flow points towards capital inflows and outflows; the indicator was above the half-line, meaning capital inflows were higher than outflows.
TA: Bitcoin Consolidated above $36K, Why BTC Could Start A Fresh Increase
Bitcoin price started a downside correction from the ,000 resistance against the US Dollar. BTC is holding the ,000 support and it could rise again in the near term.
- Bitcoin extended its rise and it even cleared the ,000 resistance (as discussed yesterday).
- The price is still trading above ,375 and the 100 hourly simple moving average.
- There is a major contracting triangle forming with support near ,350 and ,000 on the hourly chart of the BTC/USD pair (data feed from Kraken).
- The pair is likely to break the triangle resistance at ,500 to start a fresh increase.
Bitcoin Price Holding Key Support
After trading above the ,500 level, bitcoin price started a downside correction. BTC failed to stay above the ,000 level and it even broke the ,500 support level.
The price even broke the ,000 level, but the bulls were active above the ,000 level. A low is formed near ,220 and the price is currently consolidating in a range. It climbed above the 23.6% Fib retracement level recent decline from the ,716 high to ,220 low.
Bitcoin is still trading above ,375 and the 100 hourly simple moving average. There is also a major contracting triangle forming with support near ,350 and ,000 on the hourly chart of the BTC/USD pair.
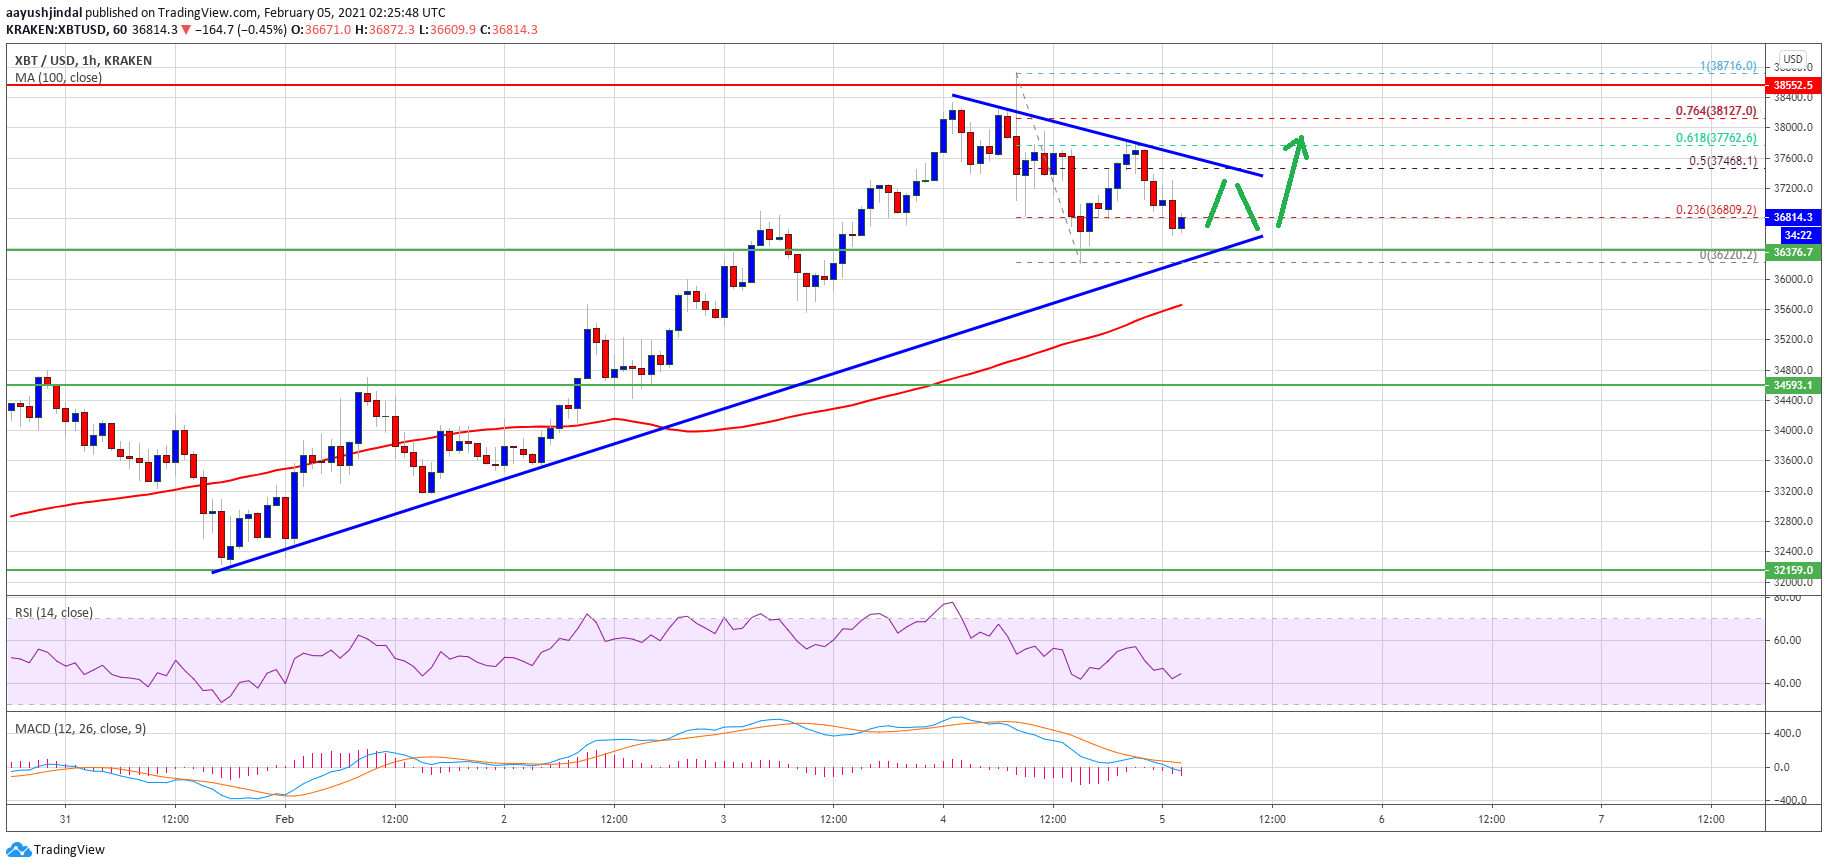
Source: BTCUSD on TradingView.com
The triangle resistance is near the ,500 level. It is close to the 50% Fib retracement level recent decline from the ,716 high to ,220 low. If there is a clear break above the triangle resistance and ,500, there are chances of a steady increase.
The next major resistance is near the ,000 level. A successful close above the ,000 level could set the pace for a move towards the ,800 and ,000 levels.
Downside Break in BTC?
If bitcoin fails to clear the ,500 resistance and the triangle upper trend line, it could continue to move down. The first key support is near the triangle lower trend line at ,350.
The next key support is near the ,000 level, below which the price might test the 100 hourly SMA. Any more losses could lead the price towards the ,000 support in the near term.
Technical indicators:
Hourly MACD – The MACD is gaining momentum in the bearish zone.
Hourly RSI (Relative Strength Index) – The RSI for BTC/USD is now just below the 50 level.
Major Support Levels – ,350, followed by ,000.
Major Resistance Levels – ,500, ,000 and ,800.
UNAUDITED CONSOLIDATED INTERIM FINANCIAL STATEMENTS FOR THE SIX MONTH PERIOD ENDED 30 JUNE 2017
Coinsilium, the blockchain venture builder and investor that finances and manages the development of early-stage blockchain technology companies, is pleased to announce its unaudited consolidated interim financial statements for the six months ended 30 June 2017. Financial Summary Total Comprehensive Income* of £290,210 (H1 2016: loss of £258,533) Loss for the period from continuing operations … Continue reading UNAUDITED CONSOLIDATED INTERIM FINANCIAL STATEMENTS FOR THE SIX MONTH PERIOD ENDED 30 JUNE 2017
The post UNAUDITED CONSOLIDATED INTERIM FINANCIAL STATEMENTS FOR THE SIX MONTH PERIOD ENDED 30 JUNE 2017 appeared first on NEWSBTC.