 On Monday, bitcoin’s value soared back to the ,000 mark after a decline to just under ,000 the previous week. Over the last 24 hours, its value against the U.S. dollar has increased by 7%, reaching a peak of ,645 for each unit. Bitcoin’s Swift Comeback For the first time since March 14, 2024, bitcoin […]
Bitcoin News
Surge Alert: Bitcoin’s Futures Basis Climbs To New Heights, What This Means For BTC
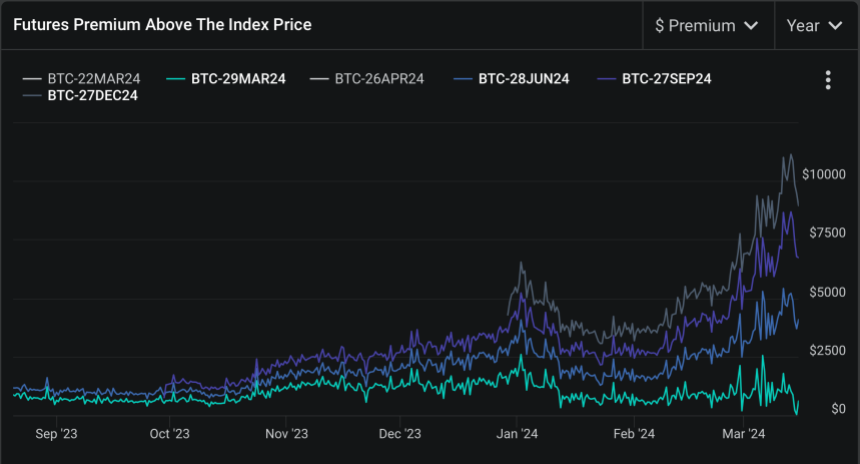
Bitcoin’s futures market is showcasing signs that have historically signalled bullish sentiment. Analysts are turning their attention to the Bitcoin futures basis—a metric representing the differential between the futures price of Bitcoin and its spot price.
Recent data has revealed that this basis has escalated to unprecedented levels since Bitcoin’s all-time high of ,000 in November 2021.
Bullish Indications From Bitcoin Futures
Deribit’s Chief Commercial Officer, Luuk Strijers, has highlighted the current state of the Bitcoin futures basis, which ranges between 18% to 25% annually, a rate reminiscent of the market conditions in 2021.
According to Strijers’s comment, this elevated basis is not just a number but a lucrative opportunity for derivatives traders.
By engaging in trades that involve buying Bitcoin in the spot market and simultaneously selling futures contracts at a premium, traders can secure a “dollar gain” that will materialize at the contract’s expiry, irrespective of Bitcoin’s price volatility.
Strijers further noted that this strategy is particularly appealing in the current climate, fueled by the influx of new investments following the approval of Bitcoin ETFs and anticipation surrounding the Bitcoin halving event.
The significance of the heightened futures basis extends beyond the mechanics of derivatives trading. It further reflects broader market optimism, “bolstered” by recent regulatory approvals and macroeconomic factors influencing cryptocurrency.
The disparity between Bitcoin’s spot and futures prices suggests a confident market outlook, propelled by the anticipation of continued investment inflows and the impact of the upcoming Bitcoin halving.
Such conditions create a fertile ground for Bitcoin’s value to surge, as historical precedents have often linked bullish futures basis rates with periods of substantial price appreciation.
Market Sentiment And Halving Cycles
While Bitcoin’s current market performance exhibits a bearish trajectory, with a 3.9% dip bringing its price to ,203, market analysts advise against interpreting this as a negative signal. Rekt Capital, a respected figure in crypto analysis, views the recent price correction as a “positive adjustment” preceding the much-anticipated Bitcoin halving in April.
Halving events, which reduce the block reward for miners, thus slowing the rate of new Bitcoin entering circulation, have traditionally catalyzed significant price rallies due to the resulting supply constraints.
Rekt Capital’s analysis parallels current market movements and historical patterns observed in previous halving cycles.
According to the analyst, despite the swift pace of these cycles, they exhibit a consistent sequence of a pre-halving rally followed by a retracement phase—both of which align with Bitcoin’s current trajectory. This cyclical perspective suggests that the recent dip is merely a temporary setback, setting the stage for the next bullish phase post-halving.
Though there are signs of BTC experiencing an Accelerated Cycle…
History still continues to repeat, nonetheless$BTC broke out into a “Pre-Halving Rally” right on schedule
And now, #Bitcoin is transitioning into its “Pre-Halving Retrace” right on schedule#Crypto https://t.co/Egqxs9ritl pic.twitter.com/lj0IdQtBEE
— Rekt Capital (@rektcapital) March 15, 2024
Featured image from Unsplash, Chart from TradingView
FDUSD Climbs the Stablecoin Ladder, Fueled by Trading Volume and Supply Growth
 Statistics indicate that the first digital usd (FDUSD), a recently introduced fiat-pegged token launched in August 2023, has risen to become the fourth-largest stablecoin based on market capitalization. Currently, FDUSD holds the fourth position in terms of 24-hour global trading volume. FDUSD Claims Fourth Spot Among Stablecoin Titans In the realm of U.S. dollar-pegged cryptocurrencies, […]
Bitcoin News
Bitcoin Sets New Record, Climbs Above $70,000 Mark; Ethereum Hits $4K Milestone
 Bitcoin has once more surpassed its previous highest point of ,210, established on March 5, 2024, as documented by Bitstamp. Currently, the digital currency holds steady above the ,000 mark, having outdone its prior peak and ascended to ,184 per coin. New Peaks: Bitcoin Tops ,000 While Ethereum Briefly Crosses ,000 The value of bitcoin […]
Bitcoin News
Ethereum Price Climbs Toward $3,200 And Bulls Are Just Getting Started
Ethereum price is outperforming Bitcoin with a move above ,000. ETH is showing bullish signs and might soon climb above the ,200 resistance.
- Ethereum started a fresh increase above the ,000 resistance zone.
- The price is trading above ,050 and the 100-hourly Simple Moving Average.
- There is a key bullish trend line forming with support at ,080 on the hourly chart of ETH/USD (data feed via Kraken).
- The pair could extend its increase toward ,200 or even ,250 in the near term.
Ethereum Price Outperforms Bitcoin
Ethereum price remained stable above the ,880 support zone. ETH formed a base and started a fresh increase above the ,000 resistance. It gained nearly 5% and outperformed Bitcoin.
A new multi-week high is formed near ,121 and the price is now consolidating gains. It is trading above the 23.6% Fib retracement level of the upward wave from the ,907 swing low to the ,121 high. There is also a key bullish trend line forming with support at ,080 on the hourly chart of ETH/USD.
Ethereum is now trading above ,085 and the 100-hourly Simple Moving Average. Immediate resistance on the upside is near the ,120 level. The first major resistance is near the ,150 level.
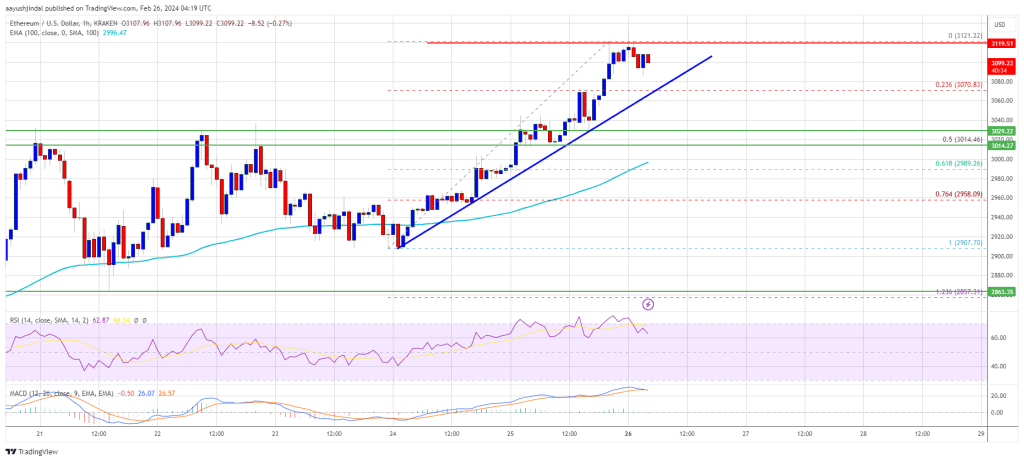
Source: ETHUSD on TradingView.com
The next major resistance is near ,200, above which the price might gain bullish momentum. If there is a move above the ,200 resistance, Ether could even rally toward the ,280 resistance. Any more gains might call for a test of ,320.
Are Dips Supported In ETH?
If Ethereum fails to clear the ,120 resistance, it could start a downside correction. Initial support on the downside is near the ,080 level and the trend line.
The first major support is near the ,000 zone. It is close to the 50% Fib retracement level of the upward wave from the ,907 swing low to the ,121 high, below which Ether might test the 100-hourly Simple Moving Average. The next key support could be the ,960 zone. A clear move below the ,960 support might send the price toward ,920. Any more losses might send the price toward the ,860 level.
Technical Indicators
Hourly MACD – The MACD for ETH/USD is losing momentum in the bullish zone.
Hourly RSI – The RSI for ETH/USD is now above the 50 level.
Major Support Level – ,000
Major Resistance Level – ,120
Apecoin Climbs To 6-Month High Amidst Whales’ Strategic Moves
Apecoin (APE) is experiencing a rollercoaster ride in 2024. After plummeting to an all-time low of .01 in October 2023, the Bored Ape Yacht Club governance token has experienced a dramatic turnaround, buoyed by strategic whale buying and a recent partnership with the Arbitrum network.
However, with a 13% pullback in the past two days and lingering profit-taking concerns, questions remain about whether the bulls can defend key support levels and push the price back towards its former glory.
At the time of writing, APE was flashing green, trading at .73, which is a 0.6% and 7.5% increase in the 24-hour and weekly timeframes, data from Coingecko shows.
Riding The Arbitrum Wave
The turning point came on February 16th, when the Apecoin DAO voted to launch ApeChain, a dedicated blockchain, on the Arbitrum network. This partnership, aimed at tackling scalability issues and fostering ecosystem growth, sparked a 21% surge in APE price, pushing it to a six-month high of .90.
Whales Hold Firm, Retail Cashes Out
On-chain data paints a fascinating picture of contrasting investor behavior. While retail investors and swing traders were quick to lock in profits after the rally, “whales” – those holding at least 10 million APE tokens – have displayed unwavering confidence.
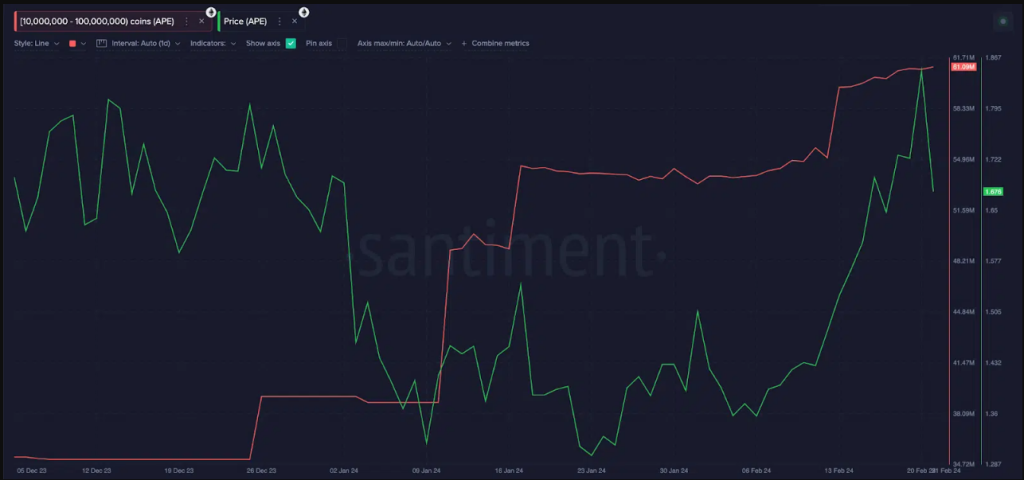
Since January 1st, these large investors have acquired an additional 22 million APE tokens, representing a staggering million investment and bringing their total holdings to 61 million APE. This unwavering conviction suggests long-term optimism in the project’s potential.
Can The Bulls Hold The Line?
Despite the bullish whale activity, a recent pullback has cast a shadow on the optimistic outlook. The price dipped 13% in the past two days, testing the crucial .50 support level. A breach of this support could trigger further decline towards . However, a large buying cluster at .50, representing 9,630 investors who purchased APE at that price, could act as a significant barrier to a deeper fall.
Eyes On , But Hurdles Remain
Technical analysis and market sentiment suggest a potential early rebound towards in the coming weeks. However, this hinges on two key factors: defending the .50 support and overcoming further profit-taking waves. Additionally, broader positive developments in the NFT sector could provide tailwinds for APE price.
Looking Beyond The Immediate
Congratulations to @apecoin DAO on its decision to develop ApeChain utilizing the Arbitrum tech stack!
With $APE serving as both the gas and governance token for ApeChain, Arbitrum Orbit’s customizability empowers @ApeCoin DAO with true ownership and control over this…
— Offchain Labs (@OffchainLabs) February 15, 2024
While the Arbitrum partnership and whale support are encouraging, several hurdles remain. The broader macroeconomic climate, still grappling with inflation and interest rate concerns, could impact investor sentiment across the cryptocurrency market. Moreover, the success of ApeChain itself remains to be seen, and any unforeseen challenges could dampen enthusiasm.
With a potential mark tantalizingly close, Apecoin faces a critical juncture. Whether the bulls can overcome the immediate hurdles and propel the token to new heights, or if profit-taking and broader market headwinds prevail, remains to be seen.
Featured image from Pexels, chart from TradingView
Render (RNDR) Climbs 60% This Month, Keeps Investors Upbeat With These Developments
With AI enveloping much of the media we consume nowadays, Render (RNDR) rides the bullish wave around generative content. According to Coingecko, the token is up over 26% this week with the biggest jump occurring at the monthly timeframe at 60%. It shows that investors are still excited by Render’s possible role within the media space.
The protocol is continuing to develop its capabilities relative to the needs of the media and AI industries. For example, 2023 brought Render to the eyes of the broader public as it carried out its first rendering jobs for the Las Vegas Sphere and Apple with its Apple Vision Pro.
2024 is The Year For AI
The Render Network’s position as a decentralized GPU-based rendering solution provider is strengthened by this year’s developments in generative AI. One example that has been making rounds on the internet is Sora, OpenAI’s newest entry in the realm of generative content. Capable of creating high-fidelity prompts, Sora becomes the poster child of generative content.
“What is exciting about this level of quality is how well defined 4D scene elements are preserved in latent space – IMO that is key to blending/decomposing neural generated assets within a rendered scene graph,” said the founder and CEO of OTOY Jules Urbach, highlighting the role of Render in the coming future.
.@EMostaque 100% Yes!
And – beyond pixels – Gen AI at this fidelity means we are closing in on generating true rendering primitives (rays/surfaces/BDRFs).
We need to get there for non-raster devices and endpoints: real time video games, spatial platforms – or as @sama, myself… https://t.co/8ca5qNoR33
— Jules Urbach (@JulesUrbach) February 15, 2024
“I believe crossing over this threshold in the very near future will be life-changing for many creators and artists. High friction pain points in digital content creation may soon be re-imagined – without limiting the value and artistry of authentic human creativity and expression,” Urbach added.
Along with the variety of AI products released by big tech companies like META, NVIDIA, and Google, investors are eyeing the growth of Render as a major player in the cloud-based rendering space.
More Partners, More Growth
Since its implementation of RNP-004, partnerships with other Web 3 organizations has grown. This month, Nosana was added after RNP-008 was passed in the final vote. The new addition joins the likes of IO.net, Beam, and FedM1.
RNDR Slows As Market Becomes Sluggish
As the hot and bullish market cools, RNDR follows the broader market in its decline in the coming weeks. Investors and traders should be wary of how RNDR reacts to outside pressure. With this in mind, bulls should target the 50% retracement level to slow down any bearish pressure in the short to medium term.
If the bulls fail to materialize any resistance against the bears, the bears can bring RNDR down to .6.
Featured image from Pexels, chart from TradingView
Alameda Research’s Worldcoin Investment Hits All-Time High, Exceeding $50M As WLD Price Climbs
Worldcoin, the digital identity token ERC-20 project on the Ethereum (ETH) blockchain, has garnered significant attention. Its native token, WLD, emerges as the top performer among the top 100 cryptocurrencies by market capitalization.
The token has experienced a remarkable 31% uptrend in just 24 hours and a staggering 217% surge over the past fourteen days. This surge not only marks a new all-time high for WLD but also positively impacts Alameda Research, the now-bankrupt trading arm of the defunct FTX exchange, which holds a substantial stake in Worldcoin.
Alameda Research’s Stake In Worldcoin Reaches 6 Million
According to on-chain data, Alameda Research, a cryptocurrency trading firm co-founded by Sam Bankman-Fried and Tara Mac Aulay in 2017, has witnessed a surge in its Worldcoin holdings.
As WLD reached a new all-time high of .9788 on Monday, the trading firm’s investment in the project surged by million, reaching a new record. Currently, Alameda Research holds 25 million WLD tokens, valued at 6 million, representing 33% of their total portfolio.
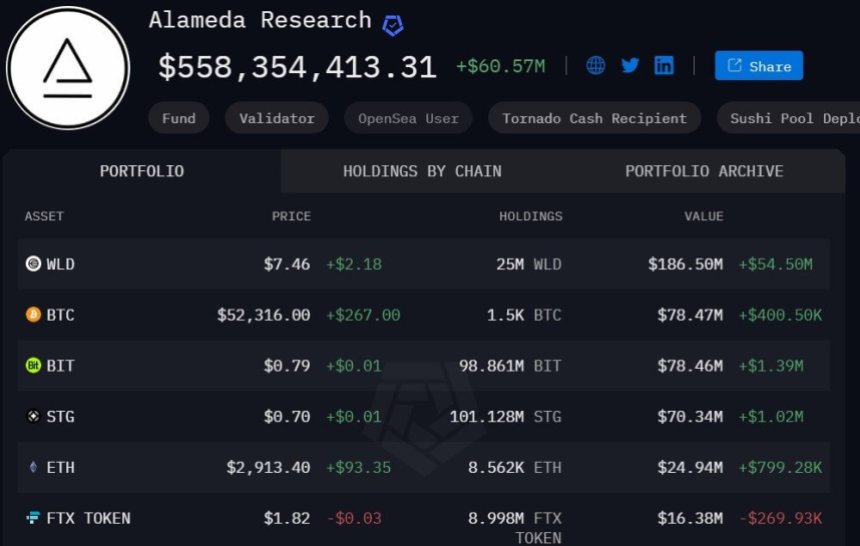
This portfolio also includes other digital assets such as Bitcoin (BTC), BitDAO (BIT), Ethereum (ETH), Stargate Finance (STG), and the FTX token FTT.
Whale Activity And AI Hype Drive WLD’s Price Surge
Analysts such as Zameer Attar attribute the WLD price spike to strong whale activity, with one notable whale wallet withdrawing 2.09 million WLD tokens (.82 million) from Binance.
This withdrawal caused a 25% surge in the price of Worldcoin, resulting in the whale’s holdings reaching an impressive .03 million. Additionally, the launch of OpenAI Sora by Sam Altman, one of the founders of Worldcoin, has triggered bullish action in WLD tokens.
Interestingly, Sora can create videos of up to 60 seconds with highly detailed scenes, complex camera movements, and multiple characters with emotions, which surrounding the hype of artificial intelligence (AI) has spurred investor interest, leading to more bullish sentiment surrounding WLD.
Worldcoin, founded by Sam Altman, Alex Blania, and Max Novendstern, aims to revolutionize the global identity and financial network by creating a public utility known as World ID.
This privacy-preserving identity network enables users to verify their humanness online while maintaining their privacy through zero-knowledge proofs. The project has garnered significant funding, raising over 0 million across various funding rounds from investors, including a16z, Khosla Ventures, Bain Capital Crypto, Blockchain Capital, and Tiger Global.
The combination of whale activity and positive market sentiment surrounding AI technologies has contributed to the considerable surge in Worldcoin’s price.
Featured image from Shutterstock, chart from TradingView.com
Bitcoin Price Climbs To $46K, Uptrend Could Extend To $48K?
Bitcoin price is gaining pace above the ,500 resistance. BTC tested ,000 and could extend its rally toward the ,000 resistance.
- Bitcoin price climbed higher above the ,500 and ,000 resistance levels.
- The price is trading above ,000 and the 100 hourly Simple moving average.
- There is a key connecting bullish trend line forming with support at ,480 on the hourly chart of the BTC/USD pair (data feed from Kraken).
- The pair could continue to move up if it clears the ,000 resistance zone.
Bitcoin Price Jumps 5%
Bitcoin price started a steady increase above the ,500 resistance zone. BTC cleared a few hurdles near the ,000 and ,200 levels to move into a positive zone.
The bulls gained strength and were able to pump the price above the ,000 resistance. It traded close to the ,000 level. A new multi-day high is formed near ,955 and the price is showing signs of more gains in the near term.
Bitcoin is trading well above the 23.6% Fib retracement level of the recent surge from the ,765 swing low to the ,955 high. It is also trading above ,000 and the 100 hourly Simple moving average.
Besides, there is a key connecting bullish trend line forming with support at ,480 on the hourly chart of the BTC/USD pair. Immediate resistance is near the ,000 level. The next key resistance could be ,200, above which the price could start another decent increase.
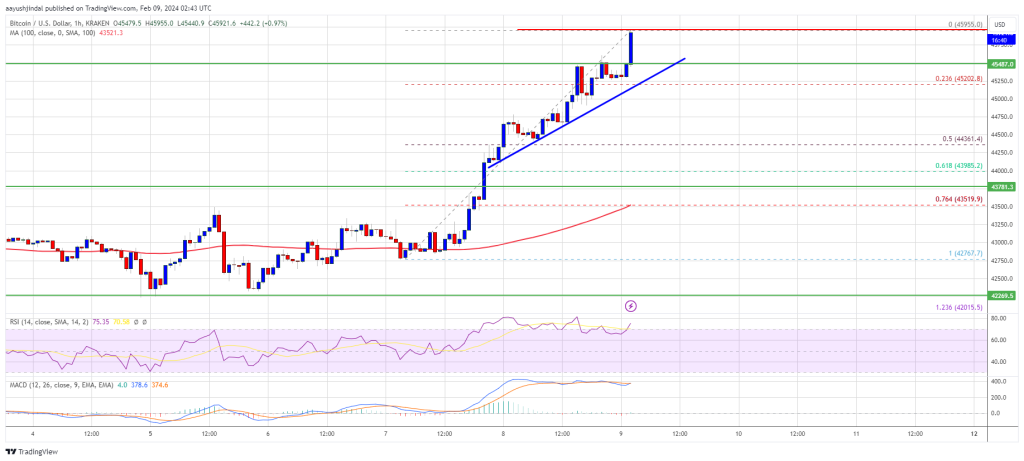
Source: BTCUSD on TradingView.com
The next stop for the bulls may perhaps be ,850. A clear move above the ,850 resistance could send the price toward the ,500 resistance. The next resistance could be near the ,000 level.
Downside Correction In BTC?
If Bitcoin fails to rise above the ,000 resistance zone, it could start a downside correction. Immediate support on the downside is near the ,500 level or the trend line.
The first major support is ,400 and the 50% Fib retracement level of the recent surge from the ,765 swing low to the ,955 high. If there is a close below ,400, the price could gain bearish momentum. In the stated case, the price could dive toward the ,500 support.
Technical indicators:
Hourly MACD – The MACD is now gaining pace in the bullish zone.
Hourly RSI (Relative Strength Index) – The RSI for BTC/USD is now above the 50 level.
Major Support Levels – ,500, followed by ,400.
Major Resistance Levels – ,000, ,200, and ,500.
Stablecoin Market Cap Climbs $4.85 Billion in 30 Days; USDT, USDC, FDUSD Spearhead Growth

In the past month, data reveals a significant increase in the combined market capitalization of leading stablecoins, rising from 1.71 billion to 6.56 billion. The top two stablecoins, tether and usd coin, experienced notable expansions in their supplies, with increases of 4.8% and 7.2% respectively.
Stablecoin Economy on the Rise
Over the last 30 days, the stablecoin market experienced a growth of approximately .85 billion, based on data spanning from Dec. 30, 2023, to Jan. 30, 2024. The top stablecoin by market capitalization, tether (USDT), witnessed a 4.8% increase in its supply, reaching .91 billion. Tether is now just 4.09 billion short of achieving a milestone of 100 billion tokens in circulation.
Circle’s usd coin (USDC) not only experienced a rise in supply, but its growth, at 7.2%, surpassed that of USDT in the past month. As the second-largest stablecoin by market cap, USDC now boasts a net worth of .50 billion, a climb from .71 billion just 30 days earlier. Following several months of redemptions, USDC has now observed two successive months of growth in token supply.
Over the last month, Maker’s stablecoin DAI experienced a slight decline, falling by 0.8%. Positioned as the third-largest stablecoin in terms of market valuation, the decentralized finance (defi) stablecoin, DAI, holds a market capitalization of .19 billion. Occupying the fourth spot among stablecoins, first digital usd (FDUSD) witnessed the most significant surge in supply, escalating by 42.8%. Currently, FDUSD’s market capitalization stands at .57 billion.
In fifth place is trueusd (TUSD), holding a market capitalization of approximately .47 billion. This past month, TUSD experienced a sharp decline in supply, diminishing by 30.6% over the course of 30 days. TUSD also had some stability issues with its intended dollar-peg this month dropping to the .97 range on Jan. 17 and Jan. 26, 2024.
Tron’s USDD experienced a modest increase of 1.1%, while the frax dollar (FRAX) recorded a slight decrease of 0.1%. In the past month, Paxos’ USDP witnessed a decline of 4.3%, whereas Paypal’s PYUSD achieved a notable rise of 13.6%. Meanwhile, the tenth-ranked stablecoin, alchemix usd (ALUSD), saw a decrease of 0.9%.
As we wrap up this month’s episode in the stablecoin saga, a vibrant clash of forces akin to those seen in 2023 has influenced most stablecoins beneath the top trio. USDT, USDC, and DAI have held their ground, while emerging players like FDUSD and PYUSD are ascending in the hierarchy. Meanwhile, former frontrunners such as BUSD and GUSD have dropped out of the top ten. This path, characterized by fluctuations and milestones, echoes the wider story of the evolving crypto economy.
What do you think about the stablecoin economy’s growth during the first month of 2024? Share your thoughts and opinions about this subject in the comments section below.