- ETH price found support near the 2 level and recently climbed higher against the US Dollar.
- The price is currently testing the 0 resistance and it could continue to rise towards 5.
- There is a connecting bullish trend line forming with support near 8 on the hourly chart of ETH/USD (data feed via Kraken).
- The pair is likely to revisit the main 5 resistance level, above which it could climb sharply.
Ethereum price is slowly climbing towards key resistances versus the US Dollar, but struggling vs bitcoin. ETH price might even clear the 5 resistance if the bulls remain in action.
Ethereum Price Analysis
Recently, Ethereum price corrected lower and tested the 2 support area against the US Dollar. The ETH/USD pair formed a swing low just above 1 and started a fresh increase. It traded above the 5 resistance to move into a positive zone. Moreover, there was a break above the 50% Fib retracement level of the last slide from the 5 high to 1 low.
The price is currently trading above the 8 level and the 100 hourly simple moving average. However, it seems to be facing a strong resistance near the 0 level. The 61.8% Fib retracement level of the last slide from the 5 high to 1 low is also near the 0 level. If there is an upside break above the 0 resistance, the price could accelerate higher in the near term.
The next main resistance is near the 5 level. The bulls might struggle to clear the 5-276 zone, but if they succeed, there could be sharp gains. The next stop for them could be 0 and 5.
On the downside, an immediate support is near the 8 level. Moreover, there is a connecting bullish trend line forming with support near 8 on the hourly chart of ETH/USD. If the pair fails to stay above the trend line support, it could decline back towards the 5 support. The next key support is near the 2 area, below which there is a risk of a sharp decline below 0.
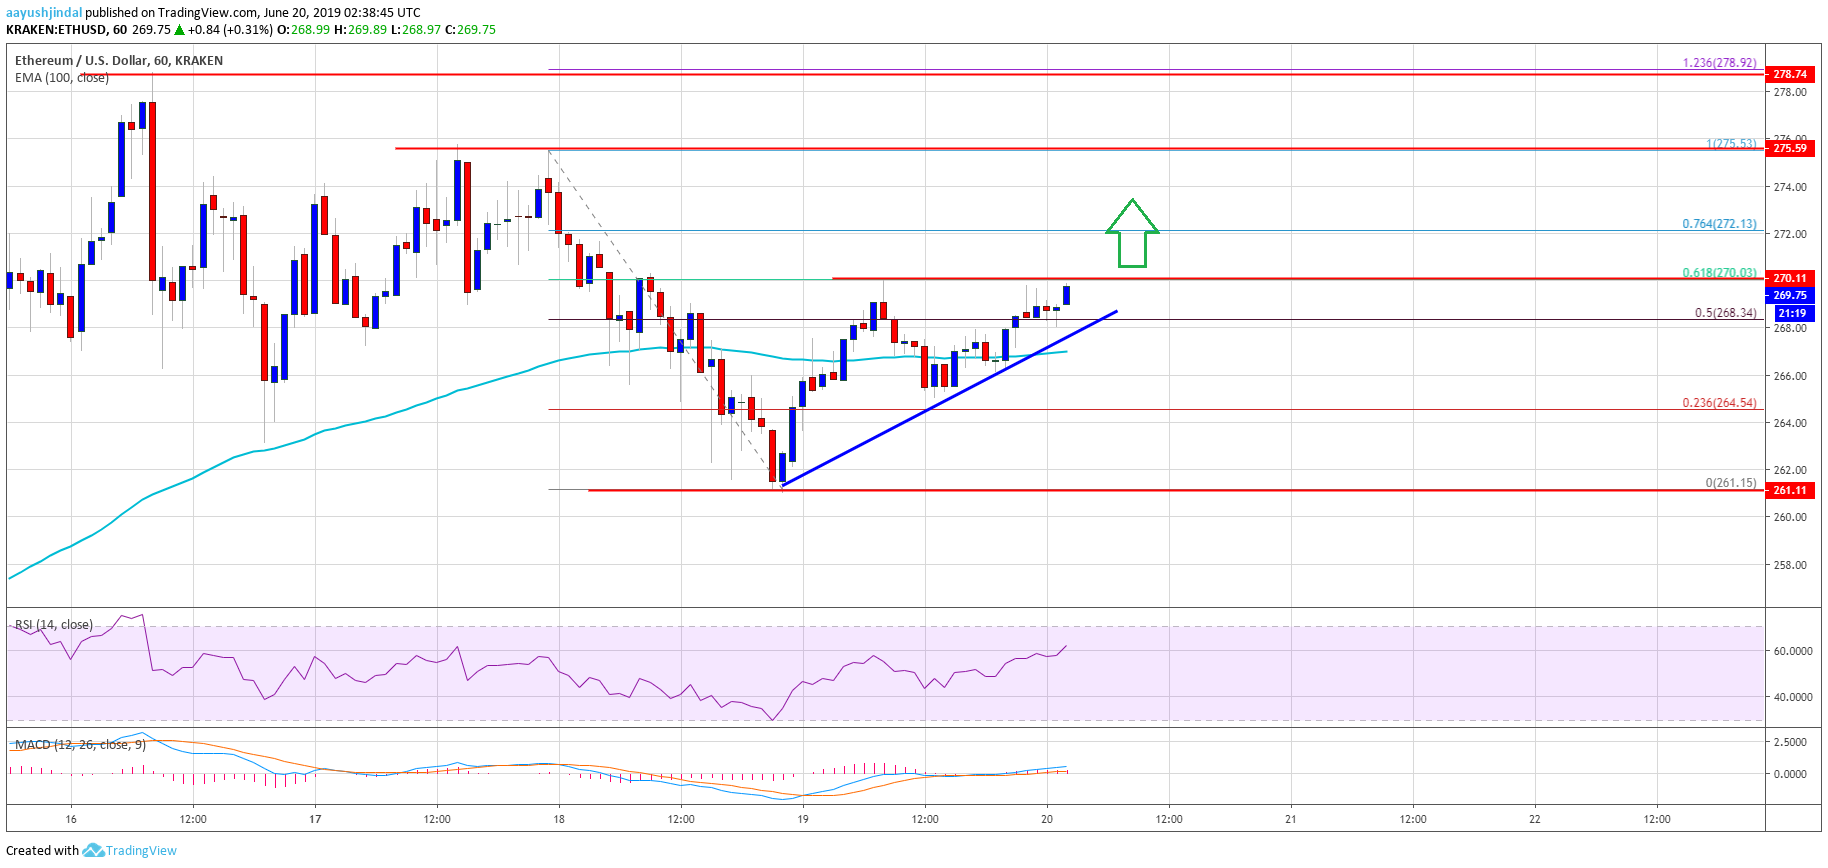
Looking at the chart, Ethereum price is clearly moving higher with a positive bias above 5 and 8. However, the price must clear the 0 resistance to revisit the 5 level. In the short term, there could be more range moves below 5 before the price makes the next move either above 5 or below 0.
ETH Technical Indicators
Hourly MACD – The MACD for ETH/USD is currently moving back in the bullish zone, with positive signs.
Hourly RSI – The RSI for ETH/USD is climbing sharply above the 55, with a bullish angle.
Major Support Level – 5
Major Resistance Level – 5
The post Ethereum (ETH) Price Climbing Higher: Can Bulls Break 5 This Time? appeared first on NewsBTC.


 (@Josh_Rager)
 market might not be over just yet.
 (@CryptoSays)