 The Defi Education Fund, an organization focused on defending and bringing clarity to decentralized finance, pondered on what the recent overruling of the so-called Chevron doctrine might mean for crypto. The organization explained that this decision marks a new chapter in the battle for clearer regulations in the crypto environment, putting Congress at the forefront […]
Bitcoin News
Coinbase CEO Engages US Senators to Push Clear Crypto Regulations
 Coinbase CEO Brian Armstrong said on Wednesday that he engaged with over a dozen senators from both Democratic and Republican parties in Washington, D.C., over the past 48 hours. The discussions focused on establishing clear regulations for the cryptocurrency industry and enhancing consumer protections. Armstrong highlighted substantial bipartisan support in the Senate for these efforts, […]
Bitcoin News
Ripple Teams Up With Clear Junction for GBP and EUR Payouts
Ripple has partnered with Clear Junction, a global leader in cross-border payment solutions for regulated institutions, to enhance cross-border payments, enabling instant and secure GBP and EUR payouts, with more currencies to follow. Ripple Payments provides faster, cheaper cross-border payment infrastructure, serving customers in over 55 countries. Clear Junction, established in 2016, offers multi-currency payment […]
Bitcoin News
Coinbase Challenges SEC’s Rulemaking Process, Argues for Clear Regulations on Digital Assets
 Coinbase, Inc. has escalated its dispute with the Securities and Exchange Commission (SEC) by filing a reply brief in the Third Circuit Court of Appeals, arguing the necessity of clear rulemaking for the digital asset industry. The case underscores the ongoing tensions between regulators and the digital asset sector over compliance and operational standards. Coinbase […]
Bitcoin News
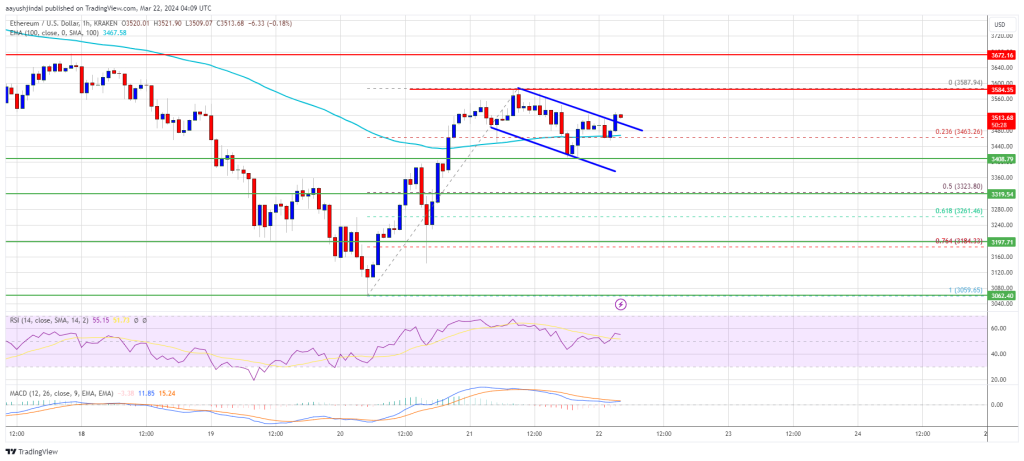
Ethereum Price Reclaims 100 SMA But Bulls Still Lack Strength To Clear Hurdles
Ethereum price started a recovery wave above the ,000 zone. ETH is now above the 100-hourly simple moving average and facing hurdles.
- Ethereum found support at ,820 and started a recovery wave.
- The price is trading above ,100 and the 100-hourly Simple Moving Average.
- There is a key bullish trend line forming with support at ,110 on the hourly chart of ETH/USD (data feed via Kraken).
- The pair could gain bullish momentum if it clears the ,165 resistance zone.
Ethereum Price Holds Ground
Ethereum price remained stable and started a recovery wave above the ,000 level, like Bitcoin. ETH was able to clear the ,050 and ,120 resistance levels.
However, the bears were active near the ,165 resistance zone. A high was formed at ,168 and the price started a downside correction. There was a minor move below the ,150 level. The price is now stable above the 23.6% Fib retracement level of the upward move from the ,813 swing low to the ,168 high.
Ethereum is also above ,100 and the 100-hourly Simple Moving Average. Besides, there is a key bullish trend line forming with support at ,110 on the hourly chart of ETH/USD.
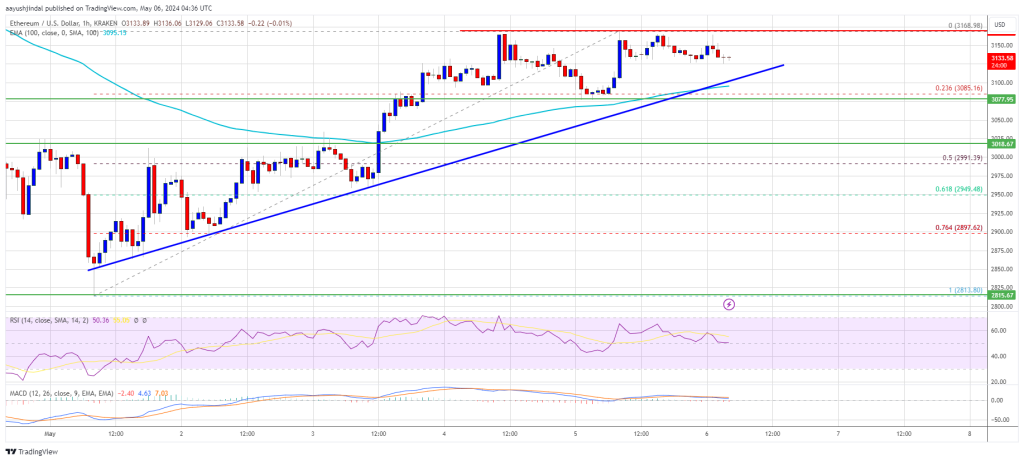
Source: ETHUSD on TradingView.com
Immediate resistance is near the ,165 level. The first major resistance is near the ,200 level. The next key resistance sits at ,250, above which the price might gain traction and rise toward the ,350 level. If the bulls remain in action and push the price above ,350, there could be a drift toward the ,500 resistance. Any more gains could send Ether toward the ,620 resistance zone.
Another Decline In ETH?
If Ethereum fails to clear the ,165 resistance, it could start another decline. Initial support on the downside is near the ,100 level and the trend line. The first major support is near the ,000 zone or the 50% Fib retracement level of the upward move from the ,813 swing low to the ,168 high.
The main support is near the ,940 level. A clear move below the ,940 support might push the price toward ,820. Any more losses might send the price toward the ,650 level in the near term.
Technical Indicators
Hourly MACD – The MACD for ETH/USD is losing momentum in the bullish zone.
Hourly RSI – The RSI for ETH/USD is now above the 50 level.
Major Support Level – ,000
Major Resistance Level – ,165
Ethereum Price Holds Strong At $3K But Can Bulls Clear This Hurdle?
Ethereum price is consolidating near the ,000 zone. ETH could start a decent recovery wave if it clears the ,100 and ,200 resistance levels.
- Ethereum is struggling to recover above the ,100 resistance zone.
- The price is trading below ,120 and the 100-hourly Simple Moving Average.
- There is a major bearish trend line forming with resistance at ,035 on the hourly chart of ETH/USD (data feed via Kraken).
- The pair could start another decline if it stays below the ,100 resistance zone.
Ethereum Price Holds Ground
Ethereum price slowly moved lower after it failed to clear the ,200 resistance zone. ETH remained in a bearish zone below ,100 and showed bearish signs, like Bitcoin.
Recently, the bears were able to push the price below the ,000 support zone. However, the bulls were active near the 50% Fib retracement level of the upward wave from the ,535 swing low to the ,279 high. Ethereum is now trading below ,120 and the 100-hourly Simple Moving Average.
Immediate resistance is near the ,030 level. There is also a major bearish trend line forming with resistance at ,035 on the hourly chart of ETH/USD. The first major resistance is near the ,100 level and the 100-hourly Simple Moving Average.
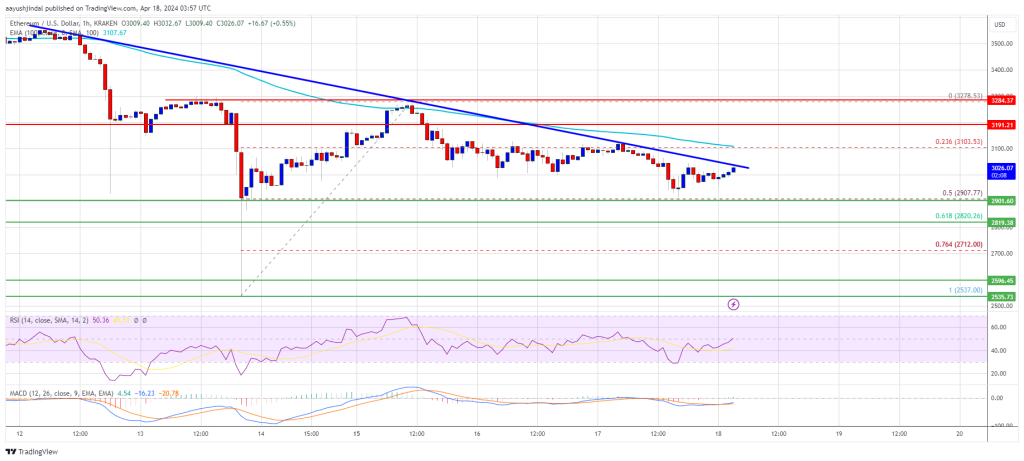
Source: ETHUSD on TradingView.com
The next key resistance sits at ,200, above which the price might rise toward the ,280 level. A close above the ,280 resistance could send the price toward the ,500 pivot level. If there is a move above the ,500 resistance, Ethereum could even climb toward the ,650 resistance in the coming sessions.
More Losses In ETH?
If Ethereum fails to clear the ,100 resistance, it could start another decline. Initial support on the downside is near the ,000 level. The first major support is near the ,900 zone.
The next key support could be the ,820 zone or the 61.8% Fib retracement level of the upward wave from the ,535 swing low to the ,279 high. A clear move below the ,820 support might send the price toward ,600. Any more losses might send the price toward the ,550 level in the near term.
Technical Indicators
Hourly MACD – The MACD for ETH/USD is gaining momentum in the bearish zone.
Hourly RSI – The RSI for ETH/USD is now below the 50 level.
Major Support Level – ,900
Major Resistance Level – ,100
Ethereum Price Faces Crucial Test, Can ETH Clear This Hurdle To Kickstart Rally?
Ethereum price is consolidating above the ,450 support zone. ETH must clear ,560 and ,620 to start a fresh increase in the near term.
- Ethereum is trading in a range above the ,450 support zone.
- The price is trading above ,500 and the 100-hourly Simple Moving Average.
- There is a new connecting bearish trend line forming with resistance at ,550 on the hourly chart of ETH/USD (data feed via Kraken).
- The pair could gain bullish momentum if it stays above the ,420 support zone.
Ethereum Price Eyes Upside Break
Ethereum price attempted another increase above the ,550 resistance. ETH even climbed above ,600, but the upsides were limited like Bitcoin. A high was formed at ,614 before the price trimmed gains.
It declined below ,500 and treaded as low as ,476. The price is again recovering and moving above ,500. There was a move above the 23.6% Fib retracement level of the recent decline from the ,614 swing high to the ,476 low.
Ethereum is now trading above ,500 and the 100-hourly Simple Moving Average. Immediate resistance is near the ,550 level or the 50% Fib retracement level of the recent decline from the ,614 swing high to the ,476 low. There is also a new connecting bearish trend line forming with resistance at ,550 on the hourly chart of ETH/USD.
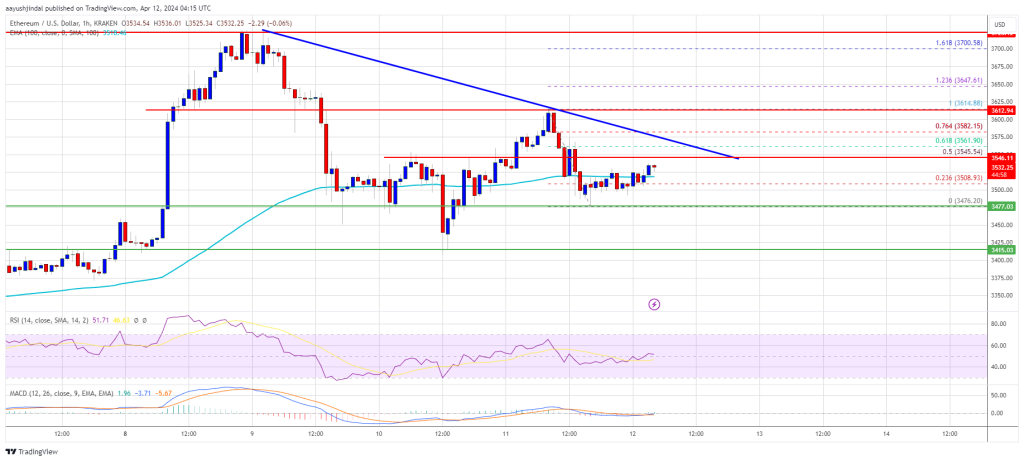
Source: ETHUSD on TradingView.com
The first major resistance is near the ,620 level. The next key resistance sits at ,650, above which the price might test the ,720 level. The key hurdle could be ,750, above which Ether could gain bullish momentum. In the stated case, the price could rise toward the ,820 zone. If there is a move above the ,820 resistance, Ethereum could even rise toward the ,000 resistance.
Another Rejection In ETH?
If Ethereum fails to clear the ,550 resistance, it could start another decline. Initial support on the downside is near the ,500 level.
The first major support is near the ,475 zone. The next key support could be the ,420 zone. A clear move below the ,420 support might send the price toward ,320. Any more losses might send the price toward the ,240 level.
Technical Indicators
Hourly MACD – The MACD for ETH/USD is losing momentum in the bearish zone.
Hourly RSI – The RSI for ETH/USD is now above the 50 level.
Major Support Level – ,475
Major Resistance Level – ,550
Bitcoin Price Primed To Clear $71,500 and Rally Again
Bitcoin price is again rising above the ,000 resistance zone. BTC seems to be setting up for a steady increase above the ,500 resistance zone.
- Bitcoin price is climbing higher and above the ,000 resistance zone.
- The price is trading above ,500 and the 100 hourly Simple moving average.
- There is a crucial bullish trend line forming with support at ,200 on the hourly chart of the BTC/USD pair (data feed from Kraken).
- The pair could soon start a fresh rally if it clears the ,500 resistance zone.
Bitcoin Price Regains Strength
Bitcoin price remained well-supported above the ,000 resistance zone. BTC climbed higher the ,000 resistance zone to move again into a positive zone.
The price broke the ,000 level and retested ,500. A high was formed near ,539 and there was a downside correction. There was a minor decline below the 23.6% Fib retracement level of the upward move from the ,468 swing low to the ,539 high.
Bitcoin is now trading above ,000 and the 100 hourly Simple moving average. There is also a crucial bullish trend line forming with support at ,200 on the hourly chart of the BTC/USD pair.
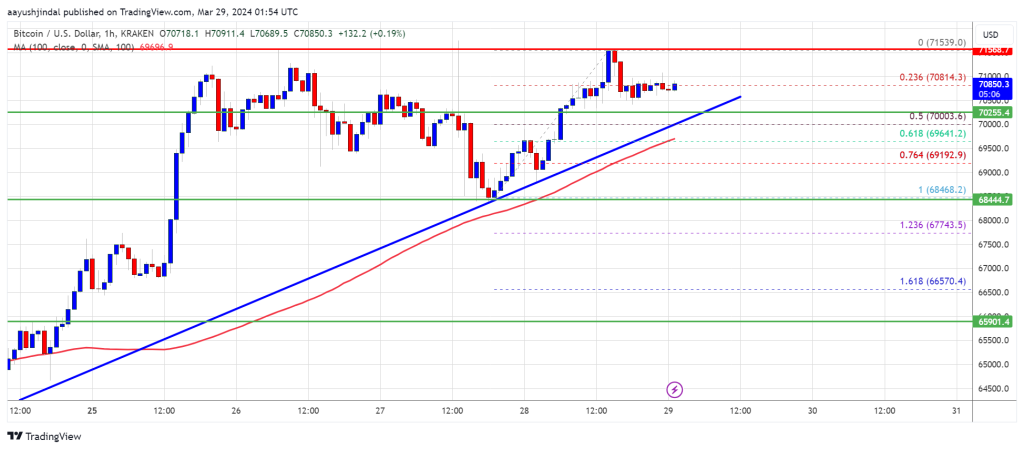
Source: BTCUSD on TradingView.com
Immediate resistance is near the ,200 level. The first major resistance could be ,500. If there is a clear move above the ,500 resistance zone, the price could start a strong increase. In the stated case, the price could even clear the ,500 resistance zone in the near term. The next major resistance is near the ,500 zone.
Another Decline In BTC?
If Bitcoin fails to rise above the ,500 resistance zone, it could start another decline. Immediate support on the downside is near the ,200 level and the trend line.
The first major support is ,000 and the 50% Fib retracement level of the upward move from the ,468 swing low to the ,539 high. The next support sits at ,200. If there is a close below ,200, the price could start a drop toward the ,000 level. Any more losses might send the price toward the ,500 support zone in the near term.
Technical indicators:
Hourly MACD – The MACD is now gaining pace in the bullish zone.
Hourly RSI (Relative Strength Index) – The RSI for BTC/USD is now above the 50 level.
Major Support Levels – ,200, followed by ,200.
Major Resistance Levels – ,200, ,500, and ,500.
Ethereum Price Signals Uptrend Continuation But Can Bulls Clear This?
Ethereum price is attempting a recovery wave above the ,500 zone. ETH must clear the ,580 resistance to continue higher in the near term.
- Ethereum started a decent recovery wave above the ,350 zone.
- The price is trading above ,450 and the 100-hourly Simple Moving Average.
- There was a break above a short-term bullish flag pattern with resistance at ,480 on the hourly chart of ETH/USD (data feed via Kraken).
- The pair could continue to rise if it settles above the ,580 resistance zone.
Ethereum Price Holds Support
Ethereum price started a decent upward move above the ,250 and ,350 resistance levels, like Bitcoin. ETH even surpassed the ,500 resistance to move into a positive zone.
A high was formed at ,587 and there was a minor pullback. The price declined below the ,500 level and spiked below the 23.6% Fib retracement level of the recovery wave from the ,059 swing low to the ,587 high. However, the bulls are active near ,400.
Recently, there was a break above a short-term bullish flag pattern with resistance at ,480 on the hourly chart of ETH/USD. Ethereum price is now trading above ,500 and the 100-hourly Simple Moving Average.
Source: ETHUSD on TradingView.com
On the upside, immediate resistance is near the ,550 level. The first major resistance is near the ,580 level. The next key resistance sits at ,670, above which the price might gain bullish momentum. In the stated case, Ether could rally toward the ,800 level. If there is a move above the ,800 resistance, Ethereum could even climb toward the ,000 resistance. Any more gains might call for a test of ,080.
Another Decline In ETH?
If Ethereum fails to clear the ,580 resistance, it could start another decline. Initial support on the downside is near the ,410 level.
The first major support is near the ,320 zone or the 50% Fib retracement level of the recovery wave from the ,059 swing low to the ,587 high. The next key support could be the ,200 zone. A clear move below the ,200 support might send the price toward ,060. Any more losses might send the price toward the ,000 level.
Technical Indicators
Hourly MACD – The MACD for ETH/USD is gaining momentum in the bullish zone.
Hourly RSI – The RSI for ETH/USD is now above the 50 level.
Major Support Level – ,400
Major Resistance Level – ,580
Dogecoin Price Holds Crucial Support But Can DOGE Clear This Hurdle?
Dogecoin is recovering higher from .1220 against the US Dollar. DOGE must clear the .1650 resistance to start another increase toward .200.
- DOGE declined heavily and tested the .1220 support against the US dollar.
- The price is trading below the .1650 level and the 100 simple moving average (4 hours).
- There was a break above a key bearish trend line with resistance at .1310 on the 4-hour chart of the DOGE/USD pair (data source from Kraken).
- The price could gain bullish momentum if it clears the .1600 and .1650 resistance levels.
Dogecoin Price Recovers Over 15%
After a strong decline, Dogecoin price found support near the .1220 zone. A low was formed at .1228 and DOGE recently started a decent recovery wave, like Bitcoin and Ethereum.
There was a steady increase above the .1320 and .1350 resistance levels. The price cleared the 23.6% Fib retracement level of the downward move from the .1927 swing high to the .1228 low. There was also a break above a key bearish trend line with resistance at .1310 on the 4-hour chart of the DOGE/USD pair.
Dogecoin is still trading below the .160 level and the 100 simple moving average (4 hours). On the upside, the price is facing resistance near the .1580 level or the 50% Fib retracement level of the downward move from the .1927 swing high to the .1228 low.
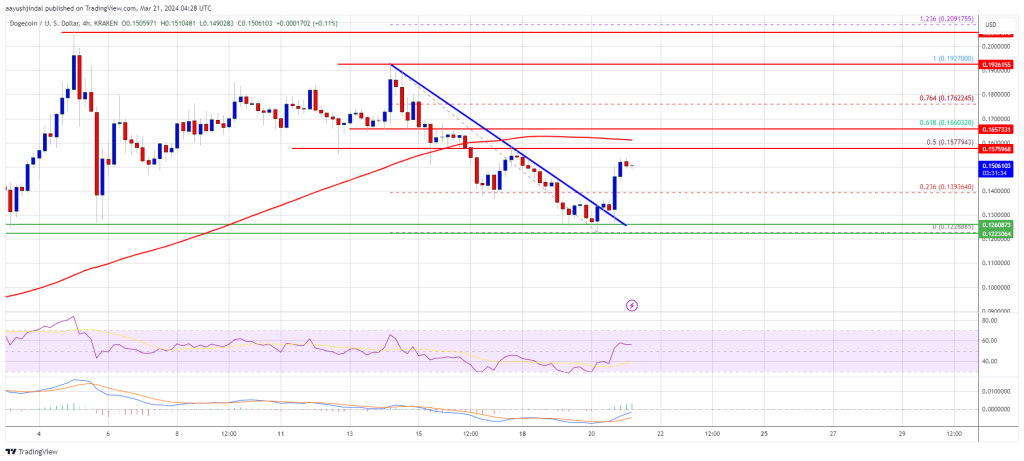
Source: DOGEUSD on TradingView.com
The next major resistance is near the .1650 level. A close above the .1650 resistance might send the price toward the .1850 resistance. The next major resistance is near .200. Any more gains might send the price toward the .220 level.
Another Decline in DOGE?
If DOGE’s price fails to gain pace above the .160 level, it could start another decline. Initial support on the downside is near the .1450 level.
The next major support is near the .130 level. If there is a downside break below the .130 support, the price could decline further. In the stated case, the price might decline toward the .1150 level.
Technical Indicators
4 Hours MACD – The MACD for DOGE/USD is now gaining momentum in the bullish zone.
4 Hours RSI (Relative Strength Index) – The RSI for DOGE/USD is now above the 50 level.
Major Support Levels – .1450, .130 and .1150.
Major Resistance Levels – .1580, .160, and .1650.