 According to the minutes from the Federal Reserve’s Federal Open Market Committee (FOMC), the choice to maintain the federal funds rate in its current range was driven by concerns about ongoing inflation and economic instability. Economic Instability and Inflation Keep Fed Rates Steady At the June 11-12 meeting, the FOMC highlighted that although inflation has […]
Bitcoin News
QCP Capital Cites ‘Lack of News Flow’ for Bitcoin’s Price Decline Amid Market Doldrums
 On Wednesday at 11 a.m. EDT, bitcoin hovered just around the ,000 mark. QCP Capital published its market commentary, attributing the downturn in the crypto economy to a lack of news flow and stagnant markets. In such a market, with minimal positive news to spur buying, existing crypto holders may lose confidence and patience. Crypto […]
Bitcoin News
Bitcoin Braces For 10-20% Crash, Top Analyst Cites 90% Chance Of Pullback
Bitcoin (BTC), the largest cryptocurrency on the market, has again taken the lead in the crypto landscape. However, this time it comes with a sense of caution among investors triggered by macroeconomic data, particularly from the United States.
In addition, the resulting outflows of over 0 million from the primary market of the digital asset ecosystem, as reported by asset manager CoinShares, have raised concerns about potential price corrections shortly.
Against this backdrop, renowned analysts and technical experts have weighed in to share their insights and predictions on Bitcoin’s future trajectory.
Crypto Experts Warn Of Looming Bitcoin Correction
Crypto analyst Timothy Peterson, in a social media post on X (formerly Twitter), highlights Bitcoin’s substantial 65% rise over the past six months. However, based on ten years of historical data, Peterson suggests a 90% probability that BTC will experience a 10-20% decline in the next 90 days, taking the BTC price below the key ,000 threshold.
On a more optimistic note, Peterson noted that there is also a two-thirds chance that Bitcoin will finish the next three months with a 50% increase. This projection places the median Bitcoin price path at ,000, followed by ,000, and potentially reaching ,000 by October.
Supporting these predictions, technical analyst Rekt Capital points out that Bitcoin tends to form clusters of price action near the resistance range high above ,600. Historical patterns indicate that these clusters often precede downside moves, leading to lower levels within the range.
In line with Peterson’s analysis, this correction could potentially take Bitcoin’s price down to around ,000, similar to the previous correction observed after its all-time high of ,700 in March.
BTC’s Post-Halving Trajectory On Track?
Rekt Capital further emphasizes that Bitcoin trades within its normal re-accumulation box following the Halving event. This re-accumulation phase typically begins a few weeks before the Halving and concludes with a breakout months afterward.
The analyst further shared that the current Re-Accumulation Range for Bitcoin is estimated to be between ,000 and ,000, with price fluctuations within this range. This phase aims to stabilize Bitcoin’s price, preparing it for the next cycle phase—the “Parabolic Phase.”
Rekt Capital suggests that the Re-Accumulation phase can last several months, potentially up to 150 days. Upon breaking out of the re-accumulation area, Bitcoin enters a parabolic uptrend characterized by accelerated growth.
Considering the timeline, the market is now two months after the Bitcoin Halving and the current price action aligns with previous 60-day post-Halving periods.
In summary, considering the scenarios presented by the analysts, BTC is anticipated to remain within its established range, possibly experiencing deeper corrections before embarking on an upward trajectory toward further price appreciation and the potential to reach new all-time highs.
At the time of writing, BTC has exhibited a recovery in the past hour, witnessing an upward spike after hitting a Monday low of ,000. Presently, it is trading at ,800.
Featured image from DALL-E, chart from TradingView.com
UNI In Trouble? Key Indicators Cites Potential Drop Amid Market Downturn
Uniswap (UNI), a prominent decentralized exchange token, is bracing for further declines as the broader cryptocurrency market experiences a significant downturn. Recent market trends indicate a continuation of bearish momentum, which has impacted UNI’s price negatively.
Several factors, including macroeconomic uncertainties, regulatory pressures, and shifts in investor sentiment, are contributing to this extended downtrend. As Uniswap’s price breaks key support levels, the likelihood of additional losses increases.
This article delves into UNI’s price analysis with the help of technical indicators to determine the anticipated decline and provide insights into what traders and investors might expect in the coming days.
The price of Uniswap has increased by 4.60%, trading at about .873 in the last 24 hours, with a market capitalization of more than .9 billion and a trading volume of more than 6 million as of the time of writing. UNI’s market cap and trading volume were also up by 4.28% and 19.98%, respectively.
UNI Builds Bearish Sentiment
On the 1-hour chart, UNI is attempting to move below the 100-day Simple Moving Average (SMA) as it has failed to move above the bearish trendline. It can be suggested here that Uniswap might go bearish.
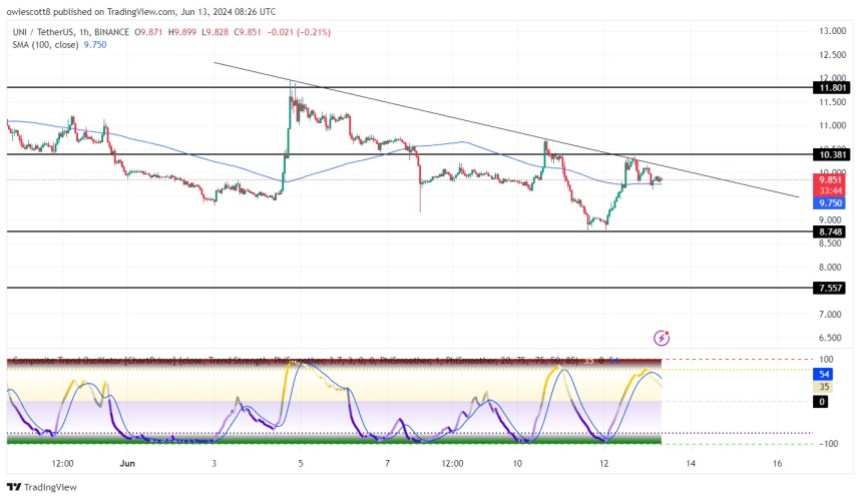
The 1-hour Composite Trend Oscillator also signals that the price of UNI might break below the 100-day SMA and go bearish as both the signal line and SMA crossed and are heading toward the zero line. From this Relative Strength Index (RSI) formation, it can be considered that UNI might go bearish if it moves below the 100-day SMA.
Meanwhile, in the 4-hour chart, UNI’s price trades below the trendline and the 100-day SMA. The price of UNI is also attempting to drop a bearish 4-hour candlestick.
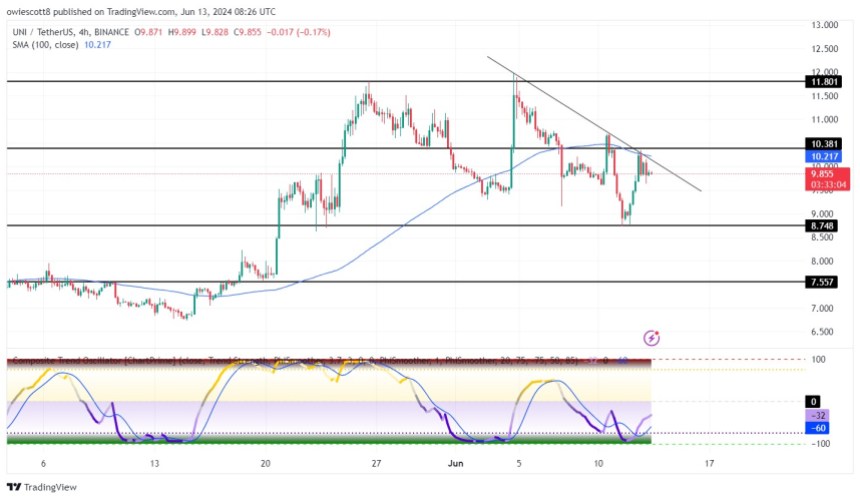
Although the 4-hour composite trend oscillator indicates that UNI may go bullish, the price will certainly move upward on a short-term note and begin to decline again. The signal line and SMA line are heading toward the zero line, but this has continued for a while.
Support Levels To Watch Out For
If the price of UNI drops below the 1-hour 100-day simple moving average, it will begin to move towards the .748 support level. It may even decline more to test the .557 support level if it breaks below the abovementioned level.
However, if Uniswap were to change course at any of the previously mentioned support levels, it would begin to rise toward the resistance level of .381. If the price breaches this resistance level, it might be poised to test the .801 mark and perhaps much higher to test other levels.
Bullish Bitcoin: Expert Cites $123,832 Target Based On Past Trends
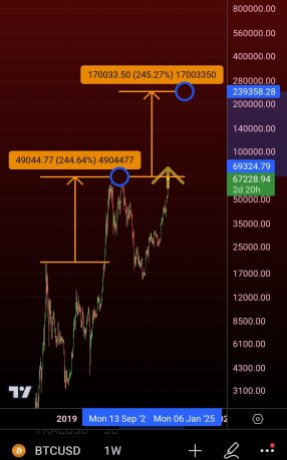
Amidst positive sentiment surrounding the cryptocurrency market, well-known crypto analyst and enthusiast Crypto Con has offered a bullish overview of Bitcoin by identifying historical patterns that indicate that the price of BTC might rise to 3,832 in the upcoming months.
By analyzing past market behavior and trends, the expert has discovered crucial indicators that suggest Bitcoin’s potential to outperform previous highs and reach unprecedented heights.
Most Accurate Bitcoin Price Bands
Crypto Con’s analysis delves into Bitcoin’s current behavior based on its price bands at several levels, particularly 3 levels, as shown in his chart. According to the analyst, level 3 is currently one of the most precise bands for the crypto asset, which is valued at ,539. The expert noted that even with consolidation at level 2.5, the repercussions of this development are already becoming apparent. As a result, the major goal for BTC is reaching the level 3 price band.
Related Reading: Bitcoin Price Aims Higher: Bullish Trend Signals New Peaks Ahead
Furthermore, he underscored there has never been a cycle in which the top band of the cycle is not precisely touched, which is valued at 3,832, and this is currently witnessing an increase. Thus, at the conclusion of the Bitcoin parabola, the cycle top band will have its biggest growth.
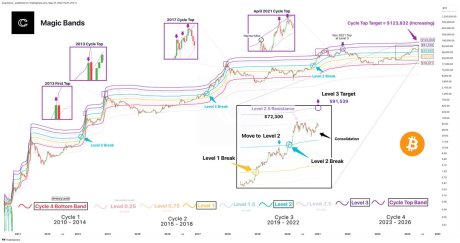
A further dive into BTC’s cycle top, Crypto Con has managed to pinpoint the past 2 accurate cycle tops, by employing basic indicators. Specifically, the bottom of the first early top (a yellow dot identified in his chart) in Green Year is when these patterns start.
The lowest points of the trend that have been retested the most often are used by these patterns. However, Bitcoin recently reached the cycle’s line at the ,000 price level, which is the problem.
With BTC reaching a new all-time high a year ahead of schedule, it has created an unnatural collision with the trend. Due to this, the expert believes that the line this cycle based on BTC’s fast price action will not rule this cycle peak.
So far, Crypto Con claims there will be unprecedented price movement, which will trigger some cycle top measures to break. However, it is still beneficial to pay attention to past trends in order to determine BTC’s price action.
BTC Poised For 6-Figure Price Target
As Bitcoin continues to display resilience, macro strategist Henrik Zeberg has also forecasted a 6-figure target for the digital assets in the coming months. Zeberg claims that the crypto asset is already preparing to enter an upward trend that began on May 20.
As a result, Zeberg anticipates an over 64% increase by the third of this year, putting his target between 0,000 and 5,000. According to the expert, a pattern of highs and lows will serve as a catalyst for the aforementioned price levels.
XRP To Hit Zero Against BTC? Veteran Trader Cites ‘Pure Classical Charting’
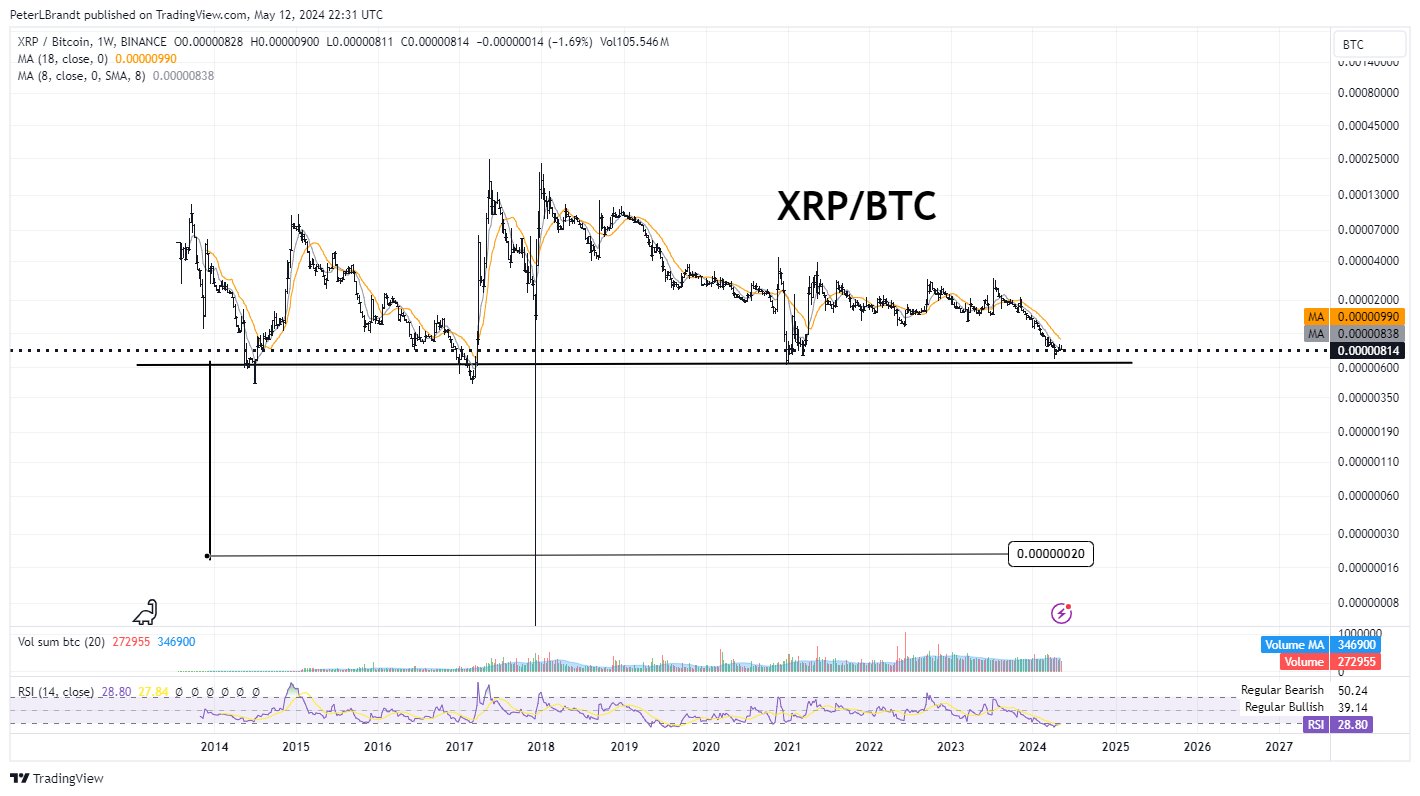
In a recent analysis shared via X, Peter Brandt, regarded as one of the leading experts globally in applying classical charting techniques to trading futures, foreign exchange, and crypto markets, suggested that the XRP to Bitcoin (XRP/BTC) exchange rate could potentially hit zero. Brandt’s analysis applies traditional techniques inspired by pioneers such as Schabacker, Edwards, and Magee to forecast this drastic trend.
Brandt stated, “From a pure classical charting point of view (that is, Schabacker, Edwards, Magee) this chart looks like it is headed toward Zero. XRPBTC”
Why Brandt Thinks XRP Is Going To Zero Vs. BTC
The chart indicates a troubling trajectory for XRP when priced in Bitcoin, with key support levels being consistently tested over time. The weekly chart showcases a series of peaks and troughs with notable highs in 2017 and a sharp decline from 2018 onwards.
Recently, the XRP/BTC ratio has been hovering around a crucial support line, illustrated by a dashed horizontal line on the chart. Notably, the chart shows XRP/BTC experiencing significant volatility over the years. After reaching highs in 2017 at 0.00025 BTC, it has been on a general downtrend, especially notable after September 2018. “XRPPBTC has lost 70% of its value since the Nov 2017 post,” Brandt commented.
A critical historical support level for the digital asset is highlighted by Brandt at around 0.000007 BTC (black line), which the market is currently testing. The continuation of the bearish trend might break this support.
Moreover, two moving averages are depicted on the chart. The 8-week SMA (Simple Moving Average) is currently at 0.00000838 BTC, while the 18-week SMA stands at 0.00000990 BTC, indicating bearish momentum as the price is below both averages.
The Relative Strength Index (RSI) on the chart, with a 14-week period, is at 28.80, which is near the oversold territory. This might usually suggest a potential for price recovery, yet the persistent bearish sentiment depicted suggests caution.
Peter Brandt’s assertion that the XRP/BTC ratio could be “headed toward Zero” comes from observing the continued failure of the price to rebound from key support levels and the downtrend remaining intact without signs of reversal. His commentary reflects a stark outlook for XRP when compared against Bitcoin, emphasizing the importance of these technical levels in predicting future movements.
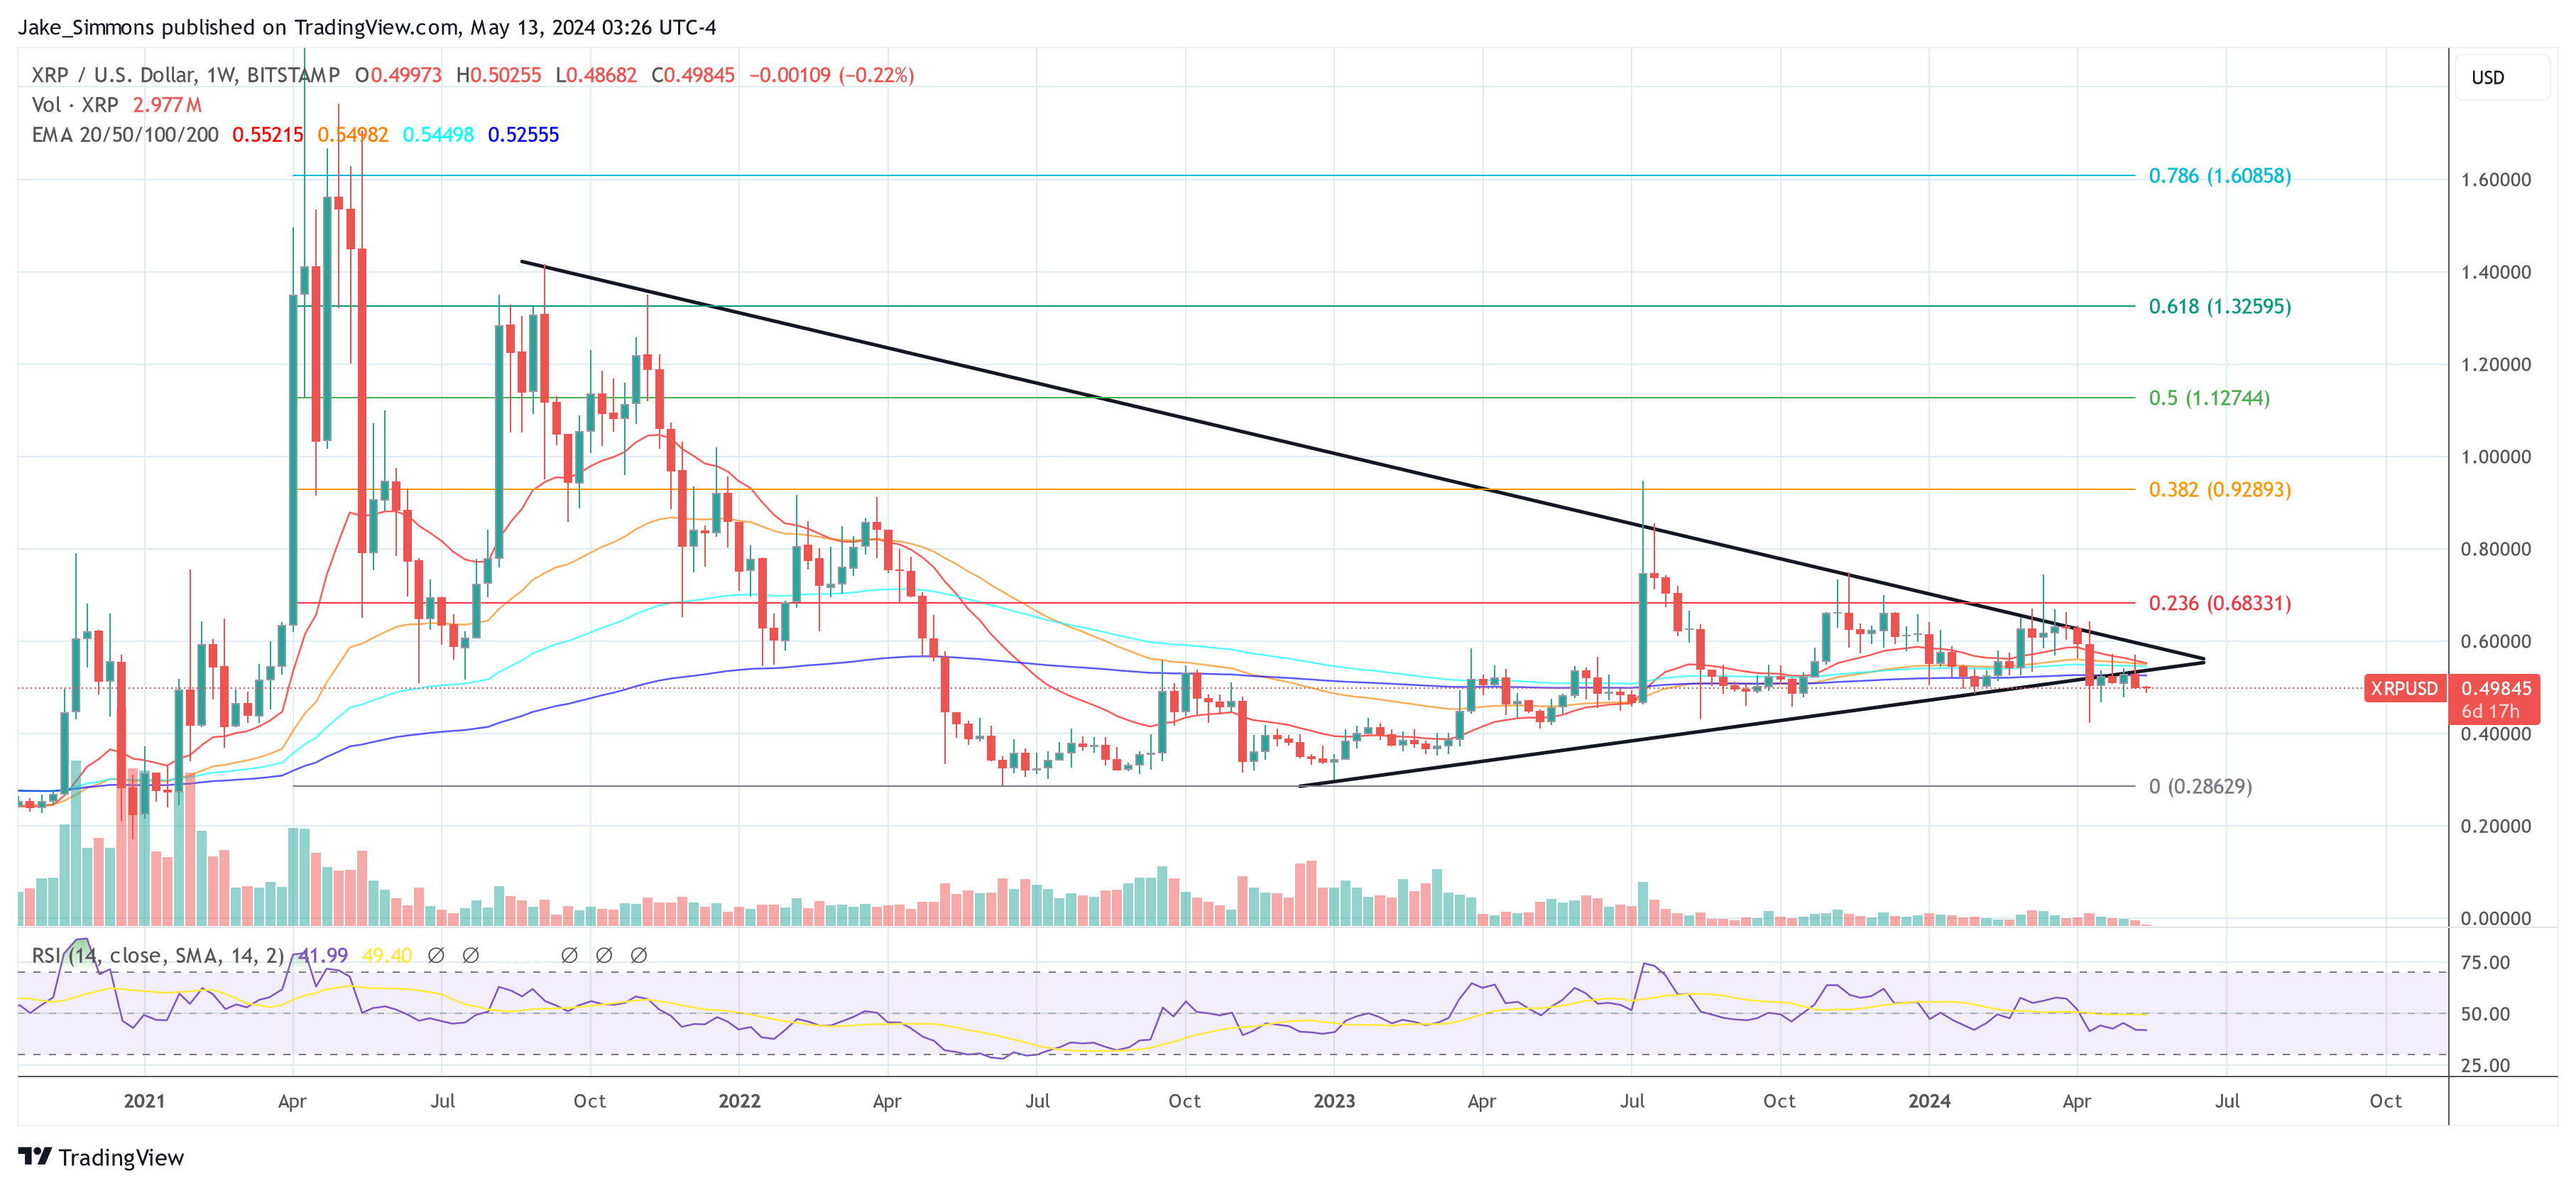
In a follow-up post on X, Brandt doubled down on this claim, stating, “It is actually fun poking a stick at XRP_aholics. My comparison is to BTC, not USD, so here is what I don’t understand. How can XRP bulls be so insistent in that XRP is near ATLs vs BTC, and, in fact, has only closed higher than present levels in 6 of the last 126 months?”
At press time, XRP traded at .49845.
Bitget Cites High Adoption Rates in MENA Following 1,400% Surge in Region’s Active Users
 Between November 2023 and April 10, the number of active cryptocurrency users from the Middle East and North Africa using the Bitget platform grew by more than 1,400%. Bitget’s strong performance in the Middle East and North Africa is attributed to the region’s perceived high adoption rates and the generally friendly landscape for cryptocurrencies. Support […]
Bitcoin News
Analyst Cites Favorable Market Trends That Could See Bitcoin Touch $300,000 This Cycle
Amid the renewed strength recently displayed by Bitcoin, Michael Van De Poppe, a recognized cryptocurrency analyst and trader has offered an intriguing prediction for BTC, highlighting that the crypto asset is likely to reach the 0,000 threshold in this bull cycle.
Bitcoin Price Targetted At Unprecedented Heights This Cycle
Over the past month, the price of Bitcoin has been consolidating and hasn’t been able to sustain its rise beyond its new peak of ,000. However, things could soon be changing, as Michael Van De Poppe expects the coin to surge immensely in the short term.
His forecast coincides with anticipation around the upcoming Bitcoin Halving expected to take place in less than 12 days, fueling optimism within the crypto community.
According to the expert, the largest cryptocurrency asset by market cap is still experiencing significant resistance. Nonetheless, if Bitcoin manages to break out of this zone, the coin could witness a progression towards new all-time highs in the coming months.
Given that BTC achieved the ,000 price level ahead of the halving event, Poppe believes that it is likely to surge to unprecedented levels, particularly topping out at 0,000 in this bull run.
The post read:
Bitcoin still facing crucial resistance. If this breaks, then we will be seeing a continuation towards new all-time highs. Bitcoin at ,000 pre-halving. Likely 0,000 this cycle.
Poppe underscored that the price of Bitcoin returned to ,000 level over the weekend. As a result, he has pointed out bullish indicators that are presently occurring in the crypto landscape.
The analyst also noted that the strength of the cryptocurrency markets has now exceeded our perceptions, and dips in altcoins represent opportunities for good entries. In addition, BTC’s price action demonstrates the potential to reach a new all-time high pre-halving, and the shift in favor of altcoins is on the horizon.
Altcoin Season Set To Kick Off In Weeks
Poppe is super bullish toward an ‘altcoin season’. However, it is important to note that altcoins’ value has frequently coincided with shifts in Bitcoin’s supremacy. But even though Bitcoin’s dominance is still at its peak prior to the halving, Poppe thinks these coins still have a lot of momentum.
He advocates that a new altcoin season will undoubtedly begin in the upcoming weeks. “We always have one, we have seen Meme coins, Solana (SOL) ecosystem, and AI,” he stated.
The expert’s statement suggests that the Solana ecosystem, AI projects, and meme coins in recent months have led the altcoin market. Thus, Michael Van De Poppe has contended that in the impending alt season, crypto initiatives that prioritize the tokenization of Real-World Assets (RWA), the Ethereum (ETH) ecosystem, and the Decentralized Physical Infrastructure Network (DePIN) are likely to be next, paving the way for alts this cycle.
At the time of writing, the altcoin’s overall market excluding Bitcoin and Ethereum was valued at 3.47 billion. This indicates a 2% increase in the market cap in the past 24 hours.
Bitcoin To $240,000: Analyst Cites Key Narrative As Catalyst
Bitcoin price has fallen by over 10% after briefly touching its all-time high of ,000, propelled by investors’ flood of money into BTC Spot Exchange-Traded Funds (ETFs).
However, intense volatility surrounding the crypto asset’s price has triggered a rebound to the ,000 mark, which highlights the return of positive enthusiasm, prompting predictions of a significant rally to an unprecedented height.
Key Narrative That Could Send Bitcoin To 0,000
Cryptocurrency analyst and trader Matthew Hyland has shared an optimistic forecast for Bitcoin with the community on the social media platform X. The analyst has identified a key trend that could trigger a bullish rally for BTC to the 0,000 threshold.
At first, Hyland noted that over the past two years, Bitcoin has “destroyed several narratives, both positive and negative.” These include one of the ideas that BTC will “never fall below the previous cycle low or reach its peak until after the halving event.”
However, Hyland claims that the only narrative left that BTC has not destroyed is the “Diminishing Returns,” as it is still almost 100% effective. Hyland is uncertain of the narrative’s effect but believes that it is the “final boss” since it is the only one still standing.
As a result of the trend, the crypto expert has set his price target at 0,000 in the upcoming months. This simply means BTC needs to surpass the aforementioned price in order to be able to demolish the diminishing returns narrative.
Hyland claims it makes no difference to him if Bitcoin “reaches the level or not.” Nonetheless, it will be “intriguing” to observe whether it can smash the one trend that remains intact.
Another expert known as Crypto Signals seems to agree with Hyland, expressing his pleasure in the analysis. According to Crypto Signals, in the context of Bitcoin, “the idea of diminishing returns is a fascinating one.”
Crypto Signals claims that every cycle tends to “produce a declining percentage gain as the market matures.” Due to this, there is a more profound development and broader adoption in the market. Thus, in the constantly changing world of cryptocurrencies, the narrative is worth looking into.
Strategic Timeframe For BTC Pre-Halving Rally
Rekt Capital, a well-known crypto expert, has pinpointed a timeframe for when and where the Bitcoin Pre-Halving rally will end. According to Rekt Capital, the “pre-halving rally is gradually approaching its end.”
Related Reading: Bitcoin Halving Prep: Analyst Outlines Key Points Ahead Of Event
Drawing a comparison to 2020’s pre-halving rise, the analyst stated that it occurred two weeks before the event. After that, BTC witnessed a “pre-halving retrace” of about 20%, which was the last it saw before the halving.
He further drew a comparison to 2016’s pre-halving surge, which he noted took place “28 days prior to the halving.” Nevertheless, it also experienced “a conservative correction” of over 29% after the rally topped.
Rekt Capital has marked the point as the “historic danger zone” that could potentially conclude the pre-halving rally this year, before witnessing a pullback ahead of the event.
Analyst Cites Key Indicators That Signal Bitcoin Correction
The price of Bitcoin witnessed a pullback on Tuesday amid a general bearish sentiment around the crypto market, after the digital asset reached the ,000 threshold.
Bitcoin Might Undergo Further Correction
Following the correction, several predictions of a further decline in the price of Bitcoin from top crypto analysts have surfassed. Cryptocurrency analyst and trader Ali Martinez has highlighted a few indicators that suggest a continuous retracement in price.
Martinez took to the social media platform X (formerly Twitter) to share his projections with the crypto community. According to Ali Martinez, on the daily chart of Bitcoin, the Tom DeMark (TD) Sequential indicator presently “flashed a sell signal.”
The crypto analyst believes that this development deserves to be closely monitored. This is because the indicator “boasts a solid history of predicting Bitcoin trends” since the beginning of the year.
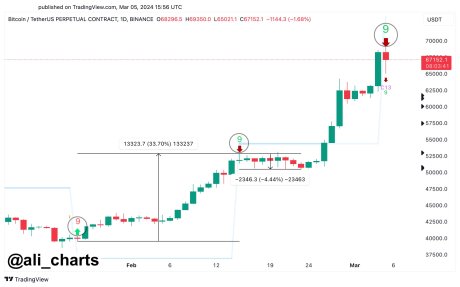
He further pointed out that the indicator suggested a buy signal earlier in January, which was followed by a 34% rise in Bitcoin’s price. In addition, in the middle of last month, the indicator also suggested a sell signal, after which Bitcoin plummeted by over 4%.
With the TD Sequential presently developing a sell signal, BTC might be poised to undergo a correction in the short term. However, there is no guarantee that the price of BTC will see a correction following the signal.
Martinez also underscored the accuracy of the pointer in predicting BTC’s price movement, which he believes to be “remarkably insane.” In a previous projection, Martinez asserted that BTC has declined by “1.5% to 4.7%, each time the indicator recommends a selling” since February 15.
As a result, short-term traders should carefully observe the trend in order to position themselves for future gains. So far, some market watchers feel that Bitcoin’s retracement was necessary, and they perceive the fall as a positive move.
BTC Could See A 20% Drop This Time Around
Martinez is not the only expert that has predicted a pullback in the short term. Crypto Jelle has also shared his negative forecast for BTC, pointing to a 20% price correction.
Jelle noted as BTC moves towards its all-time high of ,000, “there will be downturns along the way.” He further stated that this “time around,” it seems BTC might decline by 20%.
Thus, the crypto analyst has urged not to be shaken by the outcome while telling them to “take advantage” of the development when it occurs. This is because Jelle believes that the key to making it in the crypto space is patience.
Currently, the price of Bitcoin is down by over 2% in the last 24 hours, trading slightly above ,000. Despite the price drop, its trading volume is up by over 37%, while its market cap is down by 2%.