 Bitcoin’s price oscillation between ,182 and ,199 within 24 hours underscores a battlefield where bulls and bears vie for dominance. Bitcoin Bitcoin’s 1-day chart reveals a narrative of volatility, with the asset’s price making significant leaps and bounds. This volatility is encapsulated by long wick candles, highlighting the intense tug-of-war between buyers pushing upwards and […]
Bitcoin News
Bitcoin Technical Analysis: BTC Navigates Choppy Waters and Uncertainty

As bitcoin trades between ,850 to ,075, investors are eyeing several charts, oscillators, and moving averages for clues about the leading crypto asset’s next move. Oscillators signal neutrality, while moving averages paint a mixed picture, indicating a critical juncture for the cryptocurrency.
Bitcoin
On the 4-hour chart, bitcoin’s (BTC) trajectory shows a downtrend, marked by consistent lower highs and lower lows. A significant drop is notable, where the price plummeted from approximately ,440 to ,513. This pattern is underpinned by increased selling pressure, as evidenced by significant volume during downward movements. The formation of the current bearish candlestick formation further suggests the possibility of the downtrend persisting.
In contrast, the daily chart offers a different perspective, previously highlighting a bullish run where prices escalated from around ,378 to ,729. However, this trend has recently inverted, now characterized by a sequence of downturns. The intensified selling volume on these down days could be indicative of a strong bearish sentiment in the market, possibly forecasting further declines.
Oscillator readings present a more neutral stance. The relative strength index (RSI) at 52, Stochastic at 33, and the commodity channel index (CCI) at -27 all hover in the neutral range. The average directional index (ADI) at 37 and the awesome oscillator at 2230 also maintain this neutrality. However, the momentum indicator at -3227 and the moving average convergence/divergence (MACD) level at 1092 suggest selling action, adding complexity to the current market analysis.
The moving averages offer a divergent view. Short-term exponential (EMA) and simple moving averages (SMA) for 10 and 20 days indicate a sell signal with values at ,891, ,260, ,291, and ,683, respectively. Conversely, longer-term EMAs and SMAs (30, 50, 100, 200 days) signal a buying opportunity, with the 200-day EMA and SMA at ,057 and ,845, showcasing a bullish long-term trend amidst short-term volatility.
The current scenario suggests caution for traders. For short positions, a break below the last low of ,513 could be a potential entry point, with a stop loss above the most recent high or a lower high. Conversely, for long positions, a reversal pattern, such as a bullish engulfing candle or a higher low setup accompanied by increased buying volume, would be key indicators to watch.
Bull Verdict:
The long-term perspective for bitcoin remains optimistic. Despite recent downward trends on the 4-hour and daily charts, the stronger moving averages over longer periods (30, 50, 100, and 200 days) showcase a robust bullish undercurrent. The market’s resilience, as indicated by the 200-day EMA and SMA positioned well below the current price level, suggests that this could be a temporary consolidation phase before a potential upward breakout.
Bear Verdict:
The immediate outlook for bitcoin leans towards bearishness. The prevailing downward momentum observed in the 4-hour and daily charts, coupled with short-term moving averages signaling sell, paints a cautionary picture for the near future. The presence of consistent lower highs and lower lows, along with increased selling volume, indicates strong bearish sentiment.
Register your email here to get weekly price analysis updates sent to your inbox:
What do you think about bitcoin’s market action on Monday morning? Share your thoughts and opinions about this subject in the comments section below.
Bitcoin, Ethereum Technical Analysis: Leading Crypto Assets See Choppy Price Action
Bitcoin and ethereum prices declined in trading on Friday, November 3, 2023, as technical oscillators flashed mixed signals for the two largest cryptocurrencies by market capitalization.
Bitcoin
Bitcoin (BTC) fell 3.3% to ,195 amid light trading volume of .79 billion over the last 24 hours. The relative strength index (RSI) reading of 70 indicates bitcoin is approaching overbought levels, while the Stochastic oscillator of 86 suggests the crypto may be due for some more pullback.
The commodity channel index (CCI) of 60 reflects that BTC is still trading within the upper half of its recent price range. The ten-day simple moving average (SMA) of ,494 represents near-term resistance, while the longer-term 50-day and 100-day SMAs of ,072 and ,261 signal ongoing positive momentum.
Despite this, the RSI’s descent towards a bearish divergence, coupled with the absence of any forthcoming spot bitcoin exchange-traded fund (ETF) announcements, hints that a downward price correction could be on the horizon. Should this occur, the ,000 and ,500 levels are likely to emerge as critical support thresholds to keep an eye on.
Ethereum
Ethereum (ETH) dropped 2.8% to ,785 during the past 24 hours, with .19 billion worth of ether changing hands over 24 hours. The RSI of 61.4 implies ethereum has room to rise before overbought conditions materialize.
Meanwhile, the Stochastic level of 79.9 indicates the crypto asset is approaching overbought territory on the daily chart. The CCI reading of 51.4 reflects ether trading in the middle of its band. The 10-day SMA at ,800 is close resistance, while the 50-day and 100-day SMAs at ,656 and ,693 denote some leftover bullish momentum.
Ethereum has witnessed a significant uptick in exchange inflows, reaching a five-month high with a surge of nearly 130,000 ether deposited into exchanges. Over the past fortnight, it has risen more than 10% and over the past month, over 8%. Ether has recorded .19 billion in 24-hour trade volume on Friday.
Today’s Bitcoin and Ethereum Market Verdict
Overall, the oscillators show both leading cryptos remain supported but a near-term pullback looks likely given the proximity to overbought levels on the Stochastic. The moving averages confirm the established uptrends remain intact, with any dips representing potential buying opportunities. Traders may look to take some profits near-term while maintaining a bullish intermediate-term outlook on bitcoin (BTC) and ethereum (ETH).
Register your email here to get weekly price analysis updates sent to your inbox:
What do you think about bitcoin’s and ethereum’s price action on Friday? Share your thoughts and opinions about this subject in the comments section below.
Bitcoin Incurs Short-Lived Rally as Choppy Trading Conditions Persist
After hanging by a thread above ,000 for most of the day yesterday, Bitcoin’s bulls stepped up and sent the cryptocurrency surging to highs of over ,500. Although this rally did spark excitement amongst BTC investors, the move ultimately proved to be somewhat fleeting.
Analysts are now noting that ,900 is a key region of resistance that must be broken above in the near-term, or else BTC’s latest movement upwards may mark a “dead cat bounce” that will be closely followed by an extension of its recently incurred downwards momentum.
Bitcoin Surges to ,500 Before Retracing Slightly
At the time of writing, Bitcoin is trading up 2.5% at its current price of ,350, which marks a retrace from its 24-hour highs of over ,500 that were set yesterday.
Although this movement did prove that ,000 remains a strong level of support for the cryptocurrency, a failure for the crypto’s buyers to maintain its newfound upwards momentum may signal that further losses are imminent.
In the near-term, analysts are now noting that ,900 is a key region of resistance that must be broken above, or else this latest price surge may simply be a dead cat bounce that is followed by a drop below ,000.
Luke Martin, a popular cryptocurrency analyst on Twitter, spoke about the key price levels he is watching in a recent tweet, explaining that ,900 is the price that BTC must break above in the near-future for an uptrend to begin.
“Did not expect price to jump 0, an hour after saying this. Nothing special about wanting to be long by support. @CryptoCred chart yesterday explained it clearly. Still like long vs short exposure. The higher conviction, slower moving confirmation is $BTC above 10.9k zone,” he explained while pointing to the below chart.
Did not expect price to jump 0, an hour after saying this. Nothing special about wanting to be long by support. @CryptoCred chart yesterday explained it clearly.
Still like long vs short exposure.
The higher conviction, slower moving confirmation is $BTC above 10.9k zone. pic.twitter.com/Cxa3e82nwA
— Luke Martin (@VentureCoinist) August 26, 2019
Researcher: Data Suggests BTC Has Yet to Reach a Top During Recent Uptrend
In the short-term it may remain unclear as to whether or not Bitcoin will move higher or face continued downwards pressure, but the Senior Quantitative Analyst at the Ikigai Fund explained in a recent tweet that one data point suggests that BTC has yet to set a top for its recent uptrend.
“Bitcoin bubble tops are clearly identified with a dark red cluster of Adjusted Binary BDD. Until that happens, we’re not at the top. Public opinion is key here because that red cluster is caused by the assumption of the crowd and is self-fulfilling (reflexivity),” he explained while referring to the chart seen below.
Bitcoin bubble tops are clearly identified with a dark red cluster of Adjusted Binary BDD. Until that happens, we're not at the top. Public opinion is key here because that red cluster is caused by the assumption of the crowd and is self-fulfilling (reflexivity). pic.twitter.com/hZG9WMYcsS
— Hans HODL (@hansthered) August 22, 2019
It is highly probable that the coming days and weeks will elucidate whether or not Bitcoin is ready to reverse its recent downtrend and climb higher, or if it will once again visit the four-figure price region and continue to consolidate.
Featured image from Shutterstock.
The post Bitcoin Incurs Short-Lived Rally as Choppy Trading Conditions Persist appeared first on NewsBTC.
Prominent Crypto Investor Expects “Choppy Waters” For Bitcoin Over 2019
Since 2018 went on the way out, optimists have remarked that they expect for Bitcoin and the broader blockchain ecosystem to get some much-needed reprieve in 2019. Yet, a rally, recovery, or run of similar caliber still seems like a quixotic dream, as cryptocurrencies have failed to reverse a multi-month downturn. And interestingly, a number of analysts, including those with an immense vested interest in Bitcoin, expect for this bearish trend to continue well into 2019.
Bitcoin Investors Should Expect Choppy Waters
Joey Krug, a co-founder of preeminent Ethereum-based project Augur and the co-chief investment officer at Pantera Capital, recently sat down with Bloomberg TV to discuss his thoughts on cryptocurrencies moving forward.
Bloomberg host Emily Chang, sticking to the script, asked Krug about how the digital asset space will develop during 2019. Unsurprisingly, the Pantera C-Suite member, an American tech-centric entrepreneur, noted that he expects for “choppy waters” to continue to haunt Bitcoin and other cryptocurrencies throughout 2019.
Krug isn’t alone in claiming that 2019 won’t bring mark a “knock your socks off” bull rally for cryptocurrencies. In fact, a number of preeminent analysts and commentators have claimed that 2019 will be rife with price shortcomings. In an early-January Youtube appearance, Murad Mahmudov, a Princeton graduate turned well-respected crypto trader, explained that as a number of altcoins, like Ether, EOS, XRP, are still drastically overvalued, the broader market could be overvalued. Mahmudov subsequently noted that Bitcoin could bottom within the ,800 to ,400 range, recently citing crypto’s historical drawdowns.
Regardless, a number of industry insiders and onlookers believe that 2019’s crypto sector will be full to the brim with fundamental developments, rather than collapsing startups, depressed markets, and irritated investors.
Pundits Believe Crypto Bottom Still Months Away
Fred Wilson, a world-renowned venture capitalist who founded Union Square, recently touched on this thought process in a recent installment of AVC, his personal blog. Wilson noted that while a bottom of cryptocurrency markets is festering, the process of finding a floor could occupy much of 2019. However, Wilson went on to explain that he expects for 2019 to be a positive year for this industry’s fundamentals, explaining that many of 2017’s unfulfilled crypto-related promises will come to fruition in 2019.
Wilson added that he expects for “next-gen” smart contracts platforms, like Cosmos, to begin making a move on Ethereum’s hegemony, creating a pro-innovation ecosystem that is rife with competition. Lastly, the Union Square co-founder and partner noted that he expects for “blockchain 3.0” platforms, coupled with stablecoins and non-fungible tokens, to make a move on the mainstream consciousness.
Chris Burniske, a partner at Placeholder Ventures, echoed this sentiment, recently claiming that he expects for prominent projects to ship viable product in 2019, just like how Ethereum launched in 2015.
Then again, there are some even more cynical than the aforementioned three. Civic’s Vinny Lingham, a South African entrepreneur that appears on the nation’s installment of Shark Tank, recently remarked that he expects for Bitcoin to continue to range trade, rather than breaking out.
Yet, in the aforementioned interview, Krug provided an optimistic outlook to Bloomberg viewers, balancing out the dichotomy between Lingham’s harrowing comments and bullish quips from Wilson and crew. Pantera’s investment head, who has presumably allowed his firm to thrive in questionable conditions, explained that “moving forward,” there will be a notable focus on acquiring users and pushing product, adding that he’s “optimistic overall.”
The Silicon Valley-based investor added that he expects for cryptocurrencies to eventually undergo a long-term “grind” higher, likely on the back of scalable crypto networks that may single-handedly catalyze global adoption.
Related Reading: Crypto Pundits Skeptical Of “Better Bitcoin” Plan From MIT, Stanford
Featured Image from Shutterstock
The post Prominent Crypto Investor Expects “Choppy Waters” For Bitcoin Over 2019 appeared first on NewsBTC.
Bitcoin Price Watch: Choppy Price Action Could Lead BTC Higher
- Bitcoin price found support near ,400 and later recovered above ,660 against the US Dollar.
- There was a break above a key bearish trend line with resistance at ,560 on the hourly chart of the BTC/USD pair (data feed from Kraken).
- The price is currently consolidating above ,600 and it could dip towards the ,560 support.
Bitcoin price recovered nicely above ,500 and ,600 against the US Dollar. However, the current price action is choppy, suggesting swing moves in BTC above ,560.
Bitcoin Price Analysis
Recently, we saw a major downward move below ,800 in bitcoin price against the US Dollar. The BTC/USD pair even broke the ,560 support and the ,400 pivot level. A low was formed at ,376 and later the price started a decent recovery. It broke the ,400 and ,500 resistance levels to move into a positive zone. The upward move was convincing as the price settled above ,560 and the 100 hourly simple moving average. Finally, there was a break above the ,649 swing high, opening the doors for more gains.
Moreover, there was a break above a key bearish trend line with resistance at ,560 on the hourly chart of the BTC/USD pair. The price tested the 1.236 Fib extension level of the drop from the ,650 high to ,376 low. A high was formed at ,716 and the price is currently consolidating gains. An initial support is ,640 and the 23.6% Fib retracement level of the recent wave from the ,376 low to ,716 high. The main support is near the previous resistance at ,560. It coincides with the 50% Fib retracement level of the recent wave from the ,376 low to ,716 high.
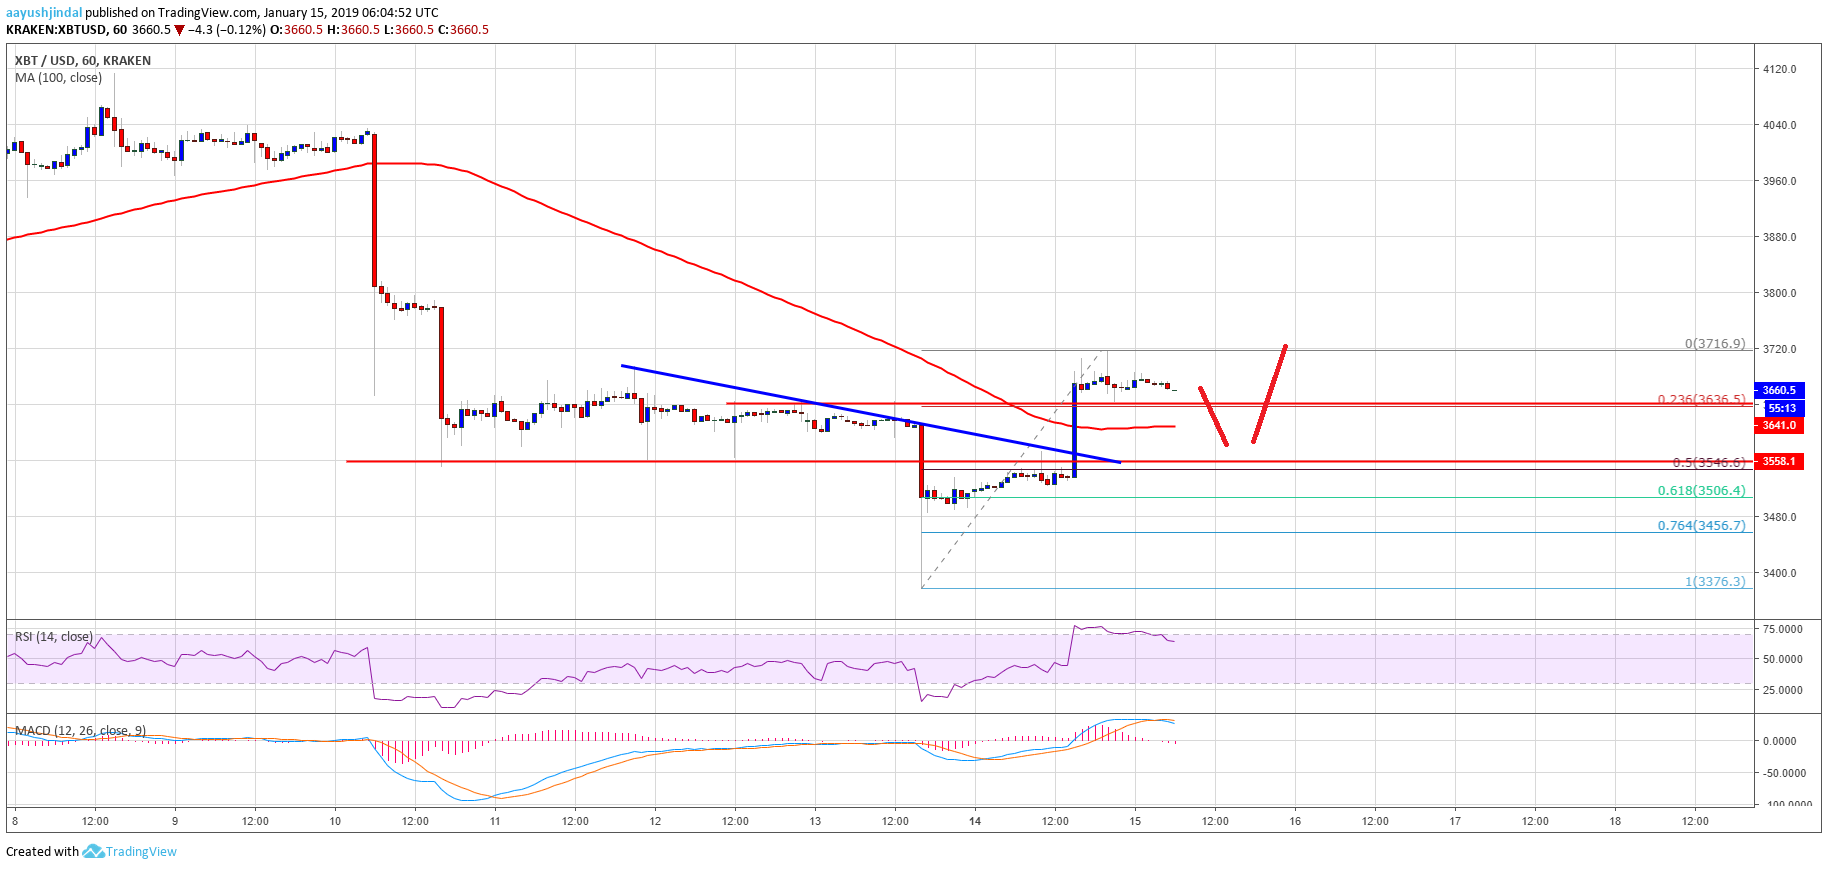
Looking at the chart, bitcoin price recovered nicely above ,560, but the price action seems to be a bit choppy. Therefore, there could be a few swing moves towards ,560 before a fresh upward move.
Technical indicators
Hourly MACD – The MACD for BTC/USD is moving back in the bearish zone.
Hourly RSI (Relative Strength Index) – The RSI for BTC/USD is moving lower towards the 50 level, with a bearish angle.
Major Support Level – ,560
Major Resistance Level – ,720
The post Bitcoin Price Watch: Choppy Price Action Could Lead BTC Higher appeared first on NewsBTC.
Bitcoin Price Analysis Choppy Market Conditions Lead to Tests of Parabolic Resistance
The bitcoin market has been getting chopped to pieces for weeks as the market has faked up, faked down, consolidated and routinely stopped out traders. Last week, we discussed a potential large move due to a consolidated symmetrical triangle. However, the breakout failed to garner any momentum and ultimately flopped as the move upward quickly died down and ultimately reversed.At the time of this article, however, the market is poised in a precarious situation as it tiptoes around historic sup
CryptScout #BitFeed RSS – Bitcoin and Cryptocurrency News 24/7
Short-Term Top? Bitcoin Price Seeks Direction on Choppy Charts
With extreme volatility evident in bitcoin’s price this morning, what lies ahead for the cryptocurrency? Analysis suggests caution is advised.
CoinDesk
Ethereum Price Technical Analysis – ETH/USD’s Choppy Moves
Key Highlights ETH price did not move much from the 2 swing low against the US Dollar. There is a short-term contracting triangle forming with resistance at 2.50 on the hourly chart of ETH/USD (data feed via SimpleFX). On the downside, a short-term support is at 7.50, which can be seen as a daily pivot. … Continue reading Ethereum Price Technical Analysis – ETH/USD’s Choppy Moves
The post Ethereum Price Technical Analysis – ETH/USD’s Choppy Moves appeared first on NEWSBTC.