 In a modest yet positive development, U.S. spot bitcoin exchange-traded funds (ETFs) saw a net inflow of .5 million, even as the ETF ARKB experienced a substantial outflow of .5 million. Despite ARKB’s significant outflow surpassing that of GBTC, Grayscale’s Bitcoin Trust also faced a reduction, with approximately .9 million being pulled from its funds. […]
Bitcoin News
Reality Check: MATIC Investors Count Losses – More Headaches Ahead?
Polygon’s native token, MATIC, finds itself at a crossroads as it grapples with price volatility amidst an impending network upgrade and challenges surrounding Total Value Locked (TVL). In the past week, MATIC has witnessed a notable downturn in price, slipping by 4.44% according to data from CoinMarketCap. Despite earlier optimism that drove MATIC close to the mark, the token has encountered resistance at the level, with bullish momentum struggling to gain traction amidst prevailing market conditions.
MATIC Investors Feel The Pinch
Data analysis from IntoTheBlock paints a mixed picture for MATIC holders, revealing that 51% are currently facing losses, while 43% are enjoying profits, leaving a mere 5% at the break-even point. This volatility serves as a stark reminder of the inherent risks associated with investments in the cryptocurrency market.
However, amidst the market turbulence, a ray of hope emerges for MATIC holders in the form of Polygon’s recently announced “Napoli upgrade.” This upgrade, designed to bolster the network’s consensus mechanisms, is set to introduce enhancements in parallel execution and incorporate novel operational codes for the Ethereum Virtual Machine (EVM). Analysts speculate that the Napoli upgrade could inject renewed buying pressure into the market, with projections hinting at a potential price rise towards .30 if bullish sentiment prevails.
Despite the anticipation surrounding the Napoli upgrade, Polygon faces challenges on other fronts, notably concerning its Total Value Locked (TVL). In a remarkable turnaround from its peak in 2021, TVL has plummeted to billion, according to data from DeFiLlama. This decline reflects a waning participation in liquidity provision, raising concerns about the protocol’s health and resilience.
The Road Ahead For Polygon
Polygon’s leadership remains optimistic about the project’s future, emphasizing its resilience amidst market fluctuations. They believe that the Napoli upgrade, coupled with strategic initiatives aimed at addressing challenges such as TVL, will fortify Polygon’s position for sustained success in the dynamic cryptocurrency landscape.
As investors and industry observers closely monitor developments within the Polygon ecosystem, navigating the delicate balance between the potential catalyst of the Napoli upgrade and the headwinds posed by declining TVL, the road ahead for MATIC remains uncertain. The cryptocurrency’s ability to weather market volatility and regain momentum in the face of recent setbacks will be pivotal in shaping its trajectory in the coming weeks and months.
MATIC’s recent price gyrations, punctuated by the announcement of the Napoli upgrade and challenges surrounding TVL, underscore the complexities inherent in navigating the cryptocurrency market. As Polygon continues to chart its course, adaptation and innovation will be key drivers in determining its long-term viability amidst an ever-evolving landscape.
Featured image from Andrea Piacquadio/Pexels, chart from TradingView
Google Introduces Cryptocurrency Wallet Balance Check via Search Engine
 Google has enhanced its search engine to allow users to check their cryptocurrency wallet balances directly by entering the wallet’s address, supporting various blockchain networks including Bitcoin, Arbitrum, Avalanche, Optimism, Polygon, and Fantom. This feature not only shows the native token balance of a wallet for each supported network but also indicates the last time […]
Bitcoin News
Axie Infinity’s Stats Slump: A Play-to-Earn Reality Check

Axie Infinity ranks among the largest blockchain-driven play-to-earn games ever. However, its luster has dimmed considerably from its January 2022 peak. Then, a robust 2.78 million average monthly players flocked to the game. Yet, today’s count stands at a mere 359,254 average monthly participants, translating to a dramatic decline of over 87%.
Axie Infinity’s Dramatic 87% Decline in Average Monthly Users
The play-to-earn blockchain game, Axie Infinity, experienced a notable decrease in its average monthly users since January 2022. At that time, Axie Infinity attracted an average of 2.78 million monthly users. By June 2022, this number fell to 958,044.
The next month saw a decrease of roughly 191,240 users, leaving about 766,804 monthly users in July 2022. Since February 2023, Axie hasn’t surpassed the 400,000 mark nor dipped below 340,000, according to activeplayer.io figures.
The game, which uses non-fungible token (NFT) technology, was first introduced on the Ethereum blockchain. To expand, Sky Mavis, the game’s developers, developed a layer two (L2) chain named Ronin. The rollout of Ronin finished in February 2021, and by April of the same year, all Axie NFTs transitioned from Ethereum to Ronin.
Even with a decrease in monthly users, Axie has logged .28 billion in NFT sales over 20.32 million transactions. However, figures from defillama.com indicate that the total value locked (TVL) on Ronin has seen a significant decline. On December 3, 2021, Ronin’s TVL peaked at .487 billion, but it has since fallen to million.
The project’s native cryptocurrencies, axie infinity (AXS) and smooth love potion (SLP), have declined 97.13% to 99.65% from their record highs. In the last month, AXS decreased 1.3%, but it rose 4% in the past week. Meanwhile, SLP fell 2.2% over 30 days compared with the U.S. dollar. SLP ranks 351 among more than 10,000 cryptocurrencies, while AXS holds the 61st position on September 16, 2023.
More than 99% of AXS investors have faced losses since the game’s currency introduction. Axie’s unique active wallet count isn’t faring much better, with a decline of over 14% in the past 30 days. This month’s transaction count is down 6.53% from the previous month.
With a volume decrease of more than 43%, the project’s numbers look bleak. Although 359,254 monthly players is notable, Call of Duty’s mobile game tallied nearly 57.9 million players in August. This indicates Call of Duty had about 161.3 times more monthly active users than Axie.
What do you think about Axie’s downturn since the project’s peak? Share your thoughts and opinions about this subject in the comments section below.
Bitcoin Price Bulls In Check, Signs of Fresh Increase above $21.5K
Bitcoin price is attempting a fresh increase above the ,200 resistance zone. BTC could gain bullish momentum if there is a clear move above the ,500 resistance.
- Bitcoin corrected lower, but it found support near the ,500 zones.
- The price is trading above ,000 and the 100 hourly simple moving average.
- There is a short-term key bullish trend line forming with support near ,050 on the hourly chart of the BTC/USD pair (data feed from Kraken).
- The pair could start a fresh increase if there is a clear move above the ,500 resistance zone.
Bitcoin Price Remains Supported
Bitcoin price started a downside correction from the ,500 resistance zone. BTC declined below the ,000 support zone, similar to ethereum.
However, the bulls were active near the ,500 and ,400 support levels. A low is formed near ,395 and the price is now rising. There was a clear move above the ,850 resistance zone. The bulls pushed the price above the 50% Fib retracement level of the recent decline from the ,639 swing high to ,395 low.
Bitcoin price is now trading above ,000 and the 100 hourly simple moving average. There is also a short-term key bullish trend line forming with support near ,050 on the hourly chart of the BTC/USD pair.
An immediate resistance is near the ,160 level. It is near the 61.8% Fib retracement level of the recent decline from the ,639 swing high to ,395. The next major resistance is near the ,500 zone, above which the price might gain bullish momentum.
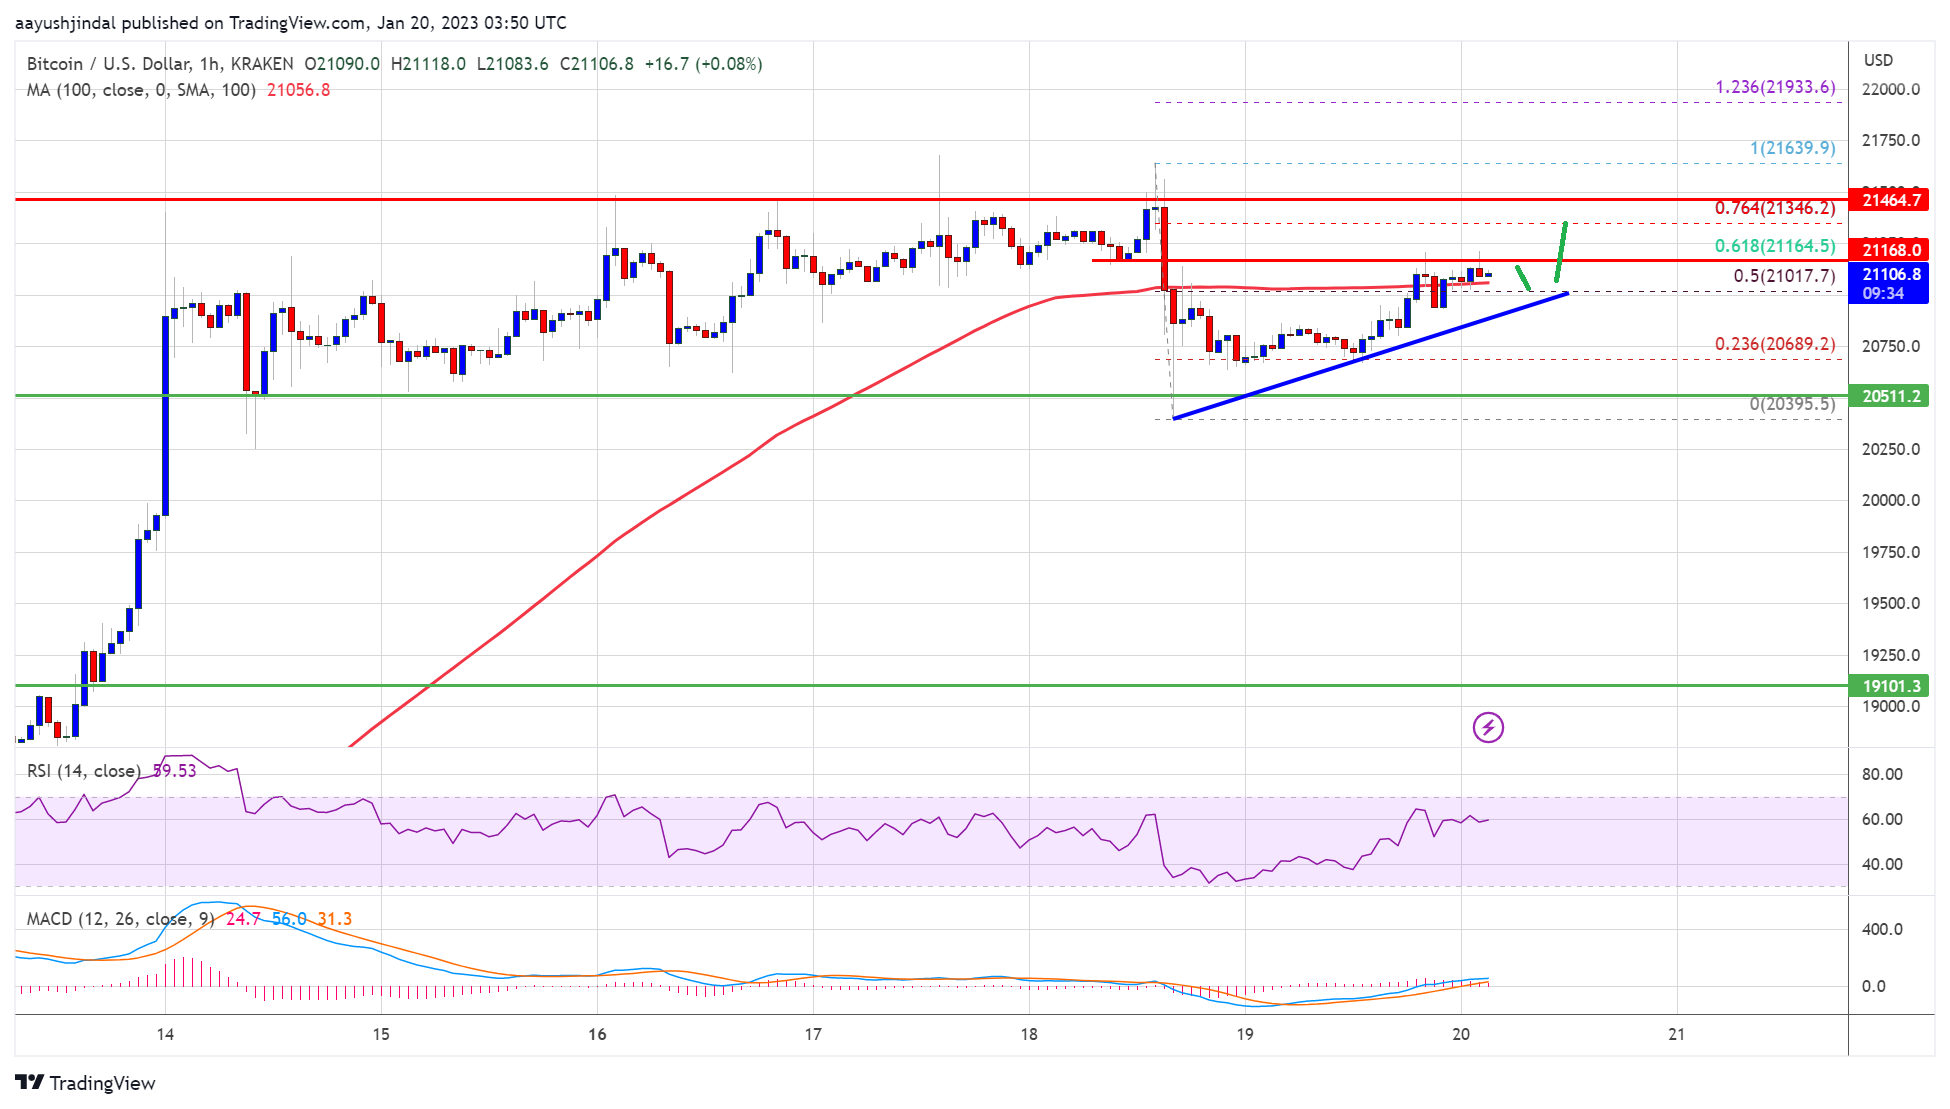
Source: BTCUSD on TradingView.com
In the stated case, the price may perhaps rise towards the ,000 level. Any more gains might send btc price towards the ,500 level.
Another Drop in BTC?
If bitcoin price fails to clear the ,250 resistance, it could start a fresh decline. An immediate support on the downside is near the ,050 zone and the trend line.
The next major support is near the ,500 zone, below which the price might gain bearish momentum and test ,000. Any more losses might send the price to ,500 in the near term.
Technical indicators:
Hourly MACD – The MACD is now losing pace in the bearish zone.
Hourly RSI (Relative Strength Index) – The RSI for BTC/USD is now above the 50 level.
Major Support Levels – ,500, followed by ,000.
Major Resistance Levels – ,160, ,250 and ,500.
Why XRP Holders Who Are Taking Profit Should Check These Data In The Coming Days
XRP has struggled to break out of a narrow range over the last few weeks and has failed to make any significant progress in terms of price pump.
- XRP struggles to surpass he crucial .53 resistance marker
- The altcoin is swinging between narrow ranges in terms of price movement
- Whales continue to accommodate despite previous selloff
The asset’s trading data chart reveals it is trapped within a Fibonacci support and resistance region where it encounters strong challenge surpassing the .53 marker.
 Source: TradingView
Every time XRP tries to move past this certain price point, it ends up testing the .43 support level. This cycle has been ongoing for the altcoin since the month of September.
Despite the recent rally of the crypto market, the virtual coin declined by 1.3% over the last 24 hours and is still down by 4.4% for the past two weeks. At press time, according to tracking from Coingecko, the digital currency is trading at .47.
A bit of good news for investors is that its Relative Strength Index is within an ascending support line which denotes a bullish signal for the asset that is the subject of an ongoing court battle between Ripple Labs and the U.S. Securities and Exchange Commission.
Ripple Focusing On Development To Help XRP
Despite being in a long-standing legal tussle, Ripple is turning its focus to network development activities that will help XRP recover from its losses.
The company recently announced the launching of its third wave of 0 million creator fund which is open for all creators of both digital and physical non-fungible tokens (NFTs).
Ripple said the application is open until December 30, 2022 and all interested applicants are welcome to try their luck for the millions worth of creator fund.
This is still in line with the company’s goal of increasing network activity of Ripple users and also underscores their interest to grow their NFT market.
Should Investors Buy XRP Today?
As the crypto is not moving much in terms of price range, investors might opt to buy right now and hold their tokens while waiting for the next bullish market rally.
XRP whales are doing the same, accumulating as much as they can even during the mini surge that helped the crypto space push its overall valuation back to over trillion.
It is, however, important to note that addresses holding more than 10 million tokens have sold their XRP and trimmed their balances.
This would mean that while some big investors are buying, the others are selling, ensuring balance to the asset’s distribution.
Some analysts believe it is wise to hold the asset for now as the Ripple Labs is on the verge of finally winning its legal battle against SEC.
They are looking at this development as a catalyst to trigger an XRP rally that will finally break its bearish cycle.
XRP market cap at .6 billion on the daily chart | Featured image from The Daily Hodl, Chart: TradingView.com
Disclaimer: The analysis represents the author’s personal views and should not be construed as investment advice.
NewsBTC
Stellar (XLM) Buyers Must Check Out These Data Before Going Long
Stellar is one of the cryptocurrencies that had an interesting and fruitful 2021, perhaps why the altcoin is making positive noise these days for being a viable asset for long trading.
- Stellar could enter a dull phase on the coming sessions
- XLM is -10.1% over the past week
- Stellar is on an extended bearish momentum
In crypto space, long trading involves buying an asset and making profit as its price increase. On the other hand, short trading happens when one sells a borrowed security and buys it back at a lower price, making income from the decreased value.
Stellar is hot in the eyes of investors looking to earn from long trading as the digital currency’s current price is significantly lower than its 2021 levels.
Given the virtual coin’s ability to increase its price tremendously, its easy to understand why investors might pick Stellar for their long trading scheme.
But, as with other ventures, it would be wise to pay close attention to XLM’s price movement first, before putting sizable investment on it and deciding to play the long game.
Stellar Price Analysis and Trajectory
After a spectacular showing in May 2021 when it attained multiple yearly highs, Stellar has fallen into a gradual bearish rally and is positioned in trendline resistance for over 17 months now.
Source: TradingView
At press time, data from Coingecko shows the crypto is trading at .113 and is down by 10.1% over the past week. On a year-to-date comparison, Stellar is – 68.8%.
The bearish momentum of the crypto market hit XLM very hard as its price fluctuates between .09 and .1 which has been its support range for the past 22 months.
As different metrics such as 20 and 50 EMA and Relative Strength Index indicating the asset could be looking at a dull phase in the coming sessions, investors looking for long trading might have problem gaining the kind of profit they expect.
Stellar’s Superb 2021 Showing
As mentioned earlier, XLM had an impressive run in 2021, ending up as one of the most watched out digital assets of the year.
After starting 2021 with a price of .133, the crypto wasted no time as it increased its value by 224% during the first week of January to trade at .432.
The following month, Stellar successfully completed a bullish rally as it hit .6. But the asset wasn’t immune to the volatility of its space, as it experienced price dump before bouncing back on April 14 when it changed hands at .689.
The month of May proved to be even better for the crypto, as it notched a higher trading price of .791 on the 17th.
But Stellar suddenly appeared to have used up all its momentum as its price declined over the months that followed.
XLM total market cap at .9 billion on the daily chart | Featured image from CoinLive, Chart: TradingView.com
Disclaimer: The analysis represents the author’s personal views and should not be construed as investment advice.
NewsBTC
Bitcoin Holders Bracing For A Crypto Winter Bottom Should Check These Data
Bitcoin bulls continue to feel the pinch as the currency has dropped 8.17 percent in value over the past seven days. BTC investors are looking forward to a market bottom, and Glassnode claims that the market has bottomed out.
Nonetheless, whales and major institutions are currently in the accumulation phase, so it doesn’t matter if the market has bottomed out or is bottoming out right now.
A research states that this accumulation indicates whales are increasing their purchases rather than preparing their portfolios for a sale. The indication for whales to buy more is a bull green light from retail investors.
But what does this signify for Bitcoin if this is the case?
Bitcoin Price Drops Below k Level
The Bitcoin market stabilized between early June and early August, after a near-catastrophic collapse of the whole crypto sector. Bitcoin fell by a staggering 58% in the crypto market meltdown of May and June.
Chart: TradingView
The ,500 support level held steady during the mild downtrend. BTC bulls are currently positioning themselves for a rally at the same level. While Glassnode data suggests Bitcoin may have bottomed out, the timing of a further upswing is uncertain.
The future of Bitcoin, however, is uncertain at the time of writing. Price for one BTC has fluctuated recently, staying between ,850 and ,461. BTC last broke through the ,000 psychological barrier during a brief rise on October 3 and 4.
Macroeconomic Issues Hound Top Crypto
As the number of institutional investors interested in Bitcoin rises, the crypto market is impacted by macroeconomic issues.
In 2021, JP Morgan market analysts observed that institutional investors preferred Bitcoin to gold as a hedge against inflation.
The NYDIG BTC fund has already gathered 0 million from 59 backers. Considering the growing interest from major financial organizations, Bitcoin is now in the same boat as the financial system as a whole.
Since Bitcoin’s value is highly correlated with that of the S&P 500 and the NASDAQ, broader financial action is likely to amplify the current distress among Bitcoin investors.
We may see Bitcoin’s price increase in the next months if the bears lose some of their aggressive posture.
BTC total market cap at 7 billion on the daily chart | Featured image from Freepik, Source: TradingView.com
NewsBTC
Hedera: Investors Should Check Out These Data Before Buying HBAR
Hedera shows lots of potential, despite some major hiccups lately. Investors will be better equipped if they examine some key data before acquiring HBAR.
Here’s a quick look at some important numbers:
- HBAR currently trades at .05798
- Trading volume currently at .2 million
- Hedera circulating supply at 22.97%
Hedera is a new and revolutionary open-sourced crypto network that utilizes a distributed ledger technology that is designed to allow both developers and users to use DApps.
HBAR Up 2.05% As Of Press Time
HBAR’s development activity has seen tremendous growth in such a short span of time since November 2018. Notably, HBAR has ranked third, next to Polkadot (DOT) and Cardano (ADA).
Hedera is designed to solve the nagging problems in terms of scalability, which is a huge problem among blockchains.
Right now, Hedera is seen to be one of the winners in terms of scalability and security when pitted with other blockchains which is why it remains to be one of the most popular and widely used enterprise-grade blockchain in the world.
According to CoinMarketCap, HBAR, the 39th largest cryptocurrency, trades at .05798 or shows a spike of 2.05% as of press time.
With its current price, HBAR is noticeably 91% sidetracked from its all-time high.
Hedera Trading Volume Down 89%
On a year-to-date basis, HBAR has also evidently dropped by 408%. The downtrend of HBAR has started following its daily high that registered at 9.68 million seen on May 12.
The trading volume of HBAR is currently at .2 million, showing a decline of 89% since its ATH on May 12.
More so, the circulating supply of HBAR has also plunged together with the trading volume and price. The circulating supply is at 22.97 billion or at 46% since January.
The daily chart for HBAR shows the spike of buying pressure that is growing to date.
Meanwhile, it’s worth noting that HBAR liquidations only made up 0.00001% of the total market’s .04 million in liquidations during the past 24 hours.
Coinglass reports that the total value of all HBAR trades in the preceding 24 hours was pegged at ,615.
HBAR market cap at .32 billion | Featured image from Freepik, Chart: TradingView.com
NewsBTC
Chainlink Traders Should Check These Factors Before Cutting Losses
Chainlink price has consistently been negative as seen in the past couple of hours.
- Chainlink outskirting other cryptocurrencies with higher market cap
- The crypto is registering weekly gains of 13%; with no red zones
- LINK price down by 9.25%
Looks can deceive and Chainlink (LINK) is a proof of that as it outskirts other altcoins that have comparably higher market cap. Chainlink is performing at its peak as seen in the past seven days, registering heightened gains of 13% with no reds evident on the charts.
Today, the market was looking bullish but hints a negative momentum prompting LINK to nosedive. The price has crashed from .5 to now at .64. According to CoinMarketCap, LINK price is down by 8.63% or trading at .64 as of press time.
Chainlink Simmers Down In Terms Of Market Volatility
The past week, Chainlink’s has had over 11 integrations with Polygon, BNB, Phantom, Solana, and Ethereum which is a positive sign that developers are working hard to ramp up the network.
More so, the spike also coincided with the pump in volume which demonstrates a stable price increase. A tweet by Whalestats hails LINK as one of the popular cryptocurrencies that the top 500 ETH whales currently have in their holdings.
Source: TradingView
On a four-hour chart, LINK price is seen to simmer down in terms of market volatility or going extremes. LINK/USD price is hovering under the Moving Average price which indicates that the bears are monopolizing the market. However, there could still be a chance for bulls to get their way in.
CMF and RSI for Chainlink is at 53 indicating that the market is in a fail-safe or neutral phase. RSI is further showing a downswing. Evidently, the Bollinger Bands showed that following the high volatility phase, LINK’s price should go on a downtrend. This dismisses opportunities of an uptrend over the short term.
LINK Bears Monopolizing The Market
Investors have so much confidence in Chainlink and are expecting for LINK price to soar in the coming days. LINK’s price spike is validated by a couple of on-chain metrics.
Chainlink’s exchange reserves have been down by 2% in the past week which is indicative of a lowered selling pressure hinting a bullish movement.
Notably, there was also a spike in total transaction volume and number of active wallet addresses as seen in the past 24 hours.
On the other hand, judging by the decline in LINK’s exchange outflow amid the price surge implies the emergence of a bear market.
LINK total market cap at .15 billion on the daily chart | Source: TradingView.com
Featured image from Coinpedia, chart from TradingView.com
NewsBTC