 Chainlink, a decentralized computing and oracle protocol, Avalanche, known for its layer one (L1) blockchain technology, and GMX, a notable decentralized exchange, have launched Chainlink Data Streams on the Avalanche blockchain. Chainlink, Avalanche, GMX Launch Data Streams on Avalanche Blockchain In communications shared with Bitcoin.com News by the three teams, the announcement notes that Chainlink […]
Bitcoin News
Chainlink (LINK) To Hit New Highs? Analysts Predict $25 Target
Chainlink (LINK) , the oracle network powering the decentralized world, has been stirring up excitement after a recent surge past a critical resistance level. Analysts are now predicting a potential price explosion, with some even charting a course for the moon. However, lurking beneath the bullish sentiment are shadowy movements by large investors, injecting a dose of uncertainty into the mix.
Chainlink Escapes The Triangle, Eyes Set On The Sky
After a period of decline, LINK has shown signs of life, decisively breaking above the resistance level. This bullish move has sparked a wave of optimism, with many analysts predicting a sustained uptrend.
Morecryptoonl, a renowned crypto analyst, identified a significant Elliott Wave pattern in LINK’s price action. According to this analysis, LINK is currently undergoing a consolidation phase within a triangle pattern. While this pattern can indicate a period of sideways movement, a breakout above a key resistance level of .85 could signal a significant shift in momentum.
$LINK: Wave (B) in white could unfold as triangle pattern but the price, in this case, has to stay below the yellow line at .85. A break above this line will indicate that a larger corrective rally in yellow wave (B) is unfolding.#chainlink #LINK #altcoins pic.twitter.com/eGngNm0eEH
— More Crypto Online (@Morecryptoonl) June 25, 2024
Bullish forces are further emboldened by the current Relative Strength Index (RSI) sitting at a neutral 43. This suggests that LINK is neither overbought nor oversold, leaving plenty of room for potential growth.

Technical indicators aside, World of Charts is predicting a “sustained bullish trend” if LINK can definitively break free from its current consolidation pattern. Their optimistic forecast paints a picture of LINK reaching lofty heights between and .
Whales Stir The Waters: Selling Spree Or Strategic Shuffle?
A recent wrinkle in the bullish narrative has been the movement of large amounts of LINK by whales, entities holding significant crypto holdings. Over 18 million LINK tokens were recently transferred to exchanges, raising concerns about potential selling pressure that could dampen the current rally.
However, some analysts caution against jumping to conclusions. They argue that such movements are not uncommon and could be part of a larger investment strategy, not necessarily a prelude to a selloff.
A Bumpy Ride Ahead?
While the future looks bright for LINK, investors should be prepared for a rollercoaster ride. The cryptocurrency market is notoriously volatile, and LINK is no exception. While the current technical analysis paints a bullish picture, unforeseen events or market fluctuations could quickly derail the positive momentum.
Featured image from Pexels, chart from TradingView
Chainlink Signals Upside Break: Analyzing LINK’s Bullish Indicators
Chainlink’s LINK price is recovering from the .65 support. The price is gaining bullish momentum and might aim for a move above the .20 resistance.
- Chainlink price is showing bullish signs and eyeing more gains above .00 against the US dollar.
- The price is trading above the .50 level and the 100-hourly simple moving average.
- There was a break above a major bearish trend line with resistance near .60 on the hourly chart of the LINK/USD pair (data source from Kraken).
- The price could extend gains if it clears the .20 resistance zone.
Chainlink Price Turns Green
In the past few sessions, Chainlink saw a decent upward move from the .65 zone. There was a move above the .00 and .20 levels. LINK bulls are now attempting a steady upward move like Ethereum.
There was a clear move above the 50% Fib retracement level of the downward move from the .82 swing high to the .66 low. There was also a break above a major bearish trend line with resistance near .60 on the hourly chart of the LINK/USD pair.
Chainlink is now trading above the .50 level and the 100-hourly simple moving average. Immediate resistance is near the .05 level or the 61.8% Fib retracement level of the downward move from the .82 swing high to the .66 low.
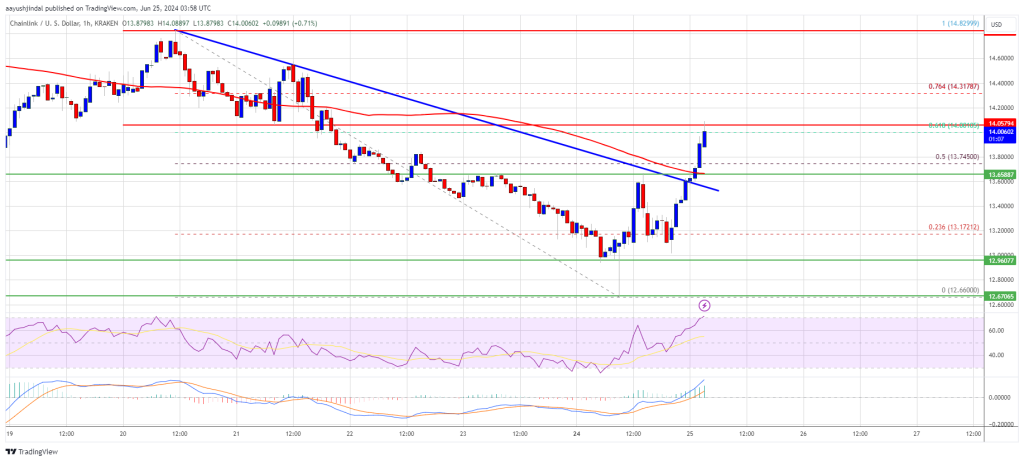
The next major resistance is near the .20 zone. A clear break above .20 may possibly start a steady increase toward the .50 level. The next major resistance is near the .80 level, above which the price could test .00. Any more gains might send the price toward the .50 resistance level in the coming sessions.
Are Dips Limited In LINK?
If Chainlink’s price fails to climb above the .20 resistance level, there could be a downside correction. Initial support on the downside is near the .80 level.
The next major support is near the .65 level or the 100-hourly simple moving average, below which the price might test the .50 level. Any more losses could lead LINK toward the .90 level in the near term.
Technical Indicators
Hourly MACD – The MACD for LINK/USD is gaining momentum in the bullish zone.
Hourly RSI (Relative Strength Index) – The RSI for LINK/USD is now above the 50 level.
Major Support Levels – .80 and .50.
Major Resistance Levels – .20 and .50.
19 Million Chainlink Tokens Transferred To Exchanges – More Downside For LINK Price?
The cryptocurrency market witnessed severe bearish pressure over the past week, and the price of Chainlink (LINK) wasn’t an exception. The altcoin has continued to struggle with its torrid form, losing nearly 10% of its value in the last seven days.
Interestingly, the bears seem to still be in control at the moment, with the latest on-chain revelation suggesting that there might be further downside for the LINK price over the next few days.
Are Chainlink Investors Offloading Their Assets?
Popular crypto analyst Ali Martinez revealed in a post on the X platform that huge amounts of the Chainlink token have made their way to centralized exchanges in the past day. This on-chain observation is based on Santiment’s “Supply on Exchanges” metric, which tracks the amount of a particular cryptocurrency being held on centralized exchanges.
When this metric’s value increases, it implies that investors are making more deposits than withdrawals of a cryptocurrency (Chainlink, in this case) into centralized exchanges. A decrease in the metric’s value, on the other hand, indicates that holders are moving their coins out of the trading platforms.

According to data from Santiment, more than 18.77 million LINK (worth roughly 6.2 million) were transferred to cryptocurrency exchanges in the past day. This substantial transfer represents one of the largest single-day movements for the Chainlink token in recent months.
Interestingly, a report from SpotOnChain revealed that 21 million tokens were unlocked from Chainlink’s non-circulating supply contracts on Friday, June 21. Specifically, the contract transferred 2.25 LINK tokens were sent to the multi-sig wallet 0xD50f
More notably, 18.25 million LINK tokens were sent to Binance, the world’s largest cryptocurrency exchange. This significant token unlock presents a case of supply inflation, which can impact the value of the token especially if a sell-off occurs.
Moreover, these fund movements can precipitate an increase in market volatility and possibly lead to price fluctuations. Given the magnitude and destination of these transfers, there is a greater likelihood of increased selling pressure, which can drive down the price of LINK.
Is A Return To On The Cards?
As of this writing, the price of Chainlink is barely holding above .6, having declined by more than 3% in the past day. Meanwhile, the altcoin slumped 9% from about to .5 over the past week, according to data from CoinGecko.
If the recent selling pressure continues, then further decline might be on the horizon for LINK’s price. This could see the cryptocurrency make a return to around the price zone for the first time in more than a month.
Nevertheless, the Chainlink token ranks amongst the top 20 largest cryptocurrencies in the sector, with a market capitalization of over .27 billion.
Breakout Alert! Chainlink (LINK) On Verge Of Major Surge, Analyst Says
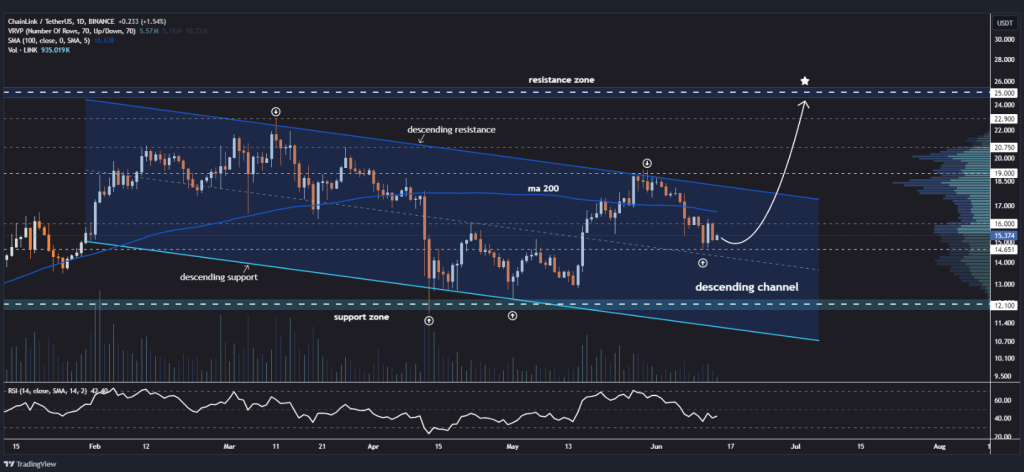
After a period of consolidation, Chainlink (LINK), the oracle network powering decentralized applications (dApps), is exhibiting signs of a potential breakout. This bullish sentiment comes amidst a broader recovery in the cryptocurrency market, with Bitcoin regaining its footing above the crucial ,000 support level.
Technical Indicators Look Verdant
Renowned crypto analyst Jonathan Carter is among those betting big on LINK’s future. Chainlink’s price structure is forming a bullish pattern, Carter remarked, pointing to the token’s recent rebound from the middle line of a descending channel.
ChainLink is showing a bullish structure by bouncing off the middle line of a descending channel
A breakout above the MA 200 (around ) could push price towards the resistance zone near
pic.twitter.com/SmlGnbHkku
— Jonathan Carter (@JohncyCrypto) June 14, 2024

A decisive break above the 200-day moving average, currently hovering around , could propel LINK towards a resistance zone near , according to Carter’s analysis. This potential price surge is further bolstered by various technical indicators.
Mixed Market Sentiment With Underlying Bullishness
While the overall market sentiment leans slightly bearish, there are pockets of optimism surrounding Chainlink. The latest price forecast for LINK predicts a 4% increase to approximately .53 in the next coming days.
Interestingly, some analysts highlight a dichotomy in investor sentiment. Despite the recent price dip, a significant 30% of market participants still hold bullish views on LINK.
Market Smells Greed
Further fueling this optimism is the current reading of 74 on the Fear & Greed Index, which suggests a dominant sentiment of “greed” among investors. This indicates that despite short-term price fluctuations, investor confidence in Chainlink’s long-term potential remains strong.
While the current outlook for Chainlink is undeniably optimistic, experts urge investors to approach the market with caution. Price predictions, particularly in the highly volatile cryptocurrency space, are inherently subjective and susceptible to unforeseen circumstances. The broader market sentiment, currently reflecting “greed,” could also lead to a correction if investor expectations are not met.
Investors should always conduct their own research before making any investment decisions, advised a spokesperson for Chainlink. Understanding the underlying technology, the project roadmap, and the risks involved is crucial for navigating the dynamic world of cryptocurrencies.
Chainlink’s Core Strength
Despite the inherent volatility, Chainlink’s core value proposition as a secure and reliable oracle network for dApps remains a key driver of its long-term potential. By bridging the gap between decentralized networks and the real world, Chainlink plays a critical role in enabling the growth and adoption of decentralized finance (DeFi).
With a potential breakout on the horizon and renewed optimism in the crypto market, the coming weeks will be crucial in determining the token’s future trajectory. As the DeFi space flourishes, Chainlink’s ability to connect blockchains to external data feeds will undoubtedly be a factor to watch.
Featured image from Pexels, chart from TradingView
Scalpers Rejoice! Top Analyst Predicts Chainlink (LINK) Short-Term Surge
The Chainlink (LINK) market is abuzz with chatter after a popular cryptocurrency analyst issued a bearish forecast. In a recent analysis, CryptoWzrd predicted a continued downward trend for LINK in the coming days, but also hinted at a potential “scalping” opportunity for nimble traders.
Scalping refers to a high-frequency trading strategy where investors capitalize on minor price fluctuations within a short timeframe. CryptoWzrd believes the current bearish trend in LINK presents an entry point for such tactics. However, the analyst emphasized the need for a strong trading signal before recommending a scalp.
The next big move up from this level will be a significant indicator for the market as a whole, and LINK specifically, stated the analyst in his projection. This cryptic message has sent ripples through the crypto community, with traders eagerly awaiting CryptoWzrd’s next move.
LINK Daily Technical Outlook:$LINK closed bearish today and the next move from the current location will lead the way. I will be looking to get a quick scalp once there is a quality trade setup
pic.twitter.com/OIWSBqxGJM
— CRYPTOWZRD (@cryptoWZRD_) June 8, 2024
Analyst Evaluates Market Trends And Trajectories
His examination has garnered significant attention, particularly among active traders seeking an edge in the often-unpredictable cryptocurrency market. His focus on short-term trends and scalping opportunities resonates with those who favor a more hands-on approach compared to buy-and-hold strategies.

The analyst’s emphasis on quick scalps highlights the volatile nature of the cryptocurrency market. Unlike traditional investments, cryptocurrencies can experience significant price swings within minutes, making them ideal hunting grounds for scalpers with lightning-fast reflexes and a deep understanding of technical indicators.
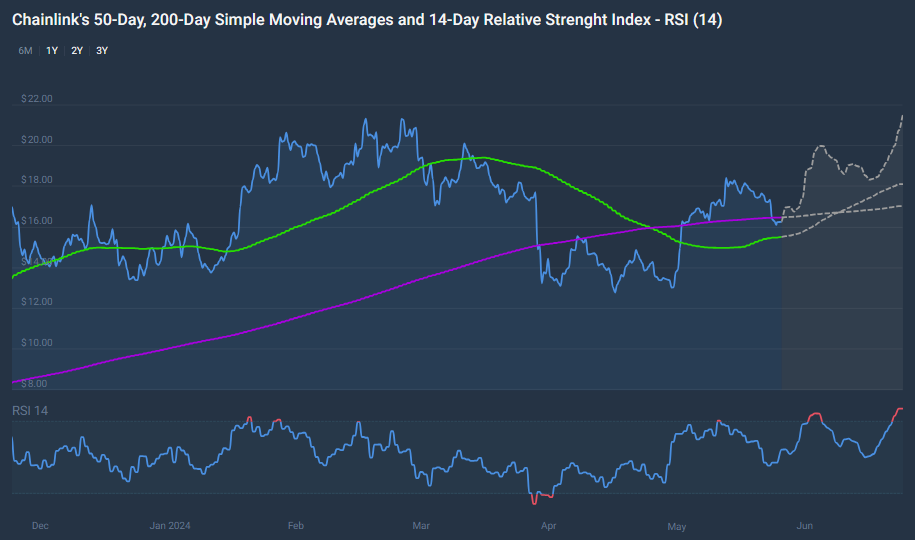
Chainlink 200-Day SMA Projected For Growth
Meanwhile, technical analysis predicts that Chainlink’s 200-day Simple Moving Average (SMA) will rise in the next 30 days, closing at .05 on July 9, 2024, while the short-term 50-Day SMA will close at .14 on the same day.
Furthermore, the Relative Strength Index (RSI) is neutral with a value of 45.80. According to the RSI, there is currently a market in a neutral mood for Chainlink, indicating that the cryptocurrency is neither overbought (above 70) nor oversold (below 30).
LINK Price Forecast
The current forecast for LINK suggests a potential price increase of 32%, reaching .53 by July 9, 2024. This optimistic outlook comes despite the present bearish sentiment indicated by technical outlook.
The Fear & Greed Index, standing at 75 (Greed), reflects a high level of investor confidence, typically associated with a bullish market phase. However, the contrast of bearish technical indicators and a greedy market sentiment highlights a discrepancy that investors should approach with caution.
Featured image from Pexels, chart from TradingView
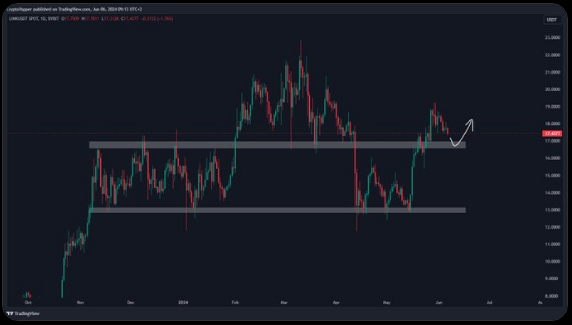
Chainlink Chain Reaction: Analyst Sets Sights On $33 Target
Chainlink (LINK), the oracle network powering decentralized applications (dApps), has been making waves in the crypto market. After a successful surge, the digital asset is now setting its sights on even higher ground, with analysts predicting a bullish run and price targets as high as .
At the time of writing, LINK was trading at .27, down 6.4% and 11.0% in the daily and weekly timeframes, data from Coingecko shows.
Support Levels And Re-accumulation Signal Bullish Trend
LINK’s recent price action has analysts excited. The token decisively broke through a key resistance level on the daily timeframe, a bullish indicator suggesting buyers are in control. Even more promising, the price then revisited this level, not as resistance, but as a new support zone. This “flip” from resistance to support strengthens the uptrend’s validity.
Adding fuel to the fire, LINK’s price has grown a healthy 25% in the last month. This significant gain reflects growing investor confidence in Chainlink’s potential. The overall sentiment surrounding the project seems to be shifting towards optimism.
$LINK Ready for a Retest!#LINK broke the resistance on the Daily timeframe and is probably going to retest it as support.
This would be considered bullish if the support holds.
Perfect and Healthy Price Action for #Chainlink pic.twitter.com/EaxDBpVK2T
— Crypto Yapper (@CryptoYapper) June 6, 2024
Analyst Sees LINK Soaring
Market sentinels are taking notice of LINK’s bullish momentum. Crypto Yapper, a popular analyst in the crypto space, believes a retest of the new support level is imminent. If the price holds firm at this point, it would be a strong confirmation of the ongoing uptrend. Yapper emphasizes the importance of this potential support in establishing a positive long-term outlook for LINK.
LINK Price Prediction
Meanwhile, based on the latest forecast, the price of LINK is projected to rise by 30%, reaching .71 by July 7, 2024. However, despite this optimistic price target, several technical indicators suggest caution. The current market sentiment for Chainlink is bearish, indicating short-term pessimism among investors.
Related Reading: VanEck Predicts Explosive Ethereum Growth: Could ETH Reach .2 Trillion?
Additionally, the Fear & Greed Index, which measures market emotions, stands at 77, reflecting “Extreme Greed.” Such a high level often signals that investors are overly confident, potentially preceding a market correction. Over the past 30 days, Chainlink has shown a 50% rate of green days and a 10.73% volatility rate, indicating a balance between gains and losses but also a moderate level of price fluctuations.
The Road Ahead For LINK
With all eyes on Chainlink, the next few weeks will be crucial in determining the validity of the bullish predictions. If LINK can overcome the technical hurdles and reach its price targets, it could be a sign of a resurgent market for the entire cryptocurrency industry.
Featured image from calheartmedical.com, chart from TradingView
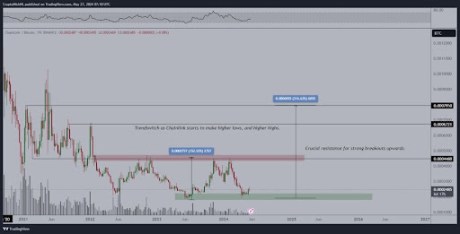
Chainlink Is Not Done: Analyst Predicts 300% Rise Against Bitcoin
A crypto analyst has highlighted the Chainlink remarkable resilience amidst market volatility, predicting that the cryptocurrency is getting ready to witness a 300% surge against Bitcoin, the world’s largest cryptocurrency.
Chainlink Poised For 300% Increase Against Bitcoin
Chainlink, a decentralized blockchain oracle network has been gaining traction recently, bolstered by the innovative developments within its ecosystem. Popular crypto analyst, Michael van de Poppe has expressed optimism about Chainlink’s native token, LINK, predicting a major bull rally for the cryptocurrency.
Sharing a price chart depicting Chainlink (LINK)/ Bitcoin (BTC) price movements from 2021 to 2025, Poppe forecasted in an X (formerly Twitter) post that LINK is on track to witness an exponential increase between 150% to 300% against BTC.
As of writing, the price of Bitcoin is trading at ,623, according to CoinMarketCap. The cryptocurrency has fallen below key support levels of around ,000 and reflects a slight decline of 1.05% in the last 24 hours.
Poppe has revealed that he would not be surprised if Chainlink reaches this price milestone, underscoring his confidence in the cryptocurrency’s price fundamentals and future potential compared to Bitcoin. In the chart analysis, the crypto analyst pinpointed a critical resistance level for LINK/BTC around .000448, indicating that this point could trigger strong breakouts upward for Chainlink.
In an earlier post, Poppe identified Chainlink’s next resistance zone at , predicting that the cryptocurrency could see its price trading between and in the coming months. For this to happen, the crypto analyst explained that Chainlink will have to establish a higher low on the weekly time frame.
Poppe’s optimistic outlook on Chainlink comes after the blockchain platform has initiated several strategic partnerships. Chainlink has collaborated with Circle, a peer-to-peer payments company, to expand developer usage of USDC and Euro Coin (EURC). Additionally, the blockchain platform recently allied with SWIFT, an interbank messaging system, to accelerate the adoption of Distributed Ledger Technology (DLT).
These innovative developments may serve as a catalyst for a potential price increase for the cryptocurrency, driven by enhanced network utility and increased adoption from new users.
LINK Price Update
Amidst broader market conditions, Chainlink has been performing better than expected, experiencing consistent price increases since the beginning of the year. Over the past month, Chainlink has risen by 45.01%, underscoring the cryptocurrency’s growing demand and interest from investors.
CoinMarketCap’s data has also shown that Chainlink has surged by 3.32% in the last 24 hours and 7.79% over the past week. This bullish performance can be said to be attributed to Chainlink’s ongoing development initiatives in its ecosystem alongside the recent approval of Spot Ethereum ETFs by the United States Securities and Exchange Commission (SEC).
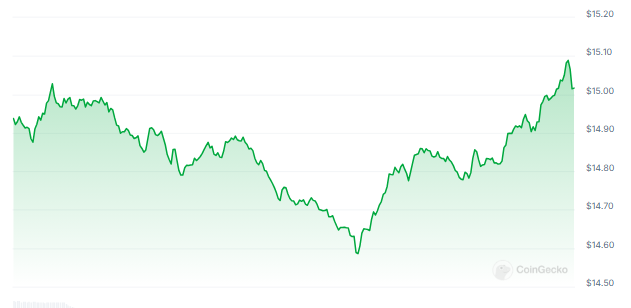
As of writing, the price of Chainlink is trading at .53, reflecting a 24-hour increase of 14.86% in its daily trading volume.
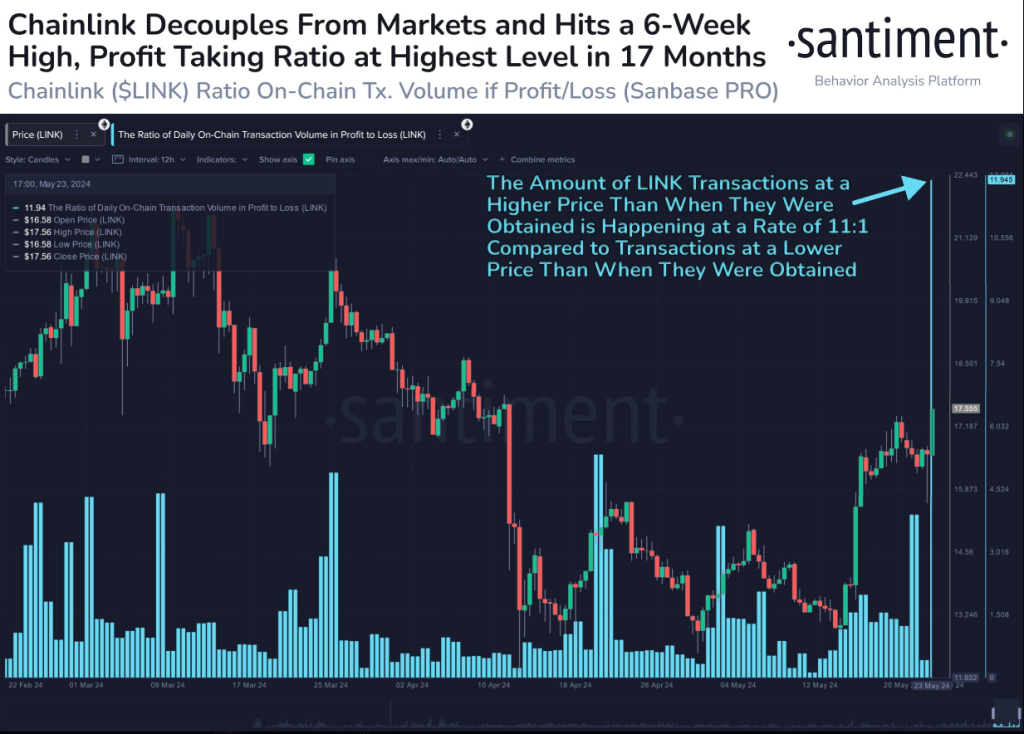
Chainlink On Fire: Price Nears $18, Profit Ratio Blazes To 2022 Levels
Chainlink (LINK), the oracle network powering decentralized finance (DeFi), is experiencing a solid rise, breaching a six-week high of .40. This surge comes amidst a wave of optimism fueled by the recent approval of an Ethereum exchange-traded fund (ETF) and speculation surrounding a potential Chainlink ETF.
Transactions And DeFi Dominance Fuel Rally
On-chain data reveals a strong buying sentiment for LINK, with a record 11 profitable transactions for every one at a loss. This surge in profitability coincides with the broader market’s positive reaction to the Ethereum ETF. Analysts believe this approval signals a growing institutional interest in cryptocurrencies, potentially paving the way for similar vehicles focused on specific projects like Chainlink.
#Chainlink has climbed well ahead of the #crypto pack, quickly surpassing .50 for the first time in 6 weeks. #Onchain today, there are 11 transactions in profit for every 1 $LINK transaction at a loss. This is the highest ratio since Dec. 8, 2022. https://t.co/nILlWsXWNh pic.twitter.com/joMV55V5x7
— Santiment (@santimentfeed) May 24, 2024

Tomi Point, a renowned crypto analyst, took to social media to express his belief that Chainlink could be the next beneficiary of the ETF boom.
Chainlink’s role in bridging the gap between DeFi and traditional finance makes it a prime candidate for an ETF. Point highlighted Chainlink’s robust DeFi ecosystem, boasting reliable data connections to over 20 blockchains, as a key factor driving its institutional appeal.
Technicals Flash Green
The current market sentiment surrounding Chainlink is overwhelmingly bullish. Despite the Fear & Greed Index hovering in “extreme fear” territory, most technical indicators point towards a sustained uptrend. As of May 24th, 2024, a majority of technical analysis tools confirmed a positive outlook for LINK.
Several analysts have weighed in with bullish price predictions. Digitcoinprice predicts LINK to reach .35 by the end of May, representing a staggering 117% increase. The overall optimistic outlook is bolstered by LINK’s impressive performance in the past month, with a price appreciation of over 16%.
Chainlink Whales Pour In Million More
Meanwhile, this week’s bullish fluctuations in whale activity on Chainlink are another important sign that shows how popular LINK and other Ethereum-hosted cryptocurrency projects are among investors.
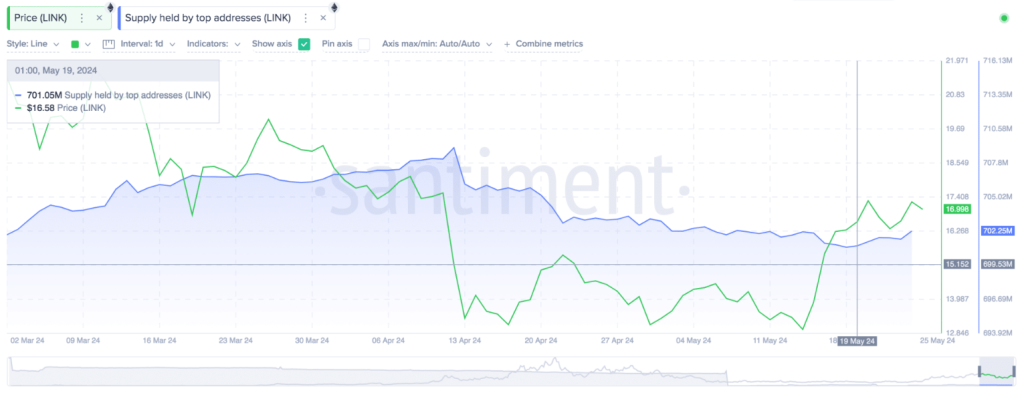
The Santiment graphic above displays changes in the balances of LINK tokens held by the top 100 largest wallets in real time.
As of May 19, the top 100 Chainlink investors held 701 million LINK tokens. By May 25, they had increased their holdings by over 1.2 million LINK, totaling 702 million.
Featured image from Texture X, chart from TradingView
Chainlink (LINK) Primed for Another Surge: Major Rally on the Horizon?
Chainlink’s LINK price is gaining bullish momentum above .50. The price could continue to move up if it clears the .50 resistance zone.
- Chainlink price is showing bullish signs and eyeing more gains above .00 against the US dollar.
- The price is trading above the .50 level and the 100-hourly simple moving average.
- There was a break above a key bearish trend line with resistance near .50 on the hourly chart of the LINK/USD pair (data source from Kraken).
- The price could start another increase if it clears the .50 resistance zone.
Chainlink Price Eyes Additional Upsides
In the past few days, Chainlink remained in a positive zone above the .00 level, like Bitcoin and Ethereum. There was a move above the .50 and .00 levels. A high was formed at .45 before there was a downside correction.
The price dipped below .50 and tested .35. A low was formed at .34 and the price recently attempted a fresh increase. There was a move above the .50 level. It even jumped above the 50% Fib retracement level of the downward move from the .45 swing high to the .34 low.
Besides, there was a break above a key bearish trend line with resistance near .50 on the hourly chart of the LINK/USD pair. Chainlink is now trading above the .50 level and the 100 simple moving average (4 hours).
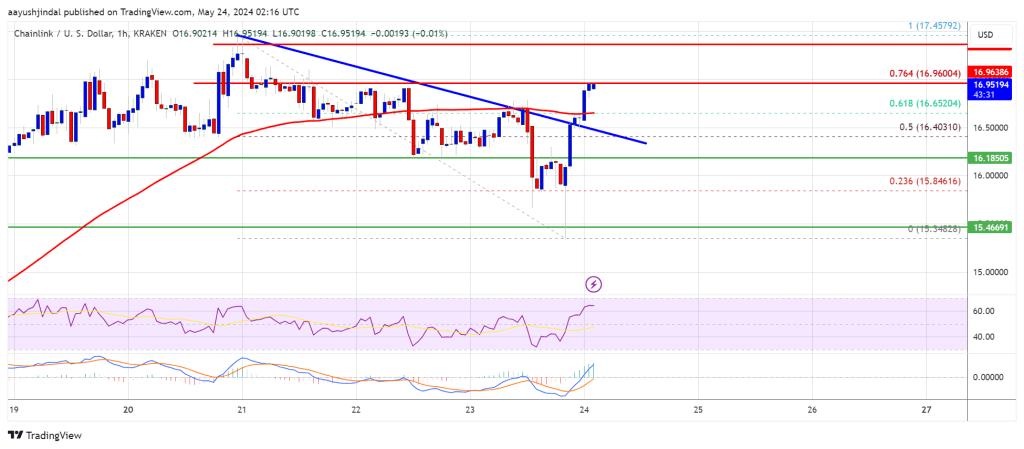
Immediate resistance is near the .90 level or the 76.4% Fib retracement level of the downward move from the .45 swing high to the .34 low. The next major resistance is near the .50 zone. A clear break above .50 may possibly start a steady increase toward the .20 level. The next major resistance is near the .80 level, above which the price could test .00.
Another Decline In LINK?
If Chainlink’s price fails to climb above the .50 resistance level, there could be a fresh decline. Initial support on the downside is near the .65 level.
The next major support is near the .20 level, below which the price might test the .50 level. Any more losses could lead LINK toward the .00 level in the near term.
Technical Indicators
Hourly MACD – The MACD for LINK/USD is gaining momentum in the bullish zone.
Hourly RSI (Relative Strength Index) – The RSI for LINK/USD is now above the 50 level.
Major Support Levels – .65 and .20.
Major Resistance Levels – .00 and .50.