 Ripple CEO Brad Garlinghouse has criticized SEC Chair Gary Gensler’s recent statements on the crypto industry, calling them “absolute nonsense.” The executive argued that Gensler’s actions and oversight failures could impact the upcoming election. He suggested that Gensler should be fired if he truly worked for the American people. Ripple CEO Brad Garlinghouse Criticizes SEC […]
Bitcoin News
Rapid Fluctuations in Bitcoin Fees Cause Brief Spike in Hashprice
 Bitcoin’s hashprice, representing the anticipated value of one petahash per second (PH/s) per day of hashing power, climbed to per petahash on June 8, marking the highest level since the halving. The increase derived from a rise in onchain fees. However, by the following day, bitcoin fees had substantially decreased, causing the hashprice to […]
Bitcoin News
Fantom Supply On Exchanges See Drastic Increase, A Cause For Alarm?
The Fantom (FTM) supply on exchanges has been rising in recent times, leading to speculations for what this might mean for the price of the cryptocurrency. Going by trends in the crypto market of when the exchange balances of a particular coin goes up, there might be some pain ahead for FTM investors.
Fantom Supply On Exchanges Rise By 16 Million
The Fantom price had increased over the last month to reach a new three-year high above .2. However, this rally was only short-lived and the altcoin has begun to eliminate its gains from the month of March gradually in the past week.
One culprit for this decline in price is the high level of selling that have been taken place among FTM holders, majority of which have been holding their coins for a rather long time. As a result, the available supply of Fantom on centralized exchanges continued to balloon as investors rush to sell off their tokens and capitalize on gains.
Data from the on-chain tracking website Santiment shows that in the last week of March, there was a considerable number of FTM flowing into centralized exchanges. This saw their available balance go from around 654 million to over 670 million in the space of a week, with over 16 million flowing into exchanges.
This inflow trend coincides with the drop in the Fantom price from above .1 to .84, suggesting that it is indeed the selling pressure from these FTM investors that is responsible for the price decline. Given this, there would have to be a reversal in this selling trend is the FTM price is to recover from here.
Bullishness On FTM Not Dead
The inflow of millions of FTM into centralized exchanges is bearish, but this could only last for the short term. As a rule of crypto, eventually, these sellers will run out of coins to sell, leaving room for demand to catch up with the available supply. At this point, the FTM price will begin to see a reversal in the trend.
There is also the fact that adoption has been increasing on the Fantom chain as founder Andre Conje has been actively talking about it on X (formerly Twitter). Santiment’s data shows that the FTM holder base also grew alongside the price in March. In the week of March 17 and 28 alone, the chain’s holder BASE jumped from 109,000 to over 111,000.
This shows that while the trends are bearish right now, there could be a change soon as the price could resume another leg up. The Fantom price has also established support at .8 which could serve as the bounce point for another rally.
Presently, the FTM price is sitting at .84, with a 5.48% and 18.2% decline on the daily and weekly charts, respectively. Its market cap is at .37 billion, making it the 51st largest cryptocurrency in the space.
Chainlink Breeds New Whales As $49.9 Million Accumulation Spree Cause Prices To Surge
Chainlink (LINK) has traders buzzing as its price has been up by 40% since the last week of January, massively outpacing the broader cryptocurrency market. Amidst this price spike, mysterious whale wallets have been topping up their holdings, as evidenced by on-chain data.
According to blockchain tracker Lookonchain, there’s been a massive outflow of LINK from crypto exchange Binance in the past two days, particularly with 49 new wallets receiving 2,745,815 LINK within this timeframe.
Massive LINK Accumulation Occurs On Binance Before Withdrawal
Details from Binance point to an ongoing accumulation of LINK from the crypto exchange. In the middle of this accumulation, a particular whale or institution has been going on a buying spree, gobbling up more than 2.7 million LINK tokens worth .9 million. This accumulation came days after the Lookonchain noticed that four new wallets had withdrawn over 119,583 LINK tokens worth over .15 million from Binance.
Whales/institutions continue to accumulate $LINK!
This mysterious whale/institution withdrew 2,745,815 $LINK(.9M) from #Binance via 49 new wallets.
Whale”0x2A19″ withdrew 494,957 $LINK(M) from #Binance in the past 10 days.https://t.co/QoP2waErBShttps://t.co/iaPHa9f0XB pic.twitter.com/GUW1S33NHf
— Lookonchain (@lookonchain) February 7, 2024
Similarly, Lookonchain noted that another whale address “0x2A19” has withdrawn 494,957 LINK tokens worth million from Binance in the past 10 days. Notably, whale transaction tracker Whale Alerts has also noted some accumulation of LINK tokens from other crypto exchanges.
800,000 #LINK (14,701,915 USD) transferred from #Bybit to unknown wallethttps://t.co/RQEu3CxLVM
— Whale Alert (@whale_alert) February 7, 2024
Analytics platform Santiment also noted that LINK whale addresses have upped their activity amidst the price surge as large amounts of coins were moved by previously stagnant wallets. This influx of tokens back into the network’s circulation, coupled with a minor liquidation of wallets, seems to have contributed to the price spike.
#Chainlink has jumped ahead of the #altcoin pack after some previously dormant wallets created the highest Age Consumed spike (5.38B, calculated by multiplying coins moved by the amount of days those coins had been dormant). This influx of $LINK back into the
(Cont)
pic.twitter.com/eHVpeJz2HW
— Santiment (@santimentfeed) February 1, 2024

How Will New Chainlink Whales Impact Price Action Going Forward?
The crypto industry is currently going through a modest price gain led by Bitcoin recently breaking above the ,000 level again. As a result, the industry is now up by 3.25% in the past 24 hours, with a 22.60% increase in trading volume.
LINK hasn’t been left out of this price gain, registering a 4.30% gain in the past 24 hours. However, LINK has been on a sustained breakout since January, reaching as high as .68 on February 5.
The price spike isn’t particularly surprising, as fundamentals of the Chainlink ecosystem point to a steady price growth for LINK. Chainlink’s role in DeFi and NFTs with its smart contracts oracles cannot be overstated. Chainlink also recently released its Staking v0.2 protocol in December, allowing investors to stake a minimum of 1 LINK for a base floor reward rate of 4.5% per year in LINK.
Consequently, the massive accumulation of LINK by whales is a very bullish signal for the token’s price action going forward. These large investors see LINK’s long-term value and potential and are loading up their bags in anticipation of higher prices.
Bitcoin News Catalyst: Could ETF Hype Cause BTC Price To Double?
Bitcoin price is struggling to crack resistance around ,000 per coin, but it might not be long until it does thanks to the backdrop of bullish spot BTC ETF news. The news could also be supported by a change in mass crowd psychology, according to Elliott Wave Principle and the current projected count in BTCUSD. All of this could cause the top cryptocurrency by market cap to double in a flash.
The Countdown To Bitcoin Price Doubling
During every major bull run, there is a phase where the rally is supported by the regular occurrence of bullish Bitcoin news. If it all seems to arrive at once, this is due to the way mass crowd psychology works, according to Elliott Wave Principle.
When an asset, in this case BTCUSD, reaches what’s referred to as an impulse wave, humans begin to behave in an impulsive way, selling at the first sign of a correction, and buying every minor pump that ultimately gets retraced. Because so many market participants are entering during this phase, things get extra volatile.
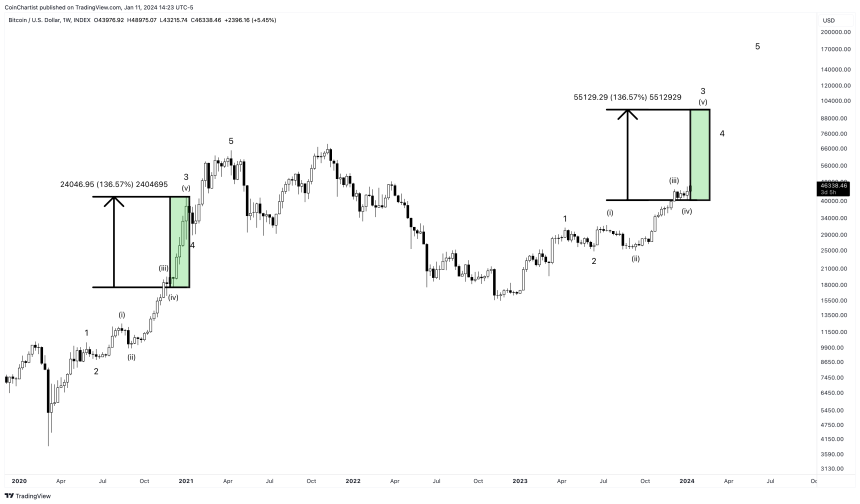
If this sounds familiar, this is precisely what’s going on with Bitcoin now, and it’s only going to pick up momentum as ETF-related investments are revealed. Compare the chart below referencing BTCUSD now versus late 2020. During the green box, bullish news was breaking all day long.
Show Me The Charts, And I’ll Tell You The News
An onslaught of big companies began buying BTC, such as MicroStrategy, Tesla, and Square. From the bottom of what is labeled wave (iv) in BTCUSD to the top of wave (v) in 2020 into early 2021, the first ever cryptocurrency went on a 136% run. This caused price to more than double from around ,000 to ,000.
Today, Bitcoin is in a similar wave count, with news catalysts ready to help propel the crypto market higher. If the Elliott Wave Principle count is accurate, BTCUSD could see a similarly move where it doubles in a matter of a month. Another 136% increase from here would take BTC to around ,000 per coin and complete wave (v) and wave 3.
Wave 3’s are commonly referred to as an impulse wave. An impulse wave can be sub-divided into five sub-waves. When the powerful wave 3 ascent is over, only a short-lived wave 4 sharp correction should follow, at which point wave 5 will begin and complete the cycle.
Litecoin Bear Flag Could Cause 41% Crash To This Level, Analyst Explains
An analyst has explained that a bear flag is potentially forming for Litecoin, which, if confirmed, might cause a decline for LTC to this level.
Litecoin Could Be In Danger Of Deep Decline Due To This Bear Flag
In a post on X, analyst Ali has pointed out a possible bear flag taking form for Litecoin. A “bear flag” is a pattern in technical analysis that, as its name implies, looks like a flag on a pole.
The pattern takes shape when the asset observes a sharp downward move and follows it up with a period of consolidation. This consolidation happens toward a slight overall uptrend, meaning that its upper level is created by connecting higher highs, while the lower line joins together higher lows.
The downtrend prior to the consolidation makes up for the pole, while the channel looks like a flag. Inside the flag, the price is naturally likely to feel resistance at the upper level, while support is at the lower one.
The bear flag is popularly considered a continuation pattern, meaning that the downtrend would continue after the pattern forms. This continuation happens as the price finally ends its consolidation and crashes through the lower level of the flag.
Like the bear flag, there is also the “bull flag,” which forms in the opposite circumstances. In the case of this pattern, the price breaks out with a sharp upward move after the consolidation period toward the downside finishes.
Now, here is the chart shared by the analyst that sheds light on a possible bear flag forming in the 3-day price of Litecoin:
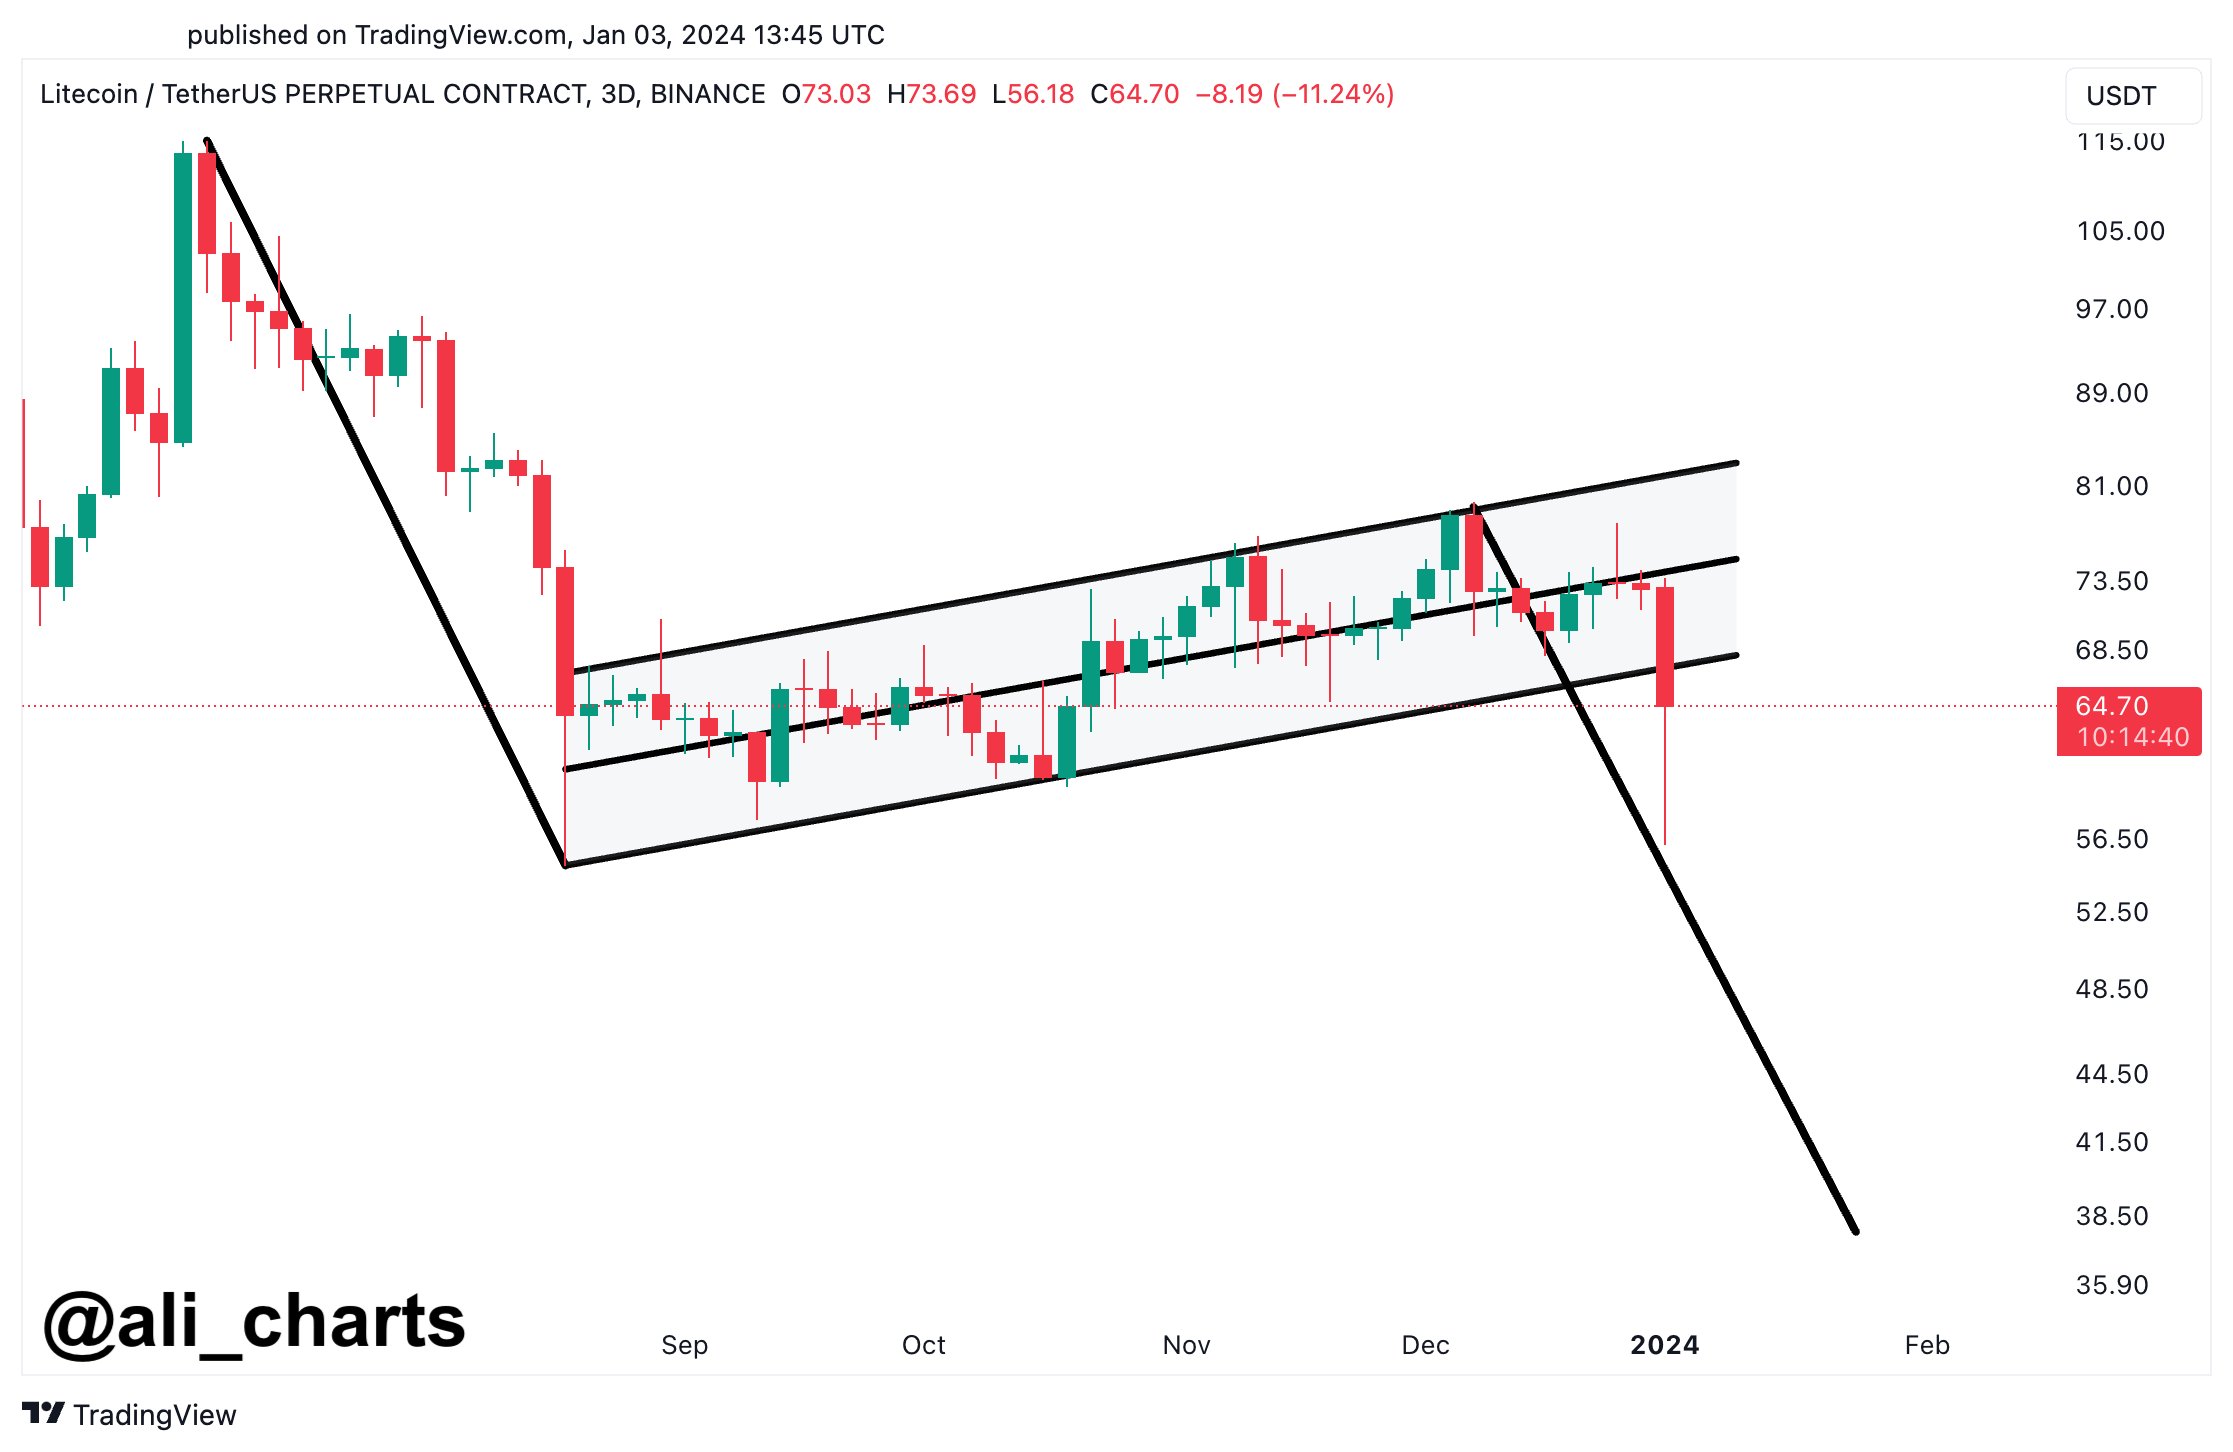
From the graph, it’s visible that Litecoin’s 3-day price has possibly been consolidating inside a bear flag during the last few months. With the latest crash in the asset, though, the price appears to finally be breaking out of the pattern towards the down direction.
This plunge in the coin has occurred as the rest of the cryptocurrency sector has also reverberated with a crash. Unlike many other assets, however, LTC never enjoyed any sharp rally to kickstart the year, so the plummet has been especially damaging for it.
“Post-recent dip, the outlook for Litecoin appears challenging,” notes Ali. “If the selling pressure continues, LTC might see a push down to , potentially confirming a bear flag formation.”
Generally, breakouts from any flag pattern are of about the same length as the preceding pole, which is why the analyst has selected this target. If Litecoin’s potential drawdown does play out in this fashion, then the asset would have seen a decrease of more than 41% from the current price levels.
LTC Price
Litecoin had been floating above the mark just earlier, but following this 11% crash, the coin is now down to just .
Nobel Prize Winner Robert Shiller Warns Confiscating $300B in Russian Assets Might Cause a ‘Cataclysm’ for the Dollar System
Nobel Prize winning economist Robert Shiller has warned against the effects that the confiscation of Russian assets in Western countries might have on the stability of the dollar-dominated financial system. According to Shiller, a move of this kind might cause a cataclysm, opening the doors for countries that use the dollar as a reserve currency to move their treasuries to other currencies.
Robert Shiller Fears Cataclysmic Events
The confiscation of Russian assets frozen by Western countries due to sanctions following the Russia-Ukraine conflict might trigger a chain of events that would affect the strength of the U.S. dollar-led financial system. This is the opinion of Robert Shiller, winner of the 2013 Nobel Prize in Economic Sciences, who is openly inviting the Biden administration to ponder more carefully about the results of such a measure.
In a recent interview offered to the Italian newspaper La Repubblica, Shiller declared that other nations might assume that if the U.S. does this with Russia, it can do it with any other country, weakening its position in the world economy.
Shiller explained:
This will destroy the halo of security that surrounds the dollar and will be the first step towards de-dollarization, which many are increasingly confidently leaning toward, from China to developing countries, not to mention Russia itself.
Shiller also detailed this move would confirm the Russian claims that this is indeed a proxy war, backfiring against the U.S. and turning it into a “cataclysm” for the current dollar-dominated financial system.
Furthermore, while he claims this can be “morally right,” he acknowledges many unknowns regarding this move, and that it is better to think about it “very carefully.”
According to NYT, the Biden Administration is pressing Britain, France, Germany, Italy, Canada, and Japan to come up with a strategy to achieve the confiscation of more than 0 billion in Russian assets before February 24, a date that will mark the beginning of the third year of the recent Russia-Ukraine conflict.
In April, Bank of Russia governor Elvira Nabiullina stated that while Russia had moved to stockpile reserves in non-U.S. seizable assets, it was still working to retrieve 0 billion.
What do you think about Robert Shiller’s opinion on a possible Russian asset confiscation? Tell us in the comments section below.
Mt. Gox Repayment Rumors Cause Bitcoin Price To Drop To $42,000, Market In Turmoil
Mt. Gox, the infamous Bitcoin exchange that suffered a major hack over a decade ago, has allegedly finally begun the process of repaying its customers for the 850,000 lost Bitcoin. This news has sent shockwaves through the market, causing a momentary disruption in the Bitcoin price uptrend.
As a result of these developments, the current price of Bitcoin stands at ,625, with a 24-hour trading volume of ,655,498,534.64.
However, the market has witnessed a -2.40% decline in the past 24 hours, reflecting the uncertainty caused by the Mt. Gox repayment proceedings.
Bitcoin Price Plunges Amidst Mounting Speculation
Reports from participants in the mtgoxinsolvency subreddit group indicate that some individuals have already received payouts in yen via PayPal.
However, those who opted for cash deposits into their bank accounts have not reported any inflows as of yet. Several users have shared notifications they received, alerting them to a system error that resulted in double payments.
These users are now allegedly being requested to return the excess funds to the Rehabilitation Trustee promptly.
Moreover, the Rehabilitation Trustee has reached out to affected individuals to refund the mistakenly transferred amount, which was the second transfer, as the first transfer was the official repayment.
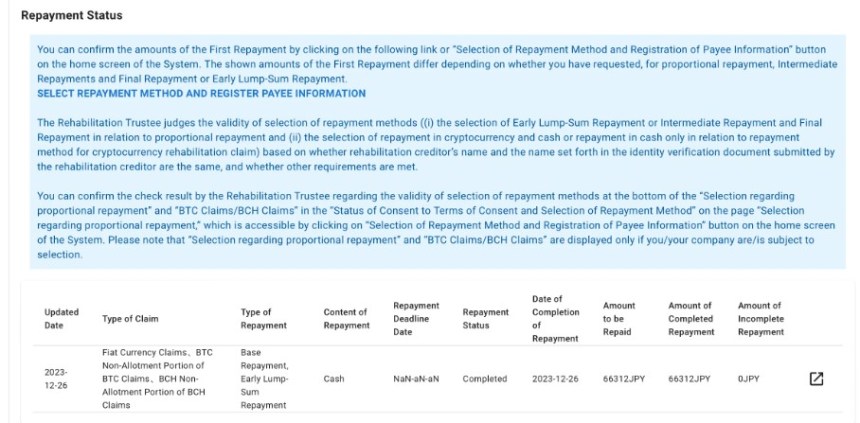
Users have been instructed to use PayPal’s “Refund” feature to return the funds to the Rehabilitation Trustee’s account. Alternatively, they can transfer an equivalent amount of money to the Rehabilitation Trustee’s PayPal account if the “Refund” feature is unavailable.
While some users have confirmed receiving their repayments, there is uncertainty surrounding the timing of Bitcoin reimbursements or if they are taking effect.
No Bitcoin Outflows Detected From Mt. Gox?
In a recent statement by CryptoQuant co-founder and CEO, Ki Young Ju, it has been confirmed that “no Bitcoin outflows have been recorded from the Mt. Gox Trustee wallet at this time.”
Furthermore, the trustee responsible for managing the rehabilitation proceedings of Mt. Gox, the now-defunct Bitcoin exchange, has yet to provide any official statements explaining the absence of outflows from the wallet.
Consequently, the cryptocurrency community finds itself on edge, eagerly awaiting updates regarding the timing and method of Bitcoin reimbursements.
Once again, the cryptocurrency community has been hit by another bout of misinformation surrounding the long-awaited Mt. Gox exchange repayment to its customers.
The spread of this news has had a notable impact on market sentiment and has stirred volatility in the Bitcoin price. The future timeline and potential effects of the exchange’s repayment, slated for 2024, remain uncertain.
Featured image from Shutterstock, chart from TradingView.com
Crypto Alarm: XRP’s Trade Volume Hits Six-Year Low, A Cause For Concern?
A significant dip in XRP daily trading volume has caught the attention of investors and analysts alike. On Thursday, XRP’s trading volume plummeted to levels not seen in the past six years, a development that has raised eyebrows among crypto enthusiasts.
On this day, December 21st, #XRP : pic.twitter.com/ptHRTpkEeE
— WrathofKahneman (@WKahneman) December 22, 2023
Just XRP Or Industry-Wide Slump In Trade Volumes?
Reputed lawyer and XRP advocate, Bill Morgan, took to X (formerly Twitter) to shed light on this concerning trend highlighted by WrathKahneman. According to WrathKahneman, the trading volume of XRP on December 21 stood at approximately 1.9 billion, a stark contrast to the .4 billion witnessed in 2022 and drastically lower than .3 billion recorded in 2020.
What is most interesting or concerning about those figures is the daily XRP volume is lower on this day for this year and not this day in any of the previous 6 years. https://t.co/oQpr7avC54
— bill morgan (@Belisarius2020) December 22, 2023
This decline has sparked a debate over the implications for the token’s market dynamics and investor sentiment. While the decline in XRP’s trade volume has become a focal point for discussions, it is important to note that this trend isn’t isolated to XRP alone.
Mr. Huber, a recognized figure in the crypto world, pointed out that leading cryptocurrencies such as Bitcoin and Ethereum are also experiencing similar plunge in trade volumes. This broader market trend suggests a possible shift in the trading activities across the crypto landscape.
Media reports corroborates Mr. Huber’s assertion, indicating that Bitcoin’s trade volume as of August 28, 2023, had reached its lowest in four years. This pattern, reflected across multiple major cryptocurrencies, hints at a more complex market dynamic that extends beyond XRP.
XRP’s Current Market Performance
Despite the concerns over trading volume, XRP has exhibited resilience in its market price. Over the past 24 hours, the digital asset has seen a near 1% increase, with its trading price hovering around .61.
Although it experienced a 4.6% decline over the past two weeks, XRP’s performance over the past month shows a 3.8% increase. Currently, its trading volume has continued to decline further standing at about .3 billion, maintaining a relatively steady state compared to last Friday’s .2 billion.
Furthermore, Mr. Huber’s observation that the downturn in trading volume isn’t unique to XRP was echoed by another user, MoonLambo on X. This user, responding to Bill Morgan’s post highlighting what could be either interesting or concerning, supported Mr. Huber’s view by adding, “I disagree.”
MoonLambo disclosed that there is nothing concerning and that the plunging trading volume is not unusual or worrying. They point out that considering the vast number of days (around 2,200) over the past six years, focusing on just six specific days’ data is too narrow to draw meaningful conclusions.
According to their analysis of the all-time XRP/USD price chart, they note a consistent pattern where both XRP’s price and trade volume increase as market activity heats up. This pattern has been observed consistently over a decade, not only for XRP but also for other major cryptocurrencies like BTC and ETH.
MoonLambo further assert that the current state of XRP’s volume is typical and expect a significant increase in trade volume when XRP experiences its next market rally.
I disagree. This is not the least bit concerning. Nearly 2,200 days have passed in the last 6 years. Each day is a data point, and you’re only looking at 6 data points while ignoring the rest. You can’t draw a useful conclusion from such limited data here.
Look at the chart… pic.twitter.com/lvEnRfKs8t
— Moon Lambo (@MoonLamboio) December 22, 2023
Featured image from Unsplash, Chart from TradingView
Cardano Experiences Decline In Q3 Network Activity – Unraveling The Root Cause
Cardano, one of the prominent blockchain networks, experienced a mixed bag of performance during the third quarter of the year, leaving investors and enthusiasts intrigued about its future trajectory. While certain metrics presented a less-than-stellar picture, there are emerging indicators that suggest the potential for a positive turnaround.
In this article, we look into Cardano’s Q3 performance, examining stagnant metrics, the impact they have had, and the potential price direction that could shape its future.
The Impact Of Stagnant Metrics
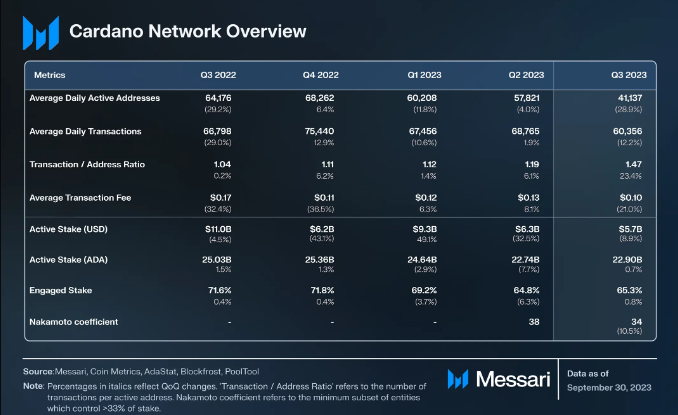
In the realm of cryptocurrencies, metrics play a crucial role in determining the health and vitality of a blockchain network. Cardano’s performance in Q3, as shown in Messari’s analysis, revealed some concerning trends, albeit not entirely bleak. The average transaction fee on the Cardano network, denominated in US dollars, saw a 29.9% decrease, dropping from .13 to .10, suggesting a reduction in the cost of network usage.
One of the more significant concerns was the decline in daily active addresses. Between July and September, the average count of daily active addresses plummeted by 29%, from the 58,000 recorded during the year’s second quarter to 41,137. This decline raises questions about the network’s ability to maintain user engagement and activity levels.
Fees denominated in Cardano’s native token, ADA, also fell by 3% quarter-over-quarter (QoQ), indicating that users may have been transacting with smaller amounts of ADA due to lower fees. Furthermore, the network’s revenue took a hit, falling by a substantial 30%, which could raise concerns about its overall financial stability.
Cardano’s Chart Signals Optimism
Amidst the stagnant metrics and challenges faced in Q3, Cardano’s chart on TradingView paints a different narrative, hinting at the potential for an upward momentum. The Relative Strength Index (RSI) for Cardano is on an upward trajectory, approaching the overbought territory. While this might typically be seen as a signal for a potential pullback, it should be considered in the context of Cardano’s recent price performance and external factors.
The moving averages on the chart provide further cause for optimism. After a period of sideways movement, the price appears to be making an effort to break above the long-term resistance trendline. This, combined with the formation of higher lows on the chart, creates a potentially bullish scenario, suggesting that Cardano may be gearing up for a significant price move.
Potential Price Direction
As of the most recent data from CoinGecko, Cardano (ADA) is trading at .290817. In the last 24 hours, the price experienced a dip of 3.8%, while over the past seven days, it saw a 2.8% rise. These short-term price movements indicate a level of volatility and uncertainty in the market.
Cardano’s performance in Q3 had its fair share of challenges, with stagnant metrics and declining user engagement. However, the positive signals on the trading chart and the potential for an upward momentum suggest that Cardano may be poised for a price breakout.
(This site’s content should not be construed as investment advice. Investing involves risk. When you invest, your capital is subject to risk).
Featured image from Shutterstock