 The UK Financial Conduct Authority (FCA), in collaboration with the Metropolitan Police Service, conducted an operation leading to the arrest of two individuals, aged 38 and 44, suspected of running an illegal crypto asset exchange. It is believed that over £1 billion of unregistered crypto assets were traded through this business, the FCA said on […]
Bitcoin News
Altcoins: Analyzing Key Signs For A Potential Boom – Or Bust
Altcoins are generating significant buzz among cryptocurrency watchers, as rumors of a potential Bitcoin breakout circulate. After weeks of sluggish trading, a recent surge of capital has revitalized the king of coins. This raises a pressing question: will altcoins ride the wave, or are they doomed to be left behind?
Whispers Of A Bitcoin Bonanza
Data from Farside Investors reveals a significant shift in investor sentiment. Nearly 0 million flowed into Bitcoin exchange-traded funds (ETFs) on June 4th, a clear sign of renewed interest. This surge in buying could act as a catalyst, sparking a wave of speculation and propelling Bitcoin prices upwards.
However, the question remains: how will this newfound focus on Bitcoin impact the broader cryptocurrency market? Historically, strong Bitcoin rallies have often been followed by altcoin seasons, periods where alternative cryptocurrencies experience explosive growth. But is this time different?
Altcoin Season: Just Over The Horizon?
The Altcoin Season Index, a metric that gauges market sentiment towards altcoins, currently sits at a lowly 35. This stands in stark contrast to the readings of 80 observed just six months ago. This suggests that altcoins are not yet basking in the reflected glory of Bitcoin’s potential rise.
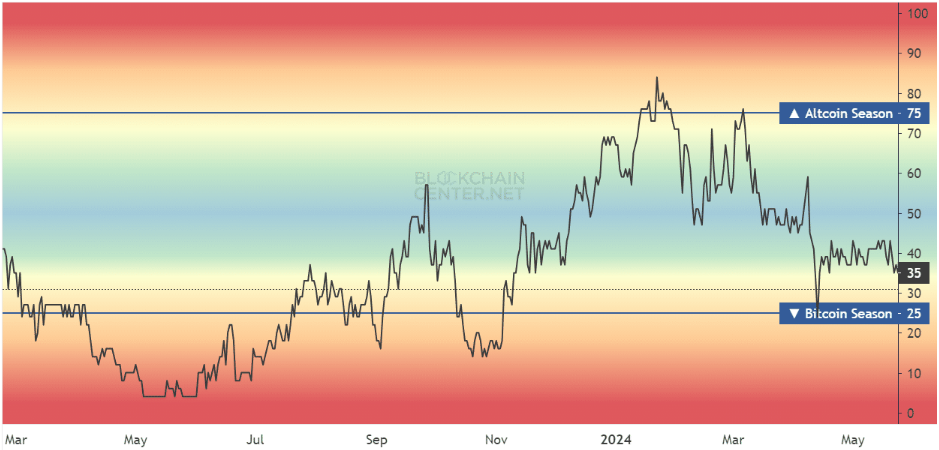
Experts believe that even with a Bitcoin surge, only a select few altcoins are likely to outperform the market leader. To truly unleash an altcoin season, the Altcoin Season Index would need to climb above 75, a sign of widespread bullishness across the entire altcoin ecosystem.
Why Altcoins Might Struggle To Shine
The sheer number of altcoins compared to previous cycles also throws a wrench into the altcoin season equation. In 2017 and 2021, for instance, the altcoin market was a much smaller pond. When Bitcoin surged, investor money flowed more readily into a smaller pool of altcoins, leading to significant price increases across the board.
Today, the landscape is vastly different. With thousands of altcoins vying for investor attention, any gains during an altcoin season might be concentrated in just a handful of high-performing projects, leaving the vast majority behind.
Bitcoin Dominance: A Key Indicator To Watch
Another crucial factor to consider is Bitcoin Dominance (BTC.D). This metric reflects Bitcoin’s market capitalization as a percentage of the total crypto market cap. Historically, a significant decline in BTC.D has coincided with altcoin seasons. In early 2021, for example, the coin’s dominance level plummeted from 70% to 40%, paving the way for a period of explosive altcoin growth.
Currently, however, BTC.D is on the rise, suggesting that altcoins are not yet the center of attention. Investors looking for altcoin opportunities should keep a close eye on this metric, as a sustained downtrend in the crypto’s dominance could be a harbinger of an approaching altcoin season.
Featured image from Indiana Daily Student, chart from TradingView
Banks Bust, Bitcoin Booms: Price Skyrockets 40% During US Banking Crisis
Bitcoin, the enigmatic digital currency, is back in the spotlight as the US banking system grapples with mounting stress. While some predict a stratospheric rise to million per coin, fueled by economic woes, others remain skeptical.
Banking On Bitcoin’s Rise?
Bitcoin advocates see it as a beacon of stability in a storm. Unlike traditional assets tied to the health of institutions, Bitcoin boasts a finite supply and decentralized nature. This, they argue, positions it perfectly to benefit from a “flight to safety” scenario, where investors seek refuge from a potentially collapsing banking system.
The recent history seems to support this narrative. In March 2023, the failures of prominent institutions like Silicon Valley Bank coincided with a 40% surge in Bitcoin’s price within a week. Industry figures point to this as evidence of Bitcoin’s role as an “uncorrelated asset class” – a hedge against traditional financial turmoil.
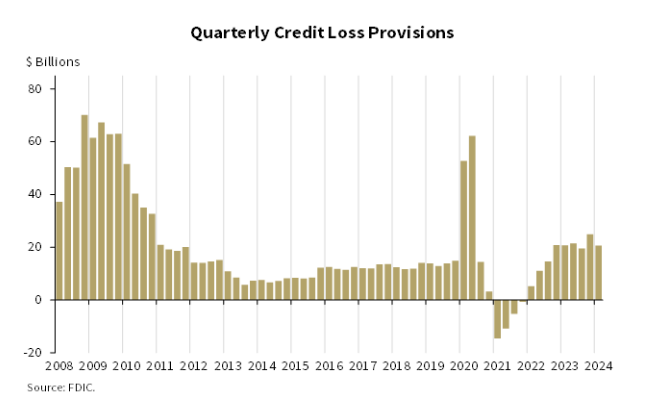
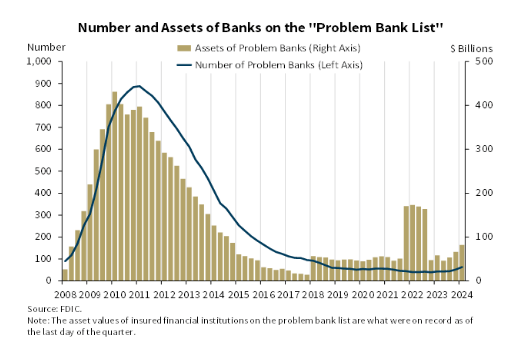
Further bolstering this argument is the latest report by the Federal Deposit Insurance Corporation (FDIC). The report paints a concerning picture, highlighting a worrying trend of unrealized losses on securities held by US banks.
These losses, driven by rising interest rates, have ballooned to over 0 billion. Additionally, the number of banks on the FDIC’s “Problem Bank List” has grown from 52 to 63 in just one quarter, raising fears about the overall health of the sector.
Million-Dollar Dream Or Flight Of Fancy?
While the potential for Bitcoin to gain value seems undeniable, the ambitious price target of million faces strong headwinds. Experts warn that such a dramatic surge might come at the cost of a full-blown economic meltdown, a scenario that wouldn’t necessarily benefit Bitcoin in the long run.
Furthermore, Bitcoin’s historical correlation with other assets is not static. While periods of weak correlation exist, there have also been instances of strong correlation, particularly during broader market downturns. This casts doubt on Bitcoin’s ability to completely decouple itself from a struggling traditional financial system.
Another factor to consider is the recent uptick in the M2 money supply, a metric representing the total money circulating in the economy. Historically, periods of M2 expansion have coincided with Bitcoin price increases. However, the interplay between money supply and Bitcoin in an environment with a potentially shaky banking system remains an open question.
The Road Ahead For Bitcoin
Bitcoin’s future is a bit of a guessing game right now. Banks in the US are having some problems, and that could make Bitcoin more valuable. But if the whole economy goes downhill, even Bitcoin might suffer. So, it all depends on how bad things get with the banks and the economy in general.
Featured image from Pngtree, chart from TradingView
Ukrainian Police Bust International Crypto Fraud Ring, 14 Arrested
 Ukrainian authorities have dismantled a criminal ring defrauding citizens across Ukraine, Moldova, Kazakhstan, and the European Union through deceptive call centers promising lucrative cryptocurrency investments. The National Police of Ukraine detained 14 suspects, including the alleged organizers, and seized 12 luxury cars, 136 units of computer equipment, 951 SIM cards, 455 starter packs, and significant […]
Bitcoin News
Malaysian Authorities Bust Syndicate Accused of Laundering Fraud Proceeds via Cryptocurrency
 Law enforcement officials in Malaysia recently arrested ten individuals linked to a criminal syndicate that allegedly used cryptocurrencies to launder fraudulent proceeds. Assets, including motor vehicles, valued at more than .7 million were seized, and bank accounts holding approximately .8 million were frozen. Syndicate Accused of Channeling Illegally Acquired Funds into Malaysia Authorities in Malaysia […]
Bitcoin News
Bitcoin Back Above $63,000: Will FOMO Fuel Another Rally Or Lead To A Bust?
The Bitcoin price made a strong comeback on Friday after witnessing a significant amount of bearish pressure throughout the past week. On Wednesday, May 1, the premier cryptocurrency fell below the ,000 mark for the first time in almost two months.
On Friday, May 3, the price of BTC recovered above the ,000 level, going as high as ,000 in the past day. However, the question is – can the Bitcoin price enjoy a sustained rally following this latest resurgence?
How Long Will The BTC Price Rally Last?
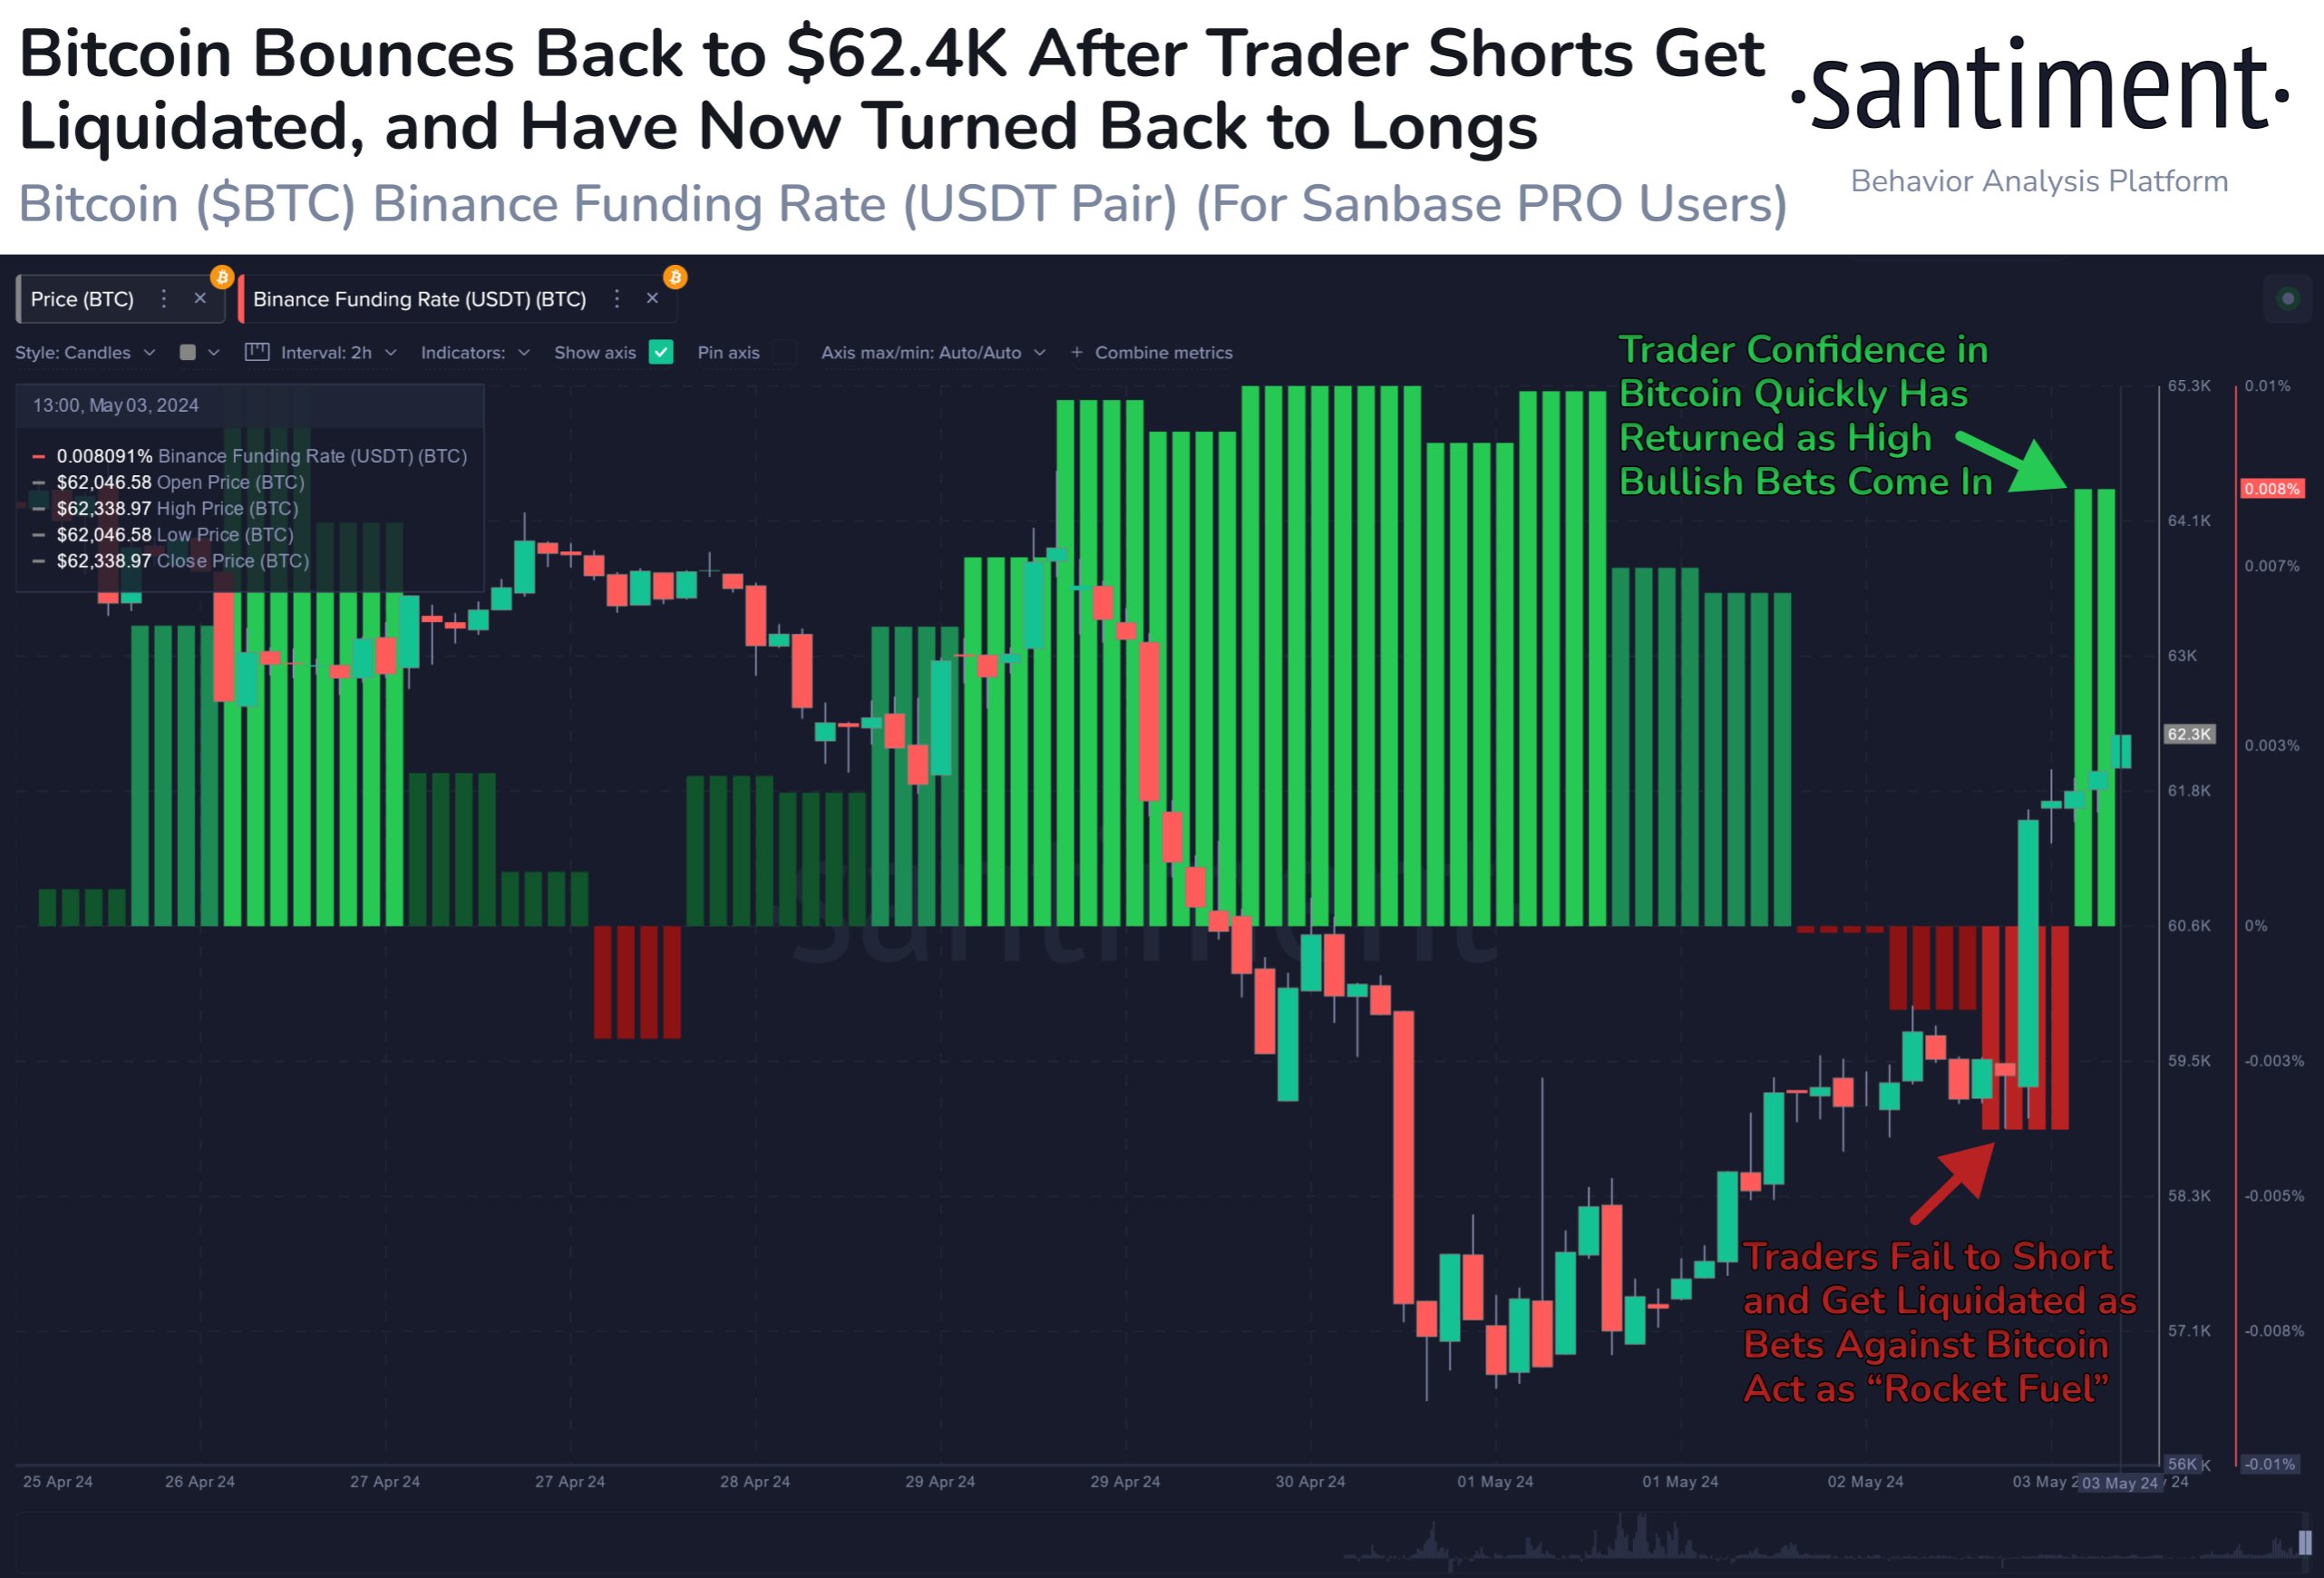
In a recent post on the X platform, Santiment pointed to a shift in investors’ position and sentiment on the Bitcoin price following the recent surge above ,000. According to the on-chain analytics site, traders on the Binance platform are “going from liquidated shorts to longs” after the latest price increase.
While this shift in sentiment might signal renewed optimism in the premier cryptocurrency, Santiment sounded a warning bell for enthusiasts watching the Bitcoin price and looking to get into the market. The blockchain firm said in its post:
For the rally to continue, we don’t want to see FOMO rising too much higher than what it appears to be now.
FOMO, or “fear of missing out,” is a phenomenon where investors hastily purchase in-demand assets out of fear of missing out on potential gains. While it can drive the asset to a higher price in the short term, excessive FOMO often results in unsustainable bullish trends and subsequent downturns.
What’s more, crypto prices tend to move in the opposite direction of the crowd’s expectations. Hence, if the majority of traders are betting on the Bitcoin price to rise, there is a great likelihood that the cryptocurrency’s value will experience a drop.
Behind The Bitcoin Price Surge
As of this writing, the Bitcoin price stands at around ,871, reflecting a substantial 6% increase in the last 24 hours. Although the catalyst for this latest Bitcoin rally remains unclear, on-chain data shows that recent whale activity might have triggered the bullish momentum.
In a recent post on X, CryptoQuant CEO and founder Ki Young Ju revealed that Bitcoin whales acquired 47,000 BTC in a single day. Ju also said that while this class of investors might have included ETF-associated addresses, the recent spike in “balances for whale addresses” is not ETF-related.
#Bitcoin whales accumulated 47K $BTC in the past 24 hours. We’re entering a new era. pic.twitter.com/SXgzToN8GU
— Ki Young Ju (@ki_young_ju) May 3, 2024
100x Or Bust? Solana Investors Bet Big On This Wild Memecoin
The world of cryptocurrency can be a curious place. While established coins like Bitcoin and Ethereum, and even Solana dominate headlines, a new breed of tokens – meme coins – have captured the imagination (and wallets) of a growing number of investors. These coins, often featuring playful mascots and fueled by online hype, can experience explosive growth, but also come with a significant risk of volatility and even scams.
Enter Slothana (SLOTH), the latest Solana-based meme coin making waves in the crypto community. Launched just recently, Slothana has garnered significant attention during its ongoing presale, exceeding its initial fundraising target and raising nearly million at the time of writing.
This early success has fueled speculation of a massive price increase, with some crypto enthusiasts predicting a staggering 100x gain after the presale concludes.
Attention, fellow sloths! Poll time. Should we launch on DEX only, embracing the true spirit of decentralization and lazy trading? Or should we go full throttle, hitting up both CEX and DEX like the overachieving sloths we could be? Cast your vote below #slothana #memecoin
— Slothana (@SlothanaCoin) March 29, 2024

Solana Memecoin Mania
Solana, a high-speed blockchain platform, has become a breeding ground for meme coins. Unlike established blockchains like Ethereum, Solana offers faster transaction speeds and lower fees, making it an attractive platform for launching new meme coins.
This year alone, several Solana meme coins have experienced phenomenal growth. For instance, Smog (SMOG), another meme coin launched on Solana in February, witnessed a nearly 8,000% increase in value for early investors.
To the moon
— SMOG (@SMOGToken) March 26, 2024

This success story has fueled optimism surrounding Slothana, with some speculating a connection between the two projects. A recent “To The Moon” comment from Smog’s official social media account has ignited rumors that the same team may be behind Slothana, further boosting investor confidence.
Can Slothana Avoid The Pitfalls?
Meanwhile, the risk of rug pulls – where developers abandon a project after raising funds through a presale – is a significant concern in the meme coin space.
While Slothana’s presale structure appears transparent, with a “fair launch pricing system” offering equal opportunity to acquire tokens, thorough research into the project’s team and roadmap remains crucial.
Riding The Bitcoin Halving Wave?
An additional factor potentially influencing Slothana’s future is the upcoming Bitcoin halving scheduled for later this month. Historically, Bitcoin halvings, which reduce the number of new Bitcoins entering circulation, have been followed by periods of bullish momentum for the entire cryptocurrency market.
This has often led to a surge in meme coin prices as well, as investors seek out high-risk, high-reward opportunities. If Slothana launches on exchanges before or shortly after the halving, it could benefit from this meme coin frenzy.
Featured image from Pexels, chart from TradingView
Is SUI Price Stability Under Threat Due To Transactional Boom And Bust?
Sui network’s persistent growth propelled it into the league of the top 100 cryptocurrencies by market capitalization, but the value of the SUI token has been on a downward trajectory. Sustaining this heightened market position presents difficulties, as demonstrated by the recent performance of the Sui token’s value.
Sui token is currently priced at .591478, according to CoinGecko, with a 0.3% drop in the past 24 hours and a 6.0% decrease over the past seven days.
The Sui network experienced a big surge, reaching unprecedented heights before undergoing a sharp decline recently. Have other indicators and the token’s valuation borne the impact of this plunge?
Sui Network’s Transaction Surge And Diverging Trends
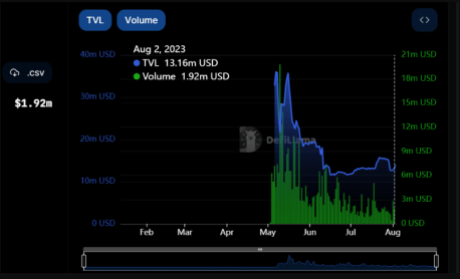
A recent report indicates an interesting pattern in the Sui network’s daily transaction block numbers, which commenced in early July. Starting at around 200,000, the transaction count surged to 500,000 and dramatically jumped to over 6 million within a day.
This peak brought the total transactions to an impressive 65.8 million, accompanied by an all-time high for the platform and its blockchain.
However, the excitement was short-lived as the transaction count quickly settled at approximately 720,000. Interestingly, the network’s activity volume showed a minor decline, stabilizing at about million.
The Total Value Locked (TVL) took a different trajectory. Despite the transaction surge, the TVL demonstrated a subtle upward trend, currently at around million, according to DefiLlama.
Assessing Sui Token’s Stability And Prospects
The Volatility Gauge evaluates recent trends, allowing it to form a score that reflects the current market dynamics rather than being skewed by isolated fluctuations. This methodology provides a more comprehensive understanding of the token’s price behavior.
As noted in a separate analysis, the SUI token demonstrates a moderate level of volatility. A low score on the Risk/Reward Gauge complements this average volatility.
This pairing indicates that while the token experiences moderate price swings, it is also safeguarded against undue price manipulation. This confluence of factors presents a balanced perspective on the token’s risk and potential rewards.
Related Reading: Shiba Inu Price Poised To Reach .01 With Shibarium Upgrade, These CEOs Say
Looking ahead, the Sui token’s price is favorably poised. The support level is thoughtfully established at .568754, which signifies a point where downward pressure could find a halt.
On the other hand, the resistance level is strategically set at .606822, indicating the end at which selling pressure might increase.
This positioning offers Sui token an advantageous space to navigate before encountering significant selling pressures. It suggests that the token has room to flourish within this range, indicating a positive trajectory soon.
(This site’s content should not be construed as investment advice. Investing involves risk. When you invest, your capital is subject to risk).
Featured image from Ethereum World News
Macro Strategist David Hunter Predicts Global Markets’ ‘Melt Up’ Surge in Q4 2023, Followed by Impending ‘Bust’
David Hunter, the chief macro strategist at Contrarian Macro Advisors, predicts an interesting development for global markets in the fourth quarter of 2023. According to him, global markets will experience a remarkable surge, aptly described as a “melt up.” However, this surge will be short-lived, as a substantial downturn is expected to follow. Hunter emphasizes that after this rise and fall, we won’t witness the same lofty peaks of the 41-year secular bull cycle for many years to come.
Contrarian Macro Advisors Exec Anticipates Global Markets’ ‘Melt Up’ in Q4 2023, Warns 80% Downturn Will Follow
In an interview with Kitco News’ lead anchor and editor-in-chief, Michelle Makori, David Hunter delved into the realm of the economy, unraveling a compelling narrative of a potential “melt up” scenario. Renowned for his remarkable knack for forecasting economic cycles and identifying market trends ahead of the curve, Hunter unveiled his forecast.
He painted a picture of the S&P 500 soaring by a staggering 36%, while the value of gold would ascend to ,000 per ounce by October. However, Hunter cautioned that these bullish scenarios will be fleeting, as an imminent and significant market bust looms on the horizon, paving the way for a profound recession.
“My S&P target is six to seven thousand,” Hunter explained during his interview with Makori. “My targets are gold to ,000 pre-bust and silver to pre-bust … We’ll probably see most of the melt-up move by the end of the summer, which could mean Labor Day, but it could stretch into September.”
So what exactly is a melt up? Traditionally, these market phenomena resemble bull traps, serving as deceptive and unreliable signals of an impending market surge. The gains experienced during a melt up are often viewed with skepticism because, despite the temporary upward momentum, the underlying fundamentals of the market continue to deteriorate. Throughout history, melt-ups have frequently paved the way for subsequent meltdowns, reminiscent of the notable ‘Fall Melt-Up of 2011,’ aptly dubbed the ‘Great Surprise.’
Hunter suggests that we have found ourselves nearing the culmination of a significant 41-year secular bull run that commenced in 1982. Hunter stressed:
That is when the disinflation trend began and interest rates peaked out. I think the highs of this bull market will not likely be seen again for decades.
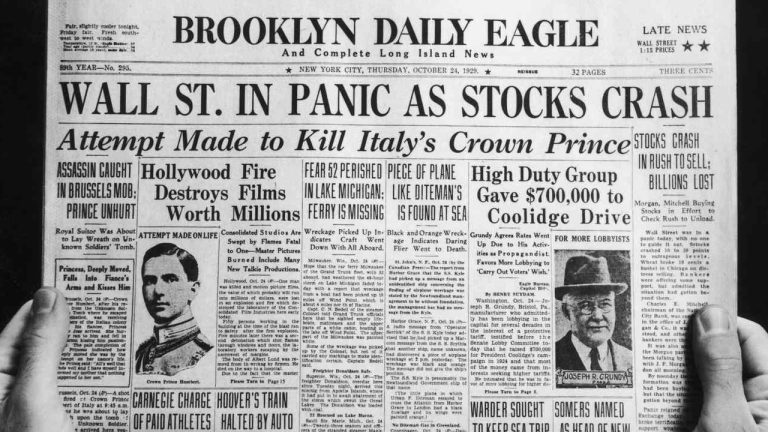
Throughout the turbulent economic history of the United States, significant transformations such as the notorious ‘Great Depression’ and the formidable ‘Great Recession’ were marked by the occurrence of tantalizing melt-ups. These preludes to market busts enticed investors with their deceptive allure. Prior to the infamous stock market crash in 1929, an extended period of prosperity propelled stock prices to unprecedented heights, witnessing a staggering quadrupling in value from 1920 to 1929. Fueled by misguided optimism, investors fell victim to the illusory signals of the melt-up, succumbing to the temptation of borrowing extensively to pour more funds into the market.
According to Hunter, the U.S. Federal Reserve’s implementation of quantitative tightening measures has surpassed the optimal threshold, pushing it into the realm of going “too far.” Economist Steve Hanke echoes this sentiment, as he recently emphasized that the current monetary tightening bears an uncanny resemblance to the contractionary policies witnessed in “1938 or 1939.” In a recent interview, Hanke drew attention to the parallels between the present circumstances and the historical instances of economic shrinkage. While speaking with Makori, Hunter insists “We are in uncharted territory.”
“The formula is, really, economic fragility caused by the pandemic, plus potentially the biggest policy error [over-tightening] in history by central banks, and plus leverage,” Hunter said. “You’ve got a formula which takes a normal recession into something far worse.”
Hunter explained that the type of “bust” he envisions will entail markets recording an 80% drawdown, and while he predicts gold will reach an all-time high this year, precious metals like gold and silver will drop back to today’s levels. “I don’t think very many assets are going to be able to escape a deflationary bust,” Hunter added. The macro strategist concluded, however, that gold and silver will see upsides following the bust, and both could rise ten times higher in value after the bottom.
What are your thoughts on David Hunter’s forecast of a ‘melt up’ followed by a significant market downturn? Share your thoughts and opinions about this subject in the comments section below.
Build Base Or Bust? Bitcoin Touches Down On Parabolic Support
Bitcoin price is trading in the mid-,000 range, unable to get through ,000 but still holding strong the higher the recovery goes. The series of higher lows continues, potentially creating another base for the cryptocurrency to blast off from.
This base would mark the third out of four before the “selling point” according to how parabola works in financial markets. But this is all contingent on Bitcoin price holding a very crucial curved support line, extending from the asset’s bear market bottom. Take a look.
Will The Bitcoin Parabola Break Or Blast Off From Here?
The king of cryptocurrency is stuck – between new highs and new lows, so the market is undecided and fearful despite the high prices. Several signs point to the peak at ,000 being the top of the cycle, which would mean targets fell significantly short of the hundreds of thousands of dollars per coin which were expected before it was all said and done.
Related Reading | Bitcoin Golden Cross: Everything You Need To Know About The Bullish Signal
The hope is that what was witnessed in April around the time when Coinbase Global went live on the Nasdaq is instead a mid-cycle pullback before the rest of the rally resumes.
Will a base build or the curve bust through? | Source: BTCUSDT on TradingView.com
During each bull market cycle, a series of higher lows keeps the cryptocurrency climbing until the trend ends. According to where the latest higher low as potentially formed, it could clarify a parabolic curve that could carry the asset to higher prices eventually.
Elliott Wave Supports Theory And 0K Target At Cycle Top
In a comparison with a parabolic curve “step-like formation” diagram, Bitcoin formed base one at the bottom. A much longer base two formed following the June 2019 peak that clearly in hindsight wasn’t the top.
The third base could be in process now, with the bottom being the bounce below ,000. With higher lows forming the parabolic curve pictured above, the recent selloff during the day Bitcoin became legal tender in El Salvador, could have been one last test of the curve before the cryptocurrency’s bull run continues, or a more a deeper drop is to follow once the curve breaks.
Even on lower timeframes, Bitcoin is holding the curved support | Source: BTCUSDT on TradingView.com
Bitcoin is even retesting that curve on lower timeframes at this very moment, so there may be more clue as to direction soon enough. Down very well could be the direction. The macro environment is bearish, several altcoins are experiencing strong pullbacks after ridiculous rallies, and the dollar is gaining strength.
If parabolic support holds, however, a line drawn across past mid-cycle peaks could provide clues as to where the cycle eventually ends.
Elliott Wave is added to the parabola to support the target | Source: BTCUSDT on TradingView.com
Throw in some Elliott Wave Theory and there is a potential roadmap that could follow. Major corrections tends to fall back to the previous cycle’s wave four. Drawn from that wave four across the top of what would ultimately be wave one and wave three in the current cycle, should pin-point about where wave five could stop.
Related Reading | Bitcoin Price “Pitchfork Channel” Could Pin-Point The Last Dip Ever
Wave three is usually the longest and easiest to spot of the bullish trend. Wave five should match the Fibonacci structure of wave one. That would take Bitcoin exactly to that line, which runs around 8,000 per BTC – but only if it also continues to follow the parabolic curve drawn above.
Breaking through now could create a wider, lengthened parabola at new lows, meaning base three failed. If it didn’t, it will cause the asset to at least double in price before the top is in, which means a lot closer to the six figures analysts have been predicting for years now.
Follow @TonySpilotroBTC on Twitter or via the TonyTradesBTC Telegram. Content is educational and should not be considered investment advice.
Featured image from iStockPhoto, Charts from TradingView.com
NewsBTC