 Rich Dad Poor Dad author Robert Kiyosaki has urged investors to ditch the U.S. dollar and buy bitcoin alongside gold and silver. He warned that “baby boomers’ retirements are going broke as paper assets crash.” The famous author stressed: “I do not trust anything that can be printed.” Robert Kiyosaki’s Latest Warnings and Advice The […]
Bitcoin News
Bitcoin Whale Books $217 Million Profit After BTC Broke $73,000
The ongoing Bitcoin surge is proving lucrative for a crypto whale. According to Lookonchain data on March 13, one large BTC address has raked in 7 million in profits after prices rose above ,000 earlier today. Profits would have even been higher because, over the past, the whale has been unloading large amounts via Binance, the world’s largest crypto exchange.
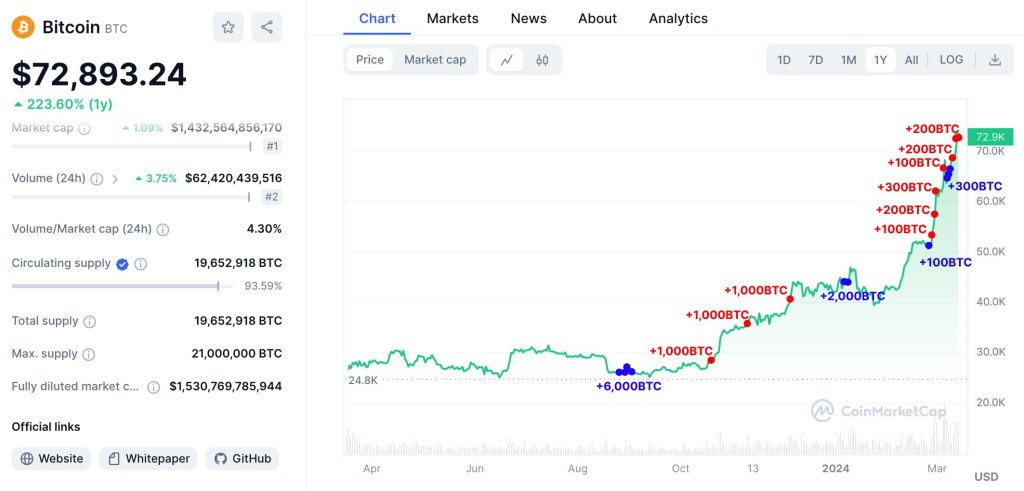
This development follows Bitcoin’s solid growth. Since October 2023, the coin has been steadily rising, fueled by supportive fundamental events, including interest rate expectations from the United States Federal Reserve and the approval of spot Bitcoin exchange-traded funds (ETFs) by the United States Securities and Exchange Commission (SEC).
BTC Is Rallying, Whale Books 7 Million Profit
Coupled by bullish holders, expecting more gains ahead and after halving, the coin has been rapidly inching higher, exceeding expectations. The previous all-time high of around ,800 was broken on March 13 when the coin broke higher, rallying above ,000.
This expansion comes after a strong price correction in the New York session on March 12. However, with confidence still in the market, prices rallied strongly during the Asian market, pushing prices above ,800 to as high as ,700.
While traders clipped fluctuations, the anonymous whale took full advantage of the rally after months of HODLing. Lookonchain data shows that the whale began accumulating Bitcoin on August 24, 2023, at an average price of ,854, before withdrawing and depositing 4,300 BTC at an average price of ,534.
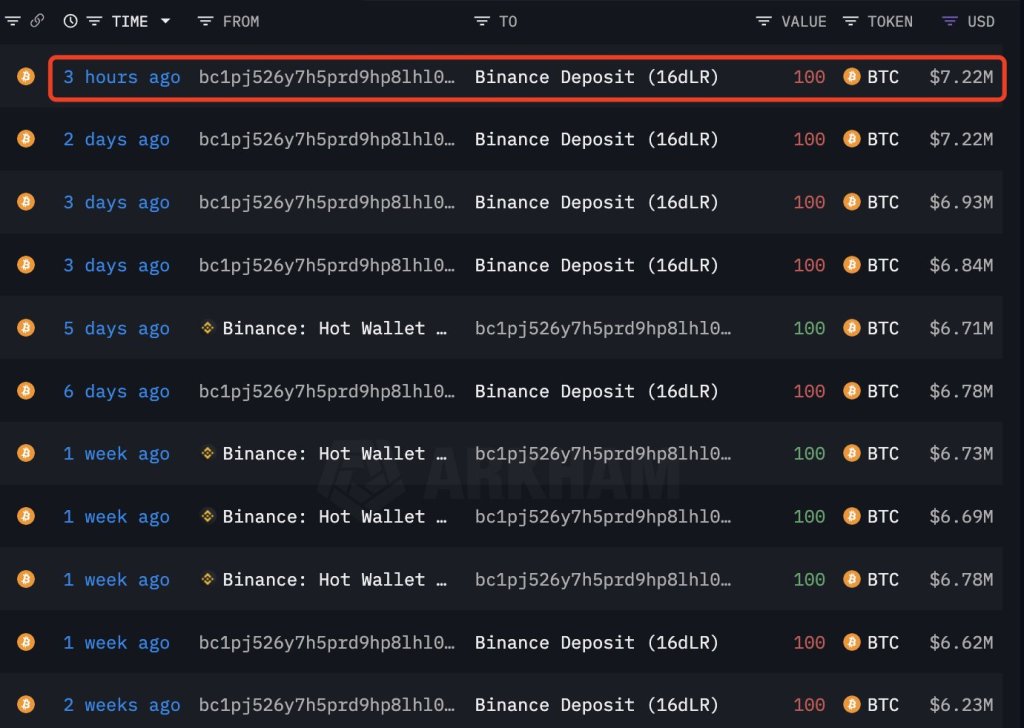
The address currently controls 4,300 BTC worth over 3 million and is 7 million in profits. The whale withdrew 100 BTC worth .22 million via Binance on March 13, possible to book profits.
BlackRock And Wall Street Driving Bitcoin Demand
Whether the whale will withdraw more and consolidate profits remains to be seen. However, considering the overall optimism across the market, the address could register more gains.
The crypto community expects the deluge of capital from institutions to continue in the weeks ahead. So far, BlackRock, through its IBIT spot Bitcoin exchange-traded fund (ETF) product, controls over 205,000 BTC. There is more demand from other issuers like Fidelity and Ark Invest.
Beyond that, the rising demand from pension funds, mainly in the United States, would further drive prices higher, lifting HODLers’ valuation. This week, the business intelligence firm MicroStrategy said it was also buying more coins after raising 0 million from investors.
Analyst Says Bitcoin Just Broke A Bullish Megaphone Pattern, What Are The Implications?
Bitcoin continues to maintain its bullish momentum even after some corrections following the breach above ,000. Despite rising almost ,000 in 30 days, the bullish sentiment has still not waned, especially among crypto analysts, who continue to expect more bullish strides from the cryptocurrency.
Bitcoin Breaks Bullish Megaphone Pattern
In a new analysis, crypto analyst TradingShot has referred to a peculiar pattern that the Bitcoin price has broken. According to the analyst, the crypto broke above a very bullish megaphone pattern, something that has been keeping the price muted for a while now.
As TradingShot explains, this megaphone pattern is important because it has been the pattern that has held Bitcoin back since it first made a local high on October 24. So a break out of this pattern is understandably very bullish for the price.
“The previous Bullish Megaphone of September – October technically served as a consolidation belt before the price broke upwards to deliver a +31.86% peak from the Megaphone’s last Higher Low and +40.50% from its first Low,” TradingShot said.
Breaking out of the megaphone pattern suggests that there is more upside to come. If it goes as expected, then the crypto analyst believes that the BTC price could still make another move toward the ,000 price target.
A Likely Path For BTC Price
The next stop for Bitcoin now would be to clear the ,000 resistance which has remained elusive. However, this may soon be a problem of the past going by TradingShot’s analysis which suggests a breakout is on the horizon.
“The ROC shows a similar behavioral structure between the two patterns. If it continues this way, then a new +31.50% leg will make a perfect contact on 48220, which is the March 28 2022 High,” the crypto analyst explained.
They further add that this is “essentially the Bear Cycle’s first Lower High and a key Resistance level of the current Bull Cycle.” Given this, “Technically, as long as the 1D MA50 (blue trend-line) holds (has been doing so since Sep 28), that is a realistic end target for this bullish wave.” TradingShot stated.
Another crypto analyst known as Tony The Bull seems to be on the same bullish trend. In a Wednesday analysis, Tony reveals that “the green stair-stepping TDST support in Bitcoin hasn’t been broken since 2018.” As the analyst explains, the same primary bullish trend continues to apply even now.
“IMO, we are dealing with the same active primary trend, much more advanced and mature than anyone is expecting – hence why we are already lifting off while others wait for the halving,” Tony explained.
Note the green stair-stepping TDST support in #Bitcoin hasn’t been broken since 2018
IMO, we are dealing with the same active primary trend, much more advanced and mature than anyone is expecting – hence why we are already lifting off while others wait for the halving pic.twitter.com/Kga99uWSoy
— Tony “The Bull” (@tonythebullBTC) December 6, 2023
LINK Price Broke Critical Level, Macro Downtrend Behind? Analyst Forecasts
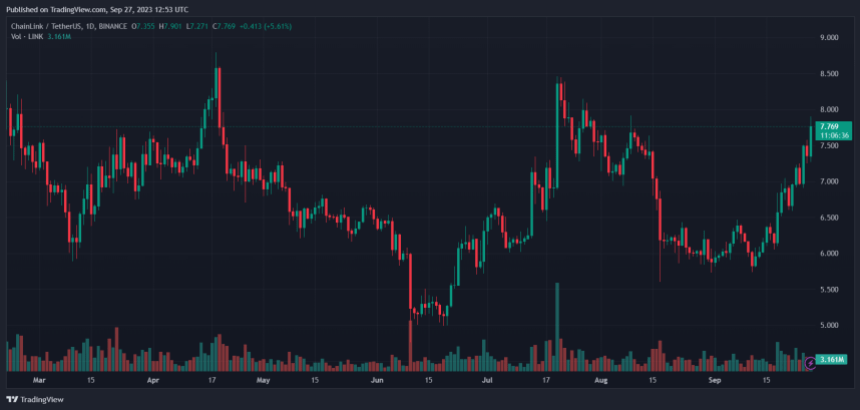
The LINK price has been the best performer in the crypto top 20 by market cap over the past week, data from Coingecko shows. The cryptocurrency recently broke out of a critical level and a downtrend and seems poised to re-capture previously lost territory.
As of this writing, the LINK price trades at .70 with a 4% profit in the last 24 hours. Over the previous week, the cryptocurrency recorded a 12% profit while other tokens in the top 20 have mostly seen losses, with Bitcoin Cash (BCH) standing as the exception along with Chainlink.
LINK Price About To Start Uptrend?
When the LINK price broke below in early 2023, the cryptocurrency began to descend to its current levels. The price struggled to stabilize around .5, but once buyers stabilized the cryptocurrency around those levels, the token formed a sideways trend.
Since May this year, the LINK price has been moving in this trend with a high of around . The chart below shows that trader Rekt Capital believes the token’s recent price action spells good news for LINK holders.
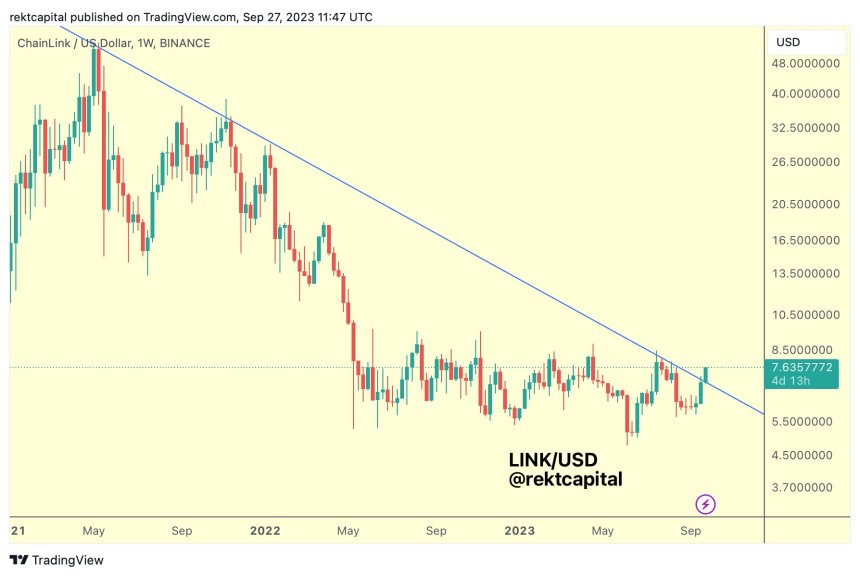
The chart above shows that LINK broke above an essential trend after closing a weekly candle above . Thus, the cryptocurrency could rise to .5 before meeting any critical resistance.
If the token can extend its gains, the next target could see LINK hitting .5 as an ultimate stand for bears to take back control and prevent a full-on bull run above .
As of this writing, the crypto market, at least its two most important tokens, Bitcoin (BTC) and Ethereum (ETH), are playing along on short timeframes. These cryptocurrencies recorded a 2% and 2.4% profit in the last 24 hours.
Stars Align For Chainlink
In addition to the favorable winds in the crypto market, the Chainlink platform is strengthening its fundamentals. Today, the platform launched its Cross-Chain Interoperability Protocol (CCIP) on the Coinbase-backed second-layer network Base.
This integration is set to onboard more applications and use cases on the Chainlink network. Thus, the underlying asset could benefit from greater appreciation in the long run. John Eid, Chief Business Officer at Chainlink Labs said the following about the integration:
Base and Chainlink are both building on the forefront of blockchain development as we work to bring the next wave of millions of new users into our industry. The scalability and technological creativity of Base as a layer 2 solution, combined with an ever increasing number of Chainlink services, is a boon for developers looking to build the next generation of cross-chain applications and services.
Cover image from Unsplash, Chart from Tradingview and Rekt Capital
Robert Kiyosaki Warns US Economy Not Strong, America Broke — Says He Still Prefers Bitcoin

Rich Dad Poor Dad author Robert Kiyosaki says the U.S. economy is not strong and America is broke. Noting that the stock market is going up because President Joe Biden raised the debt ceiling, he emphasized that he still prefers gold, silver, and bitcoin.
Robert Kiyosaki’s Latest Economic Warnings
The author of Rich Dad Poor Dad, Robert Kiyosaki, is back with more warnings about the U.S. economy. Rich Dad Poor Dad is a 1997 book co-authored by Kiyosaki and Sharon Lechter. It has been on the New York Times Best Seller List for over six years. More than 32 million copies of the book have been sold in over 51 languages across more than 109 countries.
Kiyosaki slammed the Wall Street Journal in a tweet on Sunday for claiming that the U.S. economy is strong. He explained that the stock market is up because President Joe Biden signed into law the agreement to raise the debt ceiling. Emphasizing that “America is broke,” he emphasized that he still prefers gold, silver, and bitcoin.
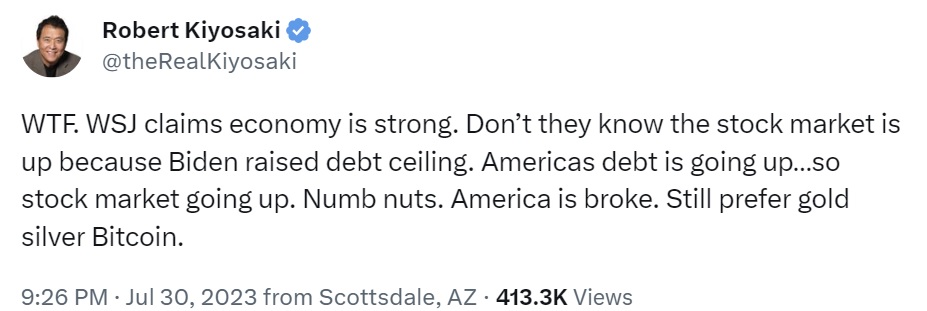
On July 14, Kiyosaki similarly explained that the stock market is “taking off” because the U.S. government has “removed” the debt ceiling. He cautioned that it means the national debt will rise with the stock market.
The renowned author has repeatedly conveyed his belief that the Biden administration and the Federal Reserve are destroying the U.S. economy and the value of the U.S. dollar.
Moreover, Kiyosaki predicted in June that more banks are about to fail. He stated that regional banks in the U.S. are being wiped out because of Fed policies.
This year has witnessed a series of bank failures in the U.S. Last week, Heartland Tri-State Bank collapsed. Prior to that, on March 10, Silicon Valley Bank was closed by the California Department of Financial Protection and Innovation, followed by the closure of Signature Bank by the New York State Department of Financial Services on March 12. Additionally, on May 1, First Republic Bank met a similar fate and was closed by the California Department of Financial Protection and Innovation. Furthermore, Silvergate Bank made an announcement of voluntary liquidation.
Do you agree with Robert Kiyosaki about the U.S. economy? Let us know in the comments section below.
Ethereum Price Broke Out Of Descending Channel, What’s Next?
Ethereum price has been trading within a descending trendline, which is a sign of bearishness. Over the last 24 hours, the Ethereum price has been different as the coin registered a 6% appreciation.
As the coin appreciated, it broke outside of the descending channel.
Over the last week, the Ethereum price lost more than 7% of its value. The buyers have entered the market, which has helped Ethereum climb on its chart.
Although buyers are attempting to make a comeback, the sellers continue to drive the price action on the one-day chart.
The ,400 price mark continues to remain a tough resistance zone for Ethereum price. A break past from the aforementioned support line will help ETH revisit its next price ceiling.
The technical outlook for Ethereum continues to remain bearish at the time of writing. Bitcoin’s price recovery has helped major altcoins pick pace over the last 24 hours.
Ethereum Price Analysis: One Day Chart
Ethereum was priced at ,340 on the one-day chart | Source: ETHUSD on TradingView
ETH was trading at ,340 at the time of writing. In the past 24 hours, the buyers have helped the coin break outside of the descending trendline.
The immediate and strong resistance remained at ,400. The altcoin has struggled to break past that level over the last couple of weeks.
Once the ,400 mark is broken, Ethereum can attempt to trade close to ,700. On the other hand, a fall from the ,340 price mark will push ETH down to ,100 and then to the ,000 level.
The past trading session for Ethereum was green, signifying an increase in the number of buyers.
Technical Analysis
Ethereum depicted a fall in buying strength on the one-day chart | Source: ETHUSD on TradingView
On its chart, ETH was attempting to recover. However, the buyers have remained low at the time of writing. Technical indicators have pointed towards a bearish outlook.
The Relative Strength Index was below the half-line, which also indicated that buyers were fewer in number than sellers.
Ethereum price was below the 20-SMA line, which signified low demand. It also meant that sellers were driving the price momentum in the market.
Ethereum depicted sell signal on the one-day chart | Source: ETHUSD on TradingView
ETH’s other indicators have also shown that the sellers were in control of the market at the time of writing. The demand for the coin has to go up in order for the coin to touch its next resistance mark.
The Moving Average Convergence Divergence indicates the price momentum and overall price action. MACD witnessed a bearish crossover and formed red histograms at the time of writing.
This reading is connected to the sell signal for the coin. The Chaikin Money Flow displays the capital inflows and capital outflows at a given period in time.
The CMF was below the half-line and that points towards low capital inflows, although there was an uptick on the indicator.
Featured image from UnSplash, Chart: TradingView.com
NewsBTC
Ethereum Price Broke Past $1,800 Despite Higher Demand At Lower Levels
Ethereum price flashed recovery over the last 24 hours after it witnessed consolidation at the ,800 price mark. Over the last week, ETH logged 20% appreciation. It has been a bullish week for the king altcoin. The last time the altcoin traded around this price level was almost two months ago.
It had failed to topple over the ,900 zone and had retraced shortly after that. The robust support line for Ethereum price was at ,600. Ethereum price could possibly witness a sharp change once the Ethereum Merge goes live next month.
The Merge is the transition from proof-of-work to proof-of-stake has been a highly anticipated event for the Ethereum community. This shift from proof-of-work shall diminish the altcoin’s power consumption by almost 99.5%. If the price of Ethereum manages to stay above the ,900 mark for a substantial period of time, the coin will manage to touch the ,000 mark price ceiling.
Ethereum Price Analysis: Four Hour Chart
Ethereum was priced at ,918 on the four hour chart | Source: ETHUSD on TradingView
ETH was trading at ,918 at the time of writing. The coin had finally managed to move past the ,800 price region. Ethereum price has to maintain momentum over the ,900 mark in order to touch the ,000 price mark.
Overhead resistance for the coin was at ,970. Local support level for the coin was at ,700 and then at ,600 respectively. Incase ETH loses vigour and falls to the ,600 mark, the inability to sustain at that price level can push the coin to ,300. The amount of Ethereum traded in the last session was falling which meant that selling pressure was declining at the time of writing.
Technical Analysis
Ethereum registered an increased buying strength on the four hour chart | Source: ETHUSD on TradingView
The altcoin’s technical outlook depicted bullishness on the four hour chart. Buying strength for Ethereum also increased as Ethereum price travelled upwards on its chart. The Relative Strength Index was parked above the 60-mark indicating that buyers dominated the market at press time.
If demand for ETH continues to rise, the altcoin might be overvalued leading to a possible price pullback. Ethereum price was above the 20-SMA line, which meant that buyers were driving the price momentum. The altcoin was also above the 50-SMA line which points towards the rising price of the asset.
Ethereum displayed buy signal on the four hour chart | Source: ETHUSD on TradingView
ETH’s other important indicators also depicted positive price action. Moving Average Convergence Divergence is supposed to display that price momentum and reversals in the same. MACD witnessed a bullish crossover and flashed green signal bars above the half-line registering buy signal for the asset.
Directional Movement Index is responsible in determining the price direction of Ethereum. DMI was positive as the +DI line was above the -DI line. Average Directional Index (Red) was bordering the 40-mark which meant that the current price direction was gaining strength.
Featured image from UnSplash, chart from TradingView.com
NewsBTC
Cardano Broke Past This Important Level, Is The Coin Anticipating A Correction?
Cardano has been on a bullish run and it managed to cruise past the crucial resistance mark. Over the last week, ADA surged by almost 20%. The altcoin has been moving up in an ascending trendline over the last 24 hours. Currently, the altcoin has steadied on the .47 support line.
Now Cardano has finally managed to claim its old resistance level and the bulls are back. For the bullish momentum to get intensified ADA needs to stay above the resistance mark it crossed above. It is however to soon to say if ADA is on a bullish momentum or if this is a relief rally.
Bitcoin’s upward movement and moving above the ,000 level has pushed other altcoins on a bullish price action. Buyers have returned to the market and strengthened the bulls.
Broader market sentiments can again drag ADA to its immediate support level. The global cryptocurrency market cap today is .11 Trillion, a 5.4% change in the last 24 hours.
Cardano Price Analysis: Four Hour Chart
Cardano was priced at .506 on the four hour chart | Source: ADAUSD on TradingView
ADA was trading at .506 at the time of writing. The coin broke past the .50 price mark which it struggled to move past over the last few weeks. Overhead resistance for the coin was at .53 but a slight lose in the momentum could drag it down to .47.
For the bears to remain subdued, Cardano has to remain above the .50 level for the next trading sessions. Buying strength also has to remain high for ADA to continue sailing north. Amount of Cardano traded remained high suggesting increased buying strength on the chart.
Technical Analysis
Cardano registered high buying strength on the four hour chart | Source: ADAUSD on TradingView
ADA displayed buying strength on the four hour chart. Buyers are in control and that could make Cardano rally further. In accordance with the same, the Relative Strength Index was above the 60-point indicating that buyers outnumbered sellers on the chart.
Price of ADA was above the 20-SMA which is also indication that buyers were driving the price momentum in the market. Cardano was also above the 50-SMA and 200-SMA line which pointed towards bullishness.
Related Reading | Why Cardano (ADA) Is Likely To Rise as High As .60 By End Of 2022, Experts Predict
Cardano flashed buy signal on four hour chart | Source: ADAUSD on TradingView
Other indicators turned bullish as Cardano started to travel upward. Moving Average Convergence Divergence depicts the price momentum and trend reversals.
MACD underwent a bullish crossover and painted green histograms which is considered buy signal on the chart.
The Directional Movement Index determines which way the coin is headed. DMI was positive as the +DI was above the -DI line.
The Average Directional Index (Red) was nearing 40 and that means that the present trend is growing stronger. For ADA to continue upwards, buyers have to be present along with push from the broader market.
Related Reading | Ethereum Pushes Above Vital Resistance, Could Soon Revisit 00
Featured image from UnSplash, chart from TradingView.com
NewsBTC
Stellar (XLM) Broke Down From The Descending Triangle, Fresh Lows On Chart?
Stellar (XLM) picked up pace on the daily chart as the coin registered some upward movement. The coin has been trading within a descending channel. Although the coin was moving sideways, if bulls reclaim the chart XLM can break above the channel.
Technical outlook for the coin remained bearish. Buying strength also remained considerably low. Recent sell off in the market has caused the coin to lose its .107 support line. If the coin does not rise above the resistance mark of .107 then the altcoin is set to lose some of its value again.
Buying strength has to recover in the market for the altcoin to break over the descending trendline. For bearish thesis to be invalidated, it is important for Stellar to trade above the .113. For Stellar to maintain its recovery, buying strength needs to immediately re-enter the market. The global cryptocurrency market cap today is 8 Billion with a 2.0% positive change in the last 24 hours.
Stellar Price Analysis: Four Hour Chart
Stellar was priced at .106 on the four hour chart | Source: XLMUSD on TradingView
XLM was trading for .106 at the time of writing. The coin tried to rise above the descending line but fall in buying strength have dragged price below the .107 mark. If the coin manages to trade above the .107 mark, then it could revisit .113.
Trading above the .113 level will help the bearish thesis to be invalidated. If XLM loses its current price level, it could fall to .099. The amount of Stellar traded fell on the chart signifying less buying strength. If buying strength continues to remain low then the coin can plunge through the .099 level.
Technical Analysis
Stellar displayed fall in buying strength on the four hour chart | Source: XLMUSD on TradingView
The altcoin flashed fall in buying strength as seen from the technical indicators. Relative Strength Index was trading close to the half-line after noting a downtick. This downtick meant buyers exited the market. If buying pressure continues in this momentum, RSI will soon fall below the zero-line.
Price of Stellar was slightly above the 20-SMA which pointed towards buyers driving the price momentum in the market. Although buyers are still more in number compared to sellers, it isn’t enough for the coin to register increased price over the upcoming trading sessions.
Related Reading | Short Liquidations Climb As Bitcoin Recovers Above ,000
Stellar flashed buy signal on the four hour chart | Source: XLMUSD on TradingView
XLM’s buying strength has remained low on the chart. In consonance with the same, Chaikin Money Flow which depicts capital outflow and inflows displayed a downtick. Although CMF was positive, capital inflows have remained low.
Awesome Oscillator points towards price direction and momentum. AO turned positive and displayed green histograms. These green histograms reflected change in price direction and also a buy signal. Despite a buy signal, if buyers don’t act on it then Stellar’s upward movement will be stalled.
Related Reading | Bitcoin Funding Rate Turns Highly Positive, Long Squeeze In The Making?
Featured image from VOI.ID, chart from TradingView.com
Solana Broke Its Nearest Support, Vital Trading Levels To Keep An Eye On
Solana has fallen on its chart over the last 24 hours by 2%. Over the last 24 hours, there has been strong bearish influence on SOL’s price. Currently the coin has found support on the level.
The market also has been taken over by the bears, Bitcoin has been hovering around the ,000 mark for the last 24 hours. Other market movers have also retraced in their respective charts.
Technical outlook of the coin continues to point towards negative price action suggesting that price of Solana can fall further. Selling pressure in the market has started to mount indicating that price of SOL could again take a dip.
The global cryptocurrency market cap today is 7 Billion with a fall of 0.2% over the last 24 hours. Since, Solana has now fallen beneath the mark, SOL could now be prone to further fall.
Solana Price Analysis: One Day Chart
Solana was priced at on the one day chart | Source: SOLUSD on TradingView
SOL was trading at on the 24 hour chart. Further retrace from the current price level will push the coin to . Overhead resistance for the coin stood at , if buying strength returns then SOL could attempt to revisit the price level.
If SOL manages to remain above the mark for a substantial amount of time then could be possible on the chart. If Solana fails to hold itself near its support line, it could drag itself down to in just a matter of sometime. The amount of the altcoin traded was in the red indicating bearishness and increased selling pressure.
Technical Analysis
Solana displayed fall in buying strength on one day chart | Source: SOLUSD on TradingView
Technical outlook on the 24 hour chart for Solana has signalled at price falling further. As mentioned above, buyers fell in number.
The Relative Strength Index noted a decline and sunk below the half-line indicating that sellers outnumbered buyers in the market.
In accordance with rising selling pressure, Chaikin Money Flow also moved towards the zero-line. The indicator represents amount of capital inflows and outflows. This reading meant that capital inflows depreciated.
Solana displayed buy signal on the one day chart | Source: SOLUSD on TradingView
At the current price, Solana could witness demand from buyers if price remains at the same level. Although the bears have gained control, SOL has been flashing buy signal on the one day chart.
The Directional Movement Index (DMI) was negative which meant that the price direction shall remain bearish. On the DMI, the -DI line was above the +DI line.
Moving Average Convergence Divergence (MACD) depicts price trends and reversals. MACD flashed green histograms which are tied to a buy signal. For SOL to reclaim , strength from buyers shall prove to be crucial.
Featured image from Solana.com, chart from TradingView.com
NewsBTC