 Gold advocate and vocal bitcoin critic Peter Schiff has warned of a bubble in bitcoin exchange-traded funds (ETFs) that will burst when gold rallies. Schiff argues that gold will “inevitably” break out, and the price of bitcoin will crash as investors withdraw from bitcoin ETFs. “Bitcoin has basically become a bet against gold,” he stressed. […]
Bitcoin News
Bitcoin Breaks $60K Barrier — On the Verge of Outranking Meta by Market Value
 Bitcoin broke through the critical ,000 barrier at 8:30 a.m. Eastern Time on Wednesday, reaching a level last seen in November 2021. The leading cryptocurrency’s market value is on the brink of overtaking Meta, positioning it as the ninth most valuable asset in the world by market capitalization. Bitcoin Climbs Past ,000: A New Era […]
Bitcoin News
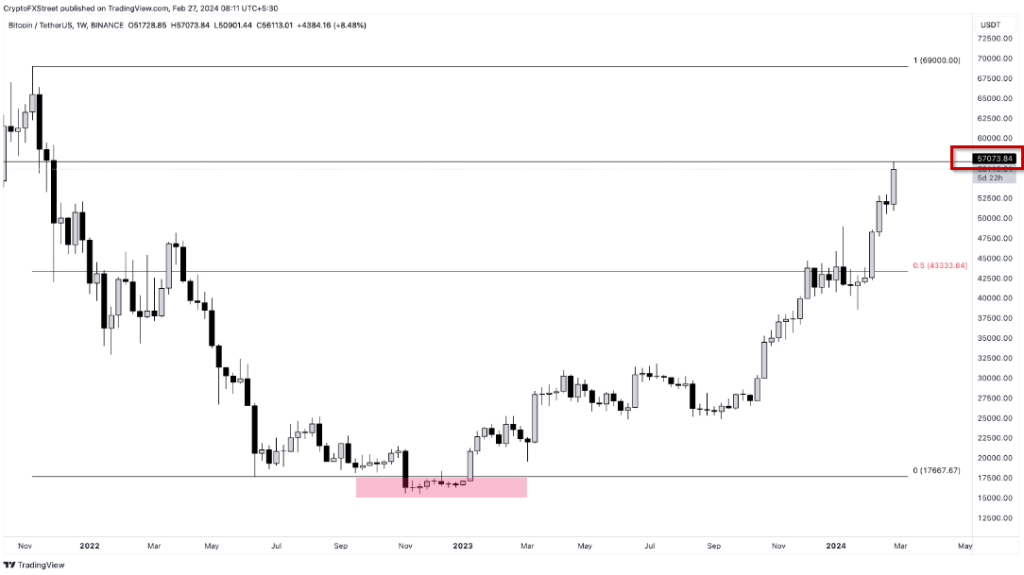
Bull Run Returns? Bitcoin Breaks Through $57,000 Barrier
In a not-so unexpected turn of events, Bitcoin (BTC) has surged to new heights, breaking the ,000 barrier during the early hours of Tuesday in the Asian market. This price level, not seen since November 2021, marks a significant resurgence for the leading cryptocurrency.
Bitcoin ETFs Experience Unprecedented Activity
Remarkably, the surge in Bitcoin’s price has triggered substantial activity in US-based spot Bitcoin ETFs, excluding Grayscale’s GBTC. According to Bloomberg, these ETFs recorded a record-high .4 billion in trading volume on Monday. This surge in trading activity underscores the increasing interest and involvement of institutional investors in the cryptocurrency market.
As of the time of publication, bitcoin had slightly decreased to ,437, but it was still up about 10% from the previous day. Since the beginning of the year, the price of bitcoin has risen by more than 30%, continuing a protracted surge that has also spurred interest in smaller currencies like Ether and Solana, among speculators.
The demand for Bitcoin is not confined to spot trading alone; a substantial influx of approximately .6 billion has poured into recently launched Bitcoin ETFs in the US, which began trading on January 11. This influx of investment signals a broadening interest in Bitcoin, extending beyond the traditional base of digital asset enthusiasts.
It’s official..the New Nine Bitcoin ETFs have broken all time volume record today with .4b, just barely beating Day One but about double their recent daily average. $IBIT went wild accounting for .3b of it, breaking its record by about 30%. pic.twitter.com/MiCs1rzttM
— Eric Balchunas (@EricBalchunas) February 26, 2024
Bitcoin’s Rally Outshines Traditional Assets
Surprisingly, Bitcoin’s rally this year has outpaced traditional assets such as stocks and gold. The ratio comparing Bitcoin’s price to that of the precious metal has reached its highest level in over two years, indicating a shifting preference among investors towards digital assets.
The overall value of digital assets, including various cryptocurrencies, now stands at a staggering .2 trillion, a substantial increase from the lows experienced during the bear market of 2022 when the market value dipped to around 0 billion. This resurgence demonstrates the resilience and growing prominence of digital assets in the financial landscape.
Contrary Market Indicators Fail To Deter Crypto Momentum
In an intriguing development, despite a rise in US Treasury yields, which typically signals expectations for tighter monetary policy, the bullish momentum in the cryptocurrency market remains resilient. Digital tokens like Bitcoin are experiencing notable upward movements, defying conventional market indicators.
Fundstrat Global Advisors’ Head of Digital-Asset Strategy, Sean Farrell, noted in a recent statement that the “bullish momentum in crypto is unfolding despite an uptick in rates,” highlighting the unique dynamics influencing the cryptocurrency market.
MicroStrategy Boosts Corporate Bitcoin Holdings
In the midst of this ongoing rally, MicroStrategy, a notable enterprise software firm recognized for incorporating Bitcoin into its corporate strategy, has announced a significant addition to its cryptocurrency holdings.
The company revealed that it had purchased an additional 3,000 Bitcoin tokens this month, bringing its total Bitcoin holdings to approximately billion. This strategic move by MicroStrategy highlights the growing acceptance of cryptocurrencies as a valuable asset by corporate entities.
Featured image from, chart from TradingView
Bitcoin Breaks $54,000 Barrier for First Time Since 2021, Eyes Historic Highs Ahead of Halving Event
 The price of bitcoin has risen past the ,000 threshold, now hovering at ,446 per unit as of Monday, Feb. 26, 2024, at 2:37 p.m. Eastern Time (ET). This leading crypto asset has witnessed a growth of 4.5% in the last six hours, and over the previous month, bitcoin’s value has soared by 28.3% against […]
Bitcoin News
Ethereum Breaks Back Above $3,000, Will FOMO Lead To Top Again?
Ethereum has once again broken above the ,000 level after previous attempts ended in failure as FOMO took over the investors.
Ethereum Has Rallied 3% In Past Day To Break Back Above ,000
Earlier, Ethereum had made two attempts at the ,000 level, but both of them had turned out to be brief as the asset quickly retraced back to lower levels. In the past day, ETH has once again made a push towards the mark, as the chart below shows.
In this latest surge, ETH has seen a sharp recovery of more than 3% from around the ,900 mark to the current levels. The coin is now up 8% in the past week, making it the second-best performer among the top 10 cryptocurrencies, just behind BNB’s 10% profits.
From the graph, it’s visible that Ethereum is now within touching distance of setting a new high for the year. But ETH investors would be wondering if this rally would sustain or if it would end up losing steam, just like the previous ones. If data is anything to go by, market sentiment may have been the reason behind the demise of the last surges.
ETH’s Previous Surges Topped Out As FOMO Took Over Traders
According to data from the analytics firm Santiment, the latest top above ,000 occurred as the crowd euphoria spiked. The indicator of interest here is the “Social Volume,” which keeps track of the total amount of discussion that social media users are participating in around a given term or topic.
The metric calculates this value by counting up the number of posts/threads/messages across the major social media platforms that are making at least one mention of the topic.
The below chart shows the data of the Social Volume related to two Ethereum topics:
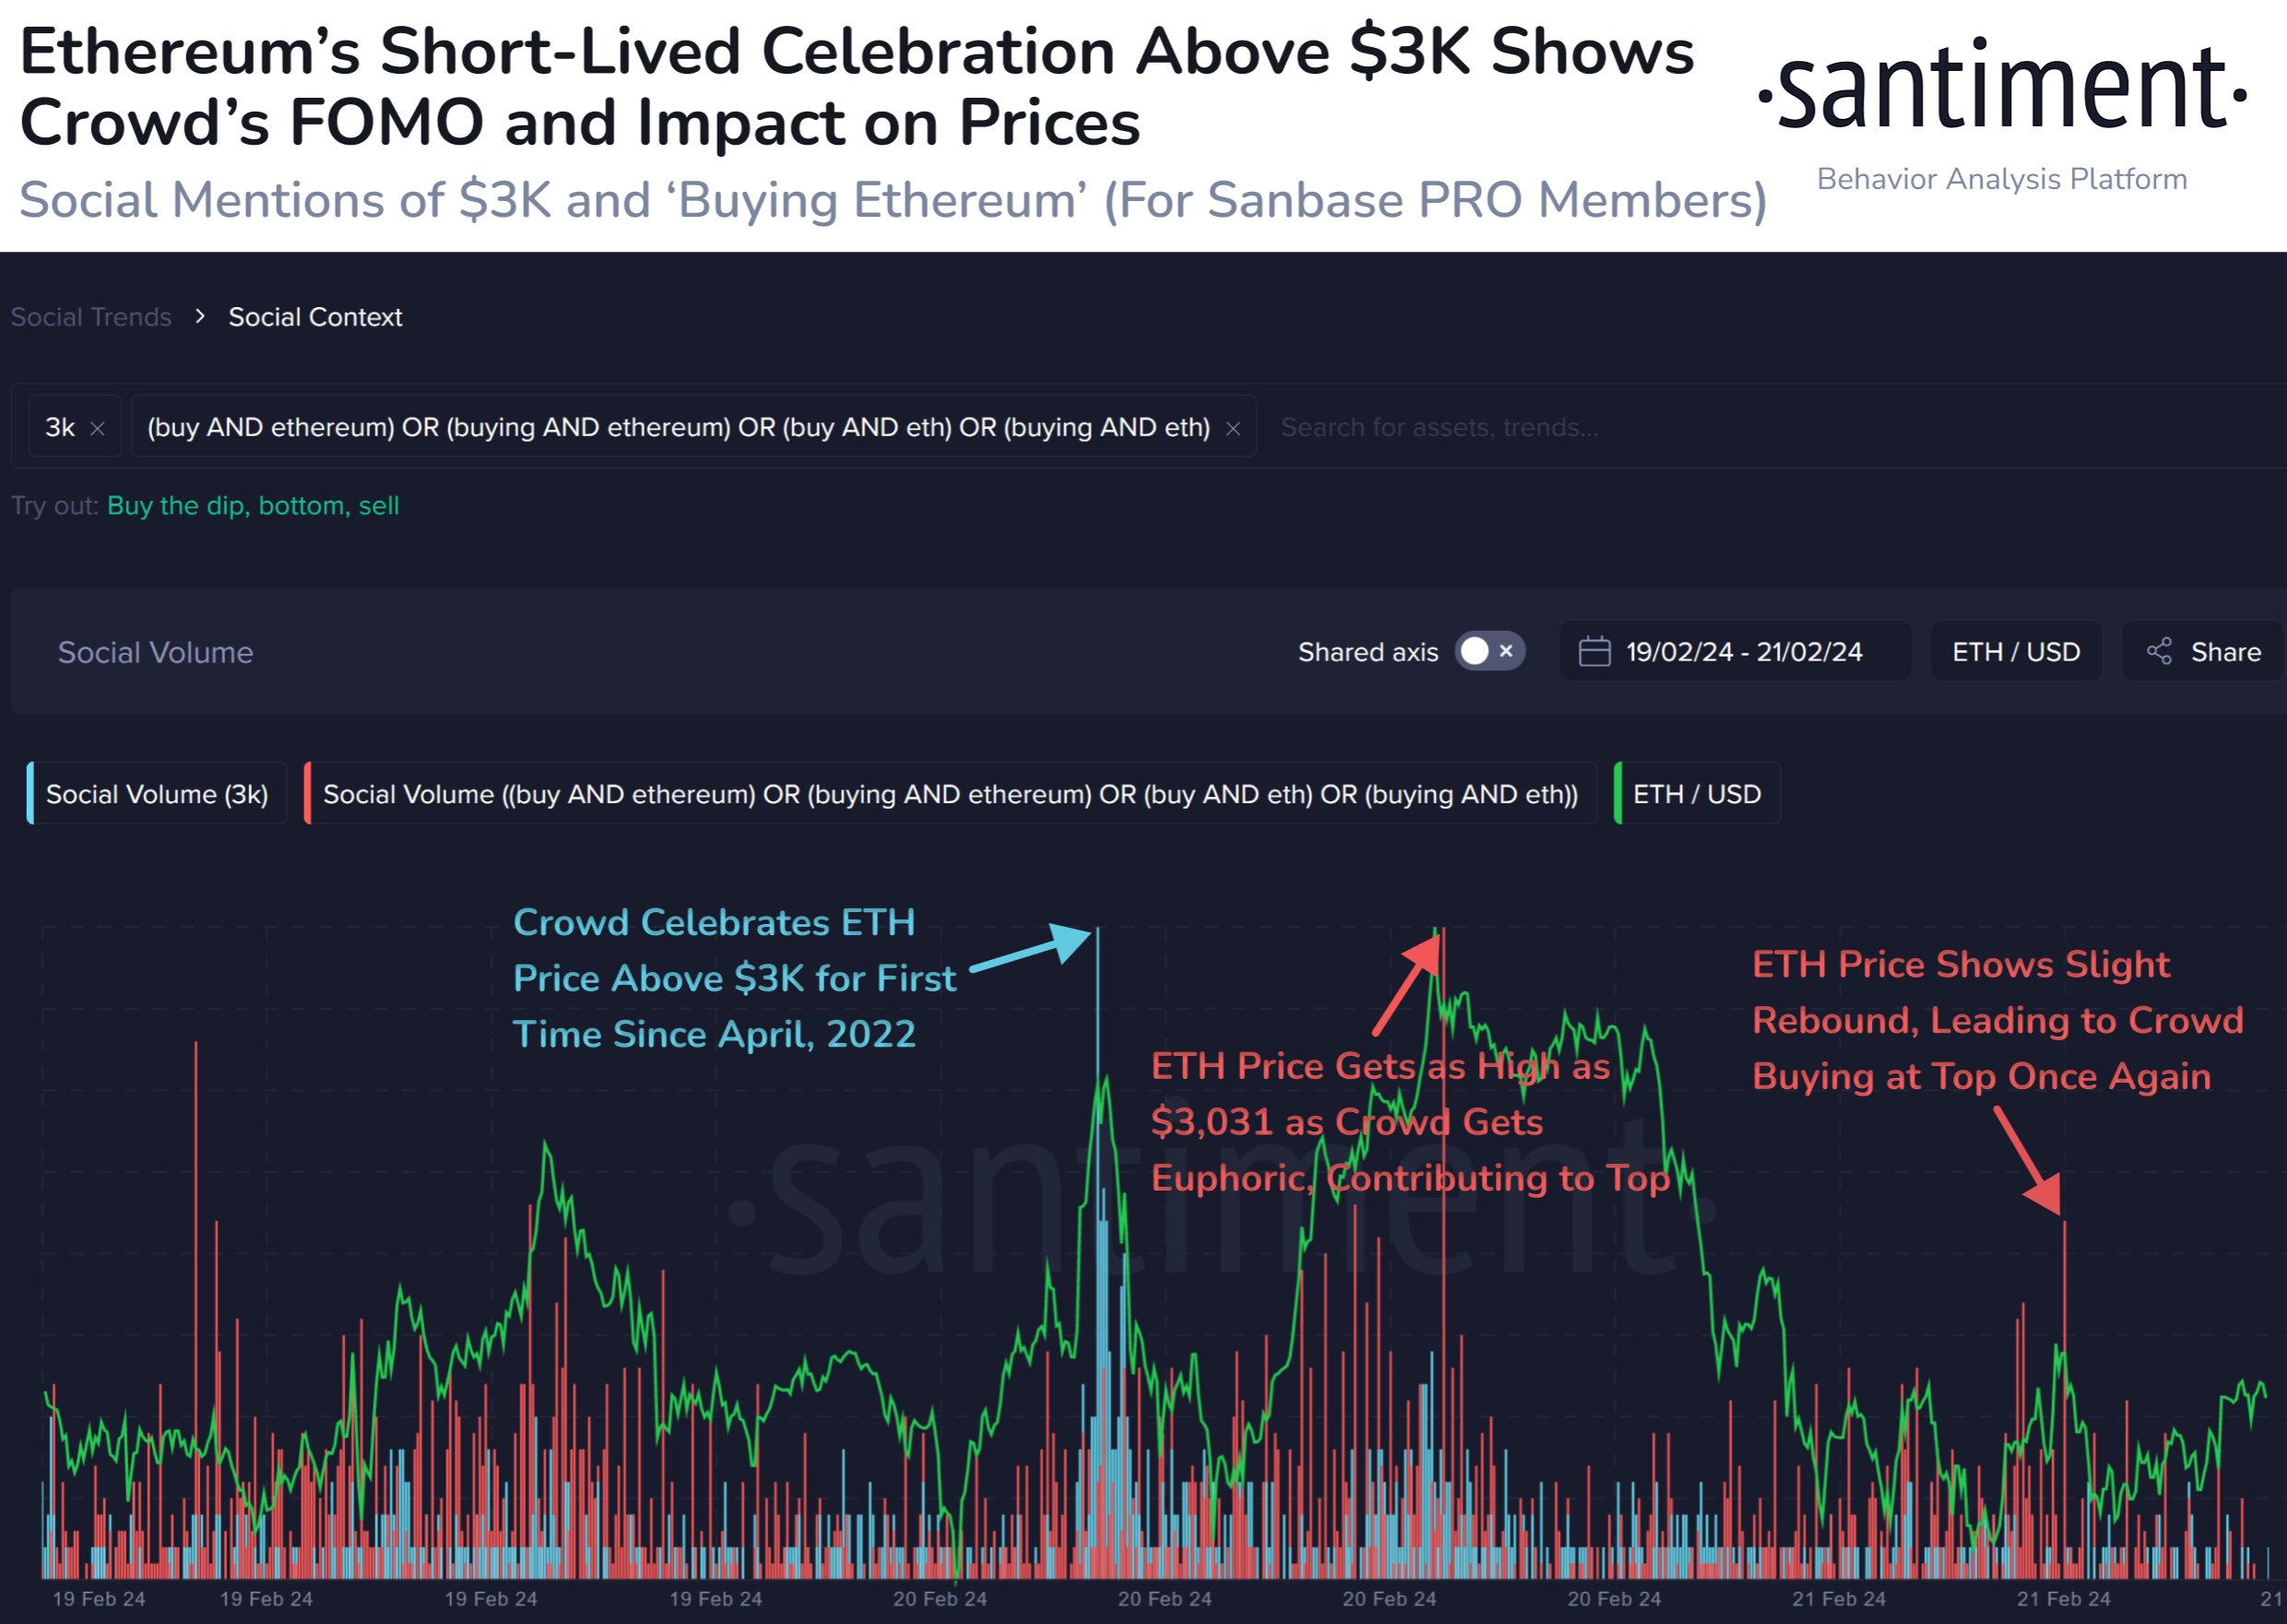
The first Social Volume here has been filtered for ,000. As is visible in the graph, this metric spiked as ETH broke above ,000 for the first time since April 2022 a couple of days back.
This would suggest that discussions around the topic had spiked high as traders had celebrated the break. As it had turned out, though, the surge was pretty short-lived.
In the second attempt, the Social Volume related to terms like “buy Ethereum” had registered a large spike, implying that FOMO had developed among the traders.
Historically, FOMO has been something that has made tops likely, as ETH’s price has tended to go contrary to the expectations of the crowd. This is likely the reason why the top coincided with this spike.
A similar phenomenon occurred with the small recovery surge observed yesterday, as Santiment has highlighted in the chart. It would seem that greed had once again led to the coin topping out.
It now remains to be seen how the market reacts to the latest rally above ,000. If FOMO around Ethereum once again spikes on social media, then it may very well be a sign that this surge, too, may only be temporary.
Ethereum Breaks $2,900, But Watch Out For Futures Overheating
Ethereum has broken beyond the ,900 level during the past day, but data shows the futures market may be starting to become overheated.
Ethereum Has Now Broken Through The ,900 Level
While Bitcoin has slumped to an overall sideways trajectory recently, Ethereum appears to have decided to pick a path of its own, as the second largest asset in the sector has surged almost 4% over the past 24 hours.
During this latest jump, Ethereum has touched the ,900 mark for the first time since the start of May 2022. The below chart shows how the coin has performed over the last few days.
Following this rise, Ethereum investors would now be enjoying profits of more than 16% over the past week. In the same period, Bitcoin has only put together returns of about 8%.
While ETH’s decoupling may be an optimistic sign for the asset, a pattern seems to be emerging that could prove to be a worrying sign.
ETH Open Interest Has Observed A Sharp Increase Recently
As explained by an analyst in a CryptoQuant Quicktake post, the ETH Open Interest has gone through a strong surge recently. The “Open Interest” is an indicator that keeps track of the total amount of Bitcoin futures contracts that are currently open on all centralized derivative exchanges.
When the value of this metric rises, it means that the investors are opening up fresh positions on the futures market right now. Generally, total leverage in the sector goes up as more positions pop up, so this trend can result in a higher amount of volatility for the cryptocurrency.
On the other hand, a decline in the indicator implies ETH futures contract holders are either closing up their positions of their own volition, or are being liquidated by their platform. The asset’s price may behave more stably following such a decrease.
Now, here is a chart that shows the trend in the Ethereum Open Interest over the last few years:

From the graph, it’s visible that the Ethereum Open Interest has risen to high levels recently and has attained a peak that’s higher than any witnessed in almost two years.
“This surge indicates sustained confidence among futures traders in Ethereum’s current uptrend,” notes the quant. “However, given the impulsive nature of the recent ascent, traders should exercise caution and consider the potential for sudden liquidation events, which could trigger notable short to mid-term price declines.”
As mentioned before, the asset becomes more likely to show volatility when this indicator rises. The source of this volatility can be mass liquidation events called squeezes, which can trigger a violent cascade effect on the futures market, amplifying the price swing that triggered the event.
Since the Ethereum Open Interest is very high right now, a futures squeeze could definitely be a possibility for the cryptocurrency.
$400 XRP Price Point: Analyst Breaks Down The Future Surge Date
Amid the XRP price unfavorable market sentiment, Changelly, a prominent global cryptocurrency exchange, has sparked new optimism by predicting a potential surge in the token’s price. The crypto exchange has projected new all-time highs for the cryptocurrency in the upcoming years.
XRP 2024 Price Prediction
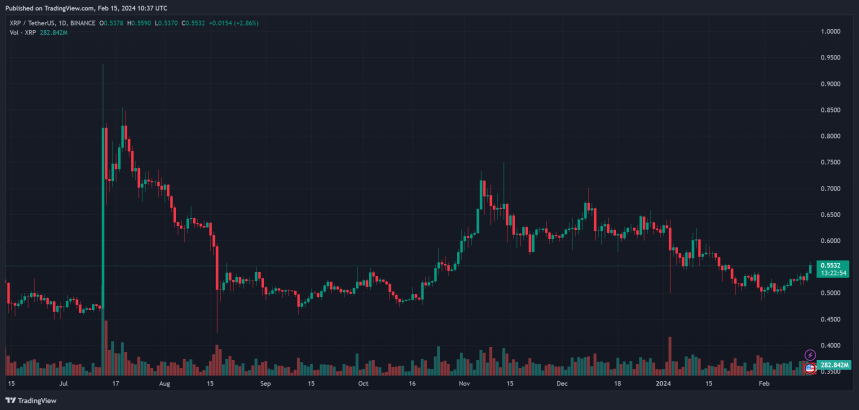
On Wednesday, February, Changelly released a research report projecting XRP’s monthly prices for 2024. The crypto exchange emphasized XRP’s historical challenges, recounting significant declines that caused the cryptocurrency to trade well below its 2018 all-time high of .84.
Following an extensive analysis of XRP, Changelly has predicted a 23.71% increase in the price of XRP, surpassing current resistance levels at .5 and reaching .667 by February 16, 2024.
The crypto exchange noted that current technical indicators signal a 28% bearish bullish market sentiment on the token, alongside a Fear and Greed index reflecting high Greed at 74.
Changelly has also reported a positive seven-day upward trend for XRP, noting a .01 increase in the past 24 hours. The cryptocurrency platform foresees the average price of XRP reaching .617 by March, with a projected price range of .550 to .685.
Changelly forecasts that XRP will trade above the .50 mark in April and May, reaching average price values of .562 and .573, respectively. From June to September, the cryptocurrency is expected to gradually approach the .60 mark, with the average price values of XRP ranging from .55 to .59 during these months.
By November, the token is anticipated to break past resistance levels, maintaining an average price of .662, with a minimum and maximum value of .569 and .755, respectively. Meanwhile, Changelly has predicted a surge in the average XRP price to .695 for December, potentially reaching a peak value of .829.
Massive Price Surge In Upcoming Years
In its research report, Changelly provided a forecast of the token from 2025 to 2050. The crypto exchange platform anticipates big gains for the cryptocurrency, expecting its price to exceed 0 in the coming decades. Specifically for 2025 and 2026, Changelly projects XRP to surpass the mark and trade at an average price of .18 and .72, respectively.
The cryptocurrency is expected to slowly increase over the years, surging past mark in 2027 and surpassing its all-time high of 3.84 for the first time to reach an average price of .04 in 2028.
In the decade from 2030 to 2040, Changelly has predicted that XRP would trade at an average price of .39 in 2030, rapidly gaining more momentum over the years to reach a maximum level of 0.23 and a minimum of 3.15 in 2040.
By 2050, XRP is projected to surpass the 0 mark and trade at 5.74, with a maximum and minimum value of 0.55 and 5.36, respectively.
Chart from Tradingview
Bitcoin Open Interest Surges To A 2-Year High, BTC Breaks Above $51,000
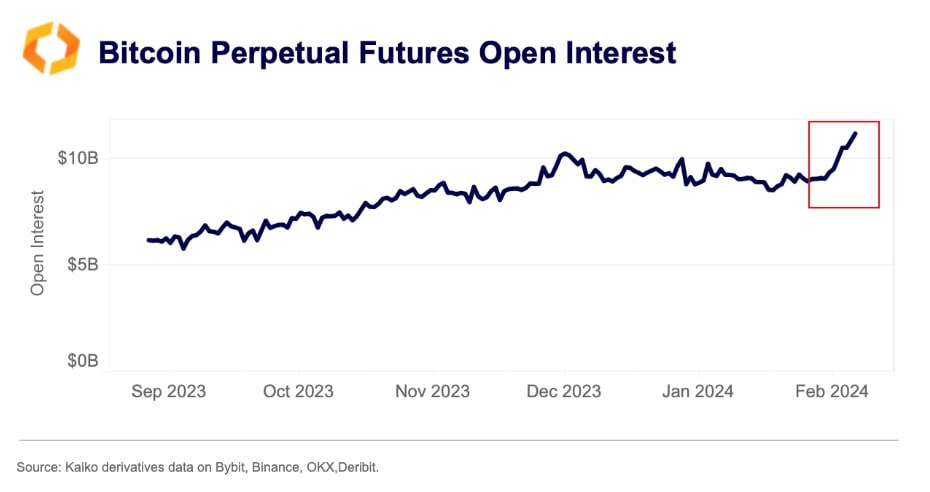
Bitcoin’s open interest has surged past billion for the first time in over two years. This uptick comes when the world’s most valuable coin surges, recently easing past ,000, the highest level since December 2021.
Surging Open Interest And Order Book Imbalance
According to Kaiko, a leading crypto analytics provider, this upswing in open interest comes at a critical time for the coin. When prices zoomed past ,000 on February 11, there was an order book imbalance. Then, Kaiko observed there were 0 million more bids than asks.
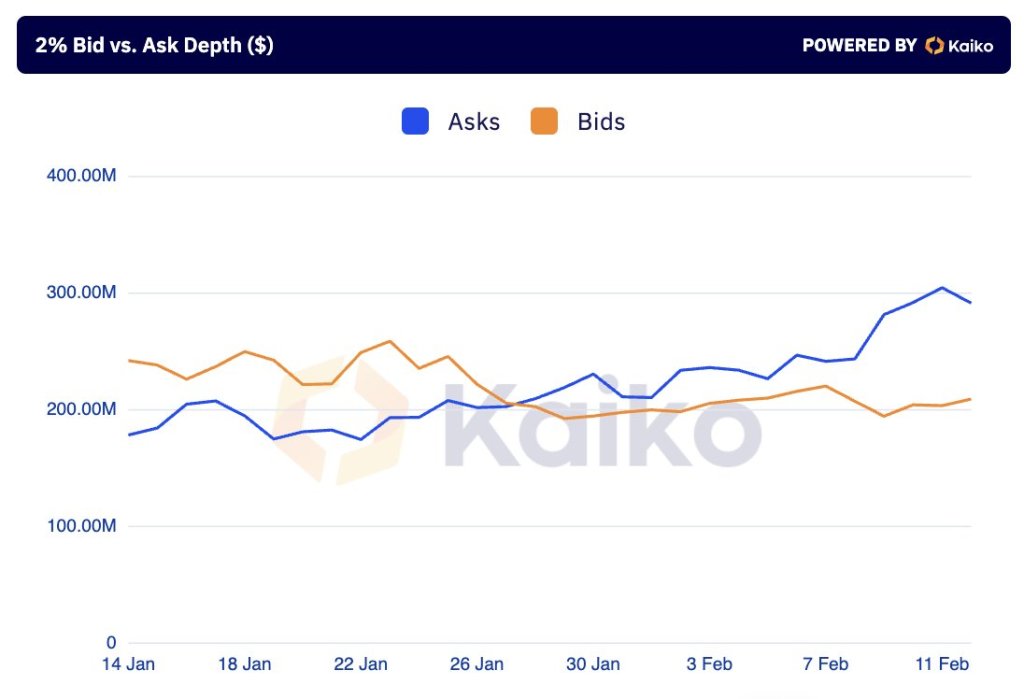
Technically, whenever there is an order book imbalance with more bids than asks, it suggests that buyers are more willing and enthusiastic to purchase at spot rates than sellers are willing to liquidate. Following this imbalance, prices shot higher the following days, breaking above the ,000 psychological number to over ,500 when writing on February 14.
Surging open interest, especially as the market trends higher, is bullish. It means that more people are willing to participate in the market, hopeful of riding the trend. Subsequently, their participation translates to a more liquid market, charging the upside momentum.
Bitcoin is racing higher at the back of strong inflows into spot Bitcoin exchange-traded funds (ETFs). Over the past few weeks, spot Bitcoin ETF issuers have been rapidly accumulating the coin. The largest so far is BlackRock’s IBIT, owning over 70,000 BTC.
As a result, prices are edging higher, reflecting the high demand pinned directly to institutional participation. This positive sentiment and expectations of even more price gains, translating to higher open interest, is despite the continued liquidation of the Grayscale Bitcoin Trust (GBTC). Following court approval, GBTC is converted into an ETF, joining others like Fidelity, who also offer a similar product.
Genesis Looking To Sell GBTC; Will Bitcoin Rally In March?
Even with the high optimism, a potential cloud hangs over the Bitcoin market. Genesis, a crypto lender under bankruptcy protection, wants the court to allow them to sell over .4 billion of GBTC.
If the court green-lights this move, BTC could have more liquidation pressure, possibly unwinding recent gains. So far, the FTX estate sold their GBTC, estimated to be worth over billion, coinciding with Bitcoin dropping to as low as ,500 in January.
Besides these Bitcoin-specific events, the market is closely watching how the monetary policy scene in the United States will evolve in the next few weeks. The United States Federal Reserve is expected to slash rates in March, a potentially beneficial move for BTC.
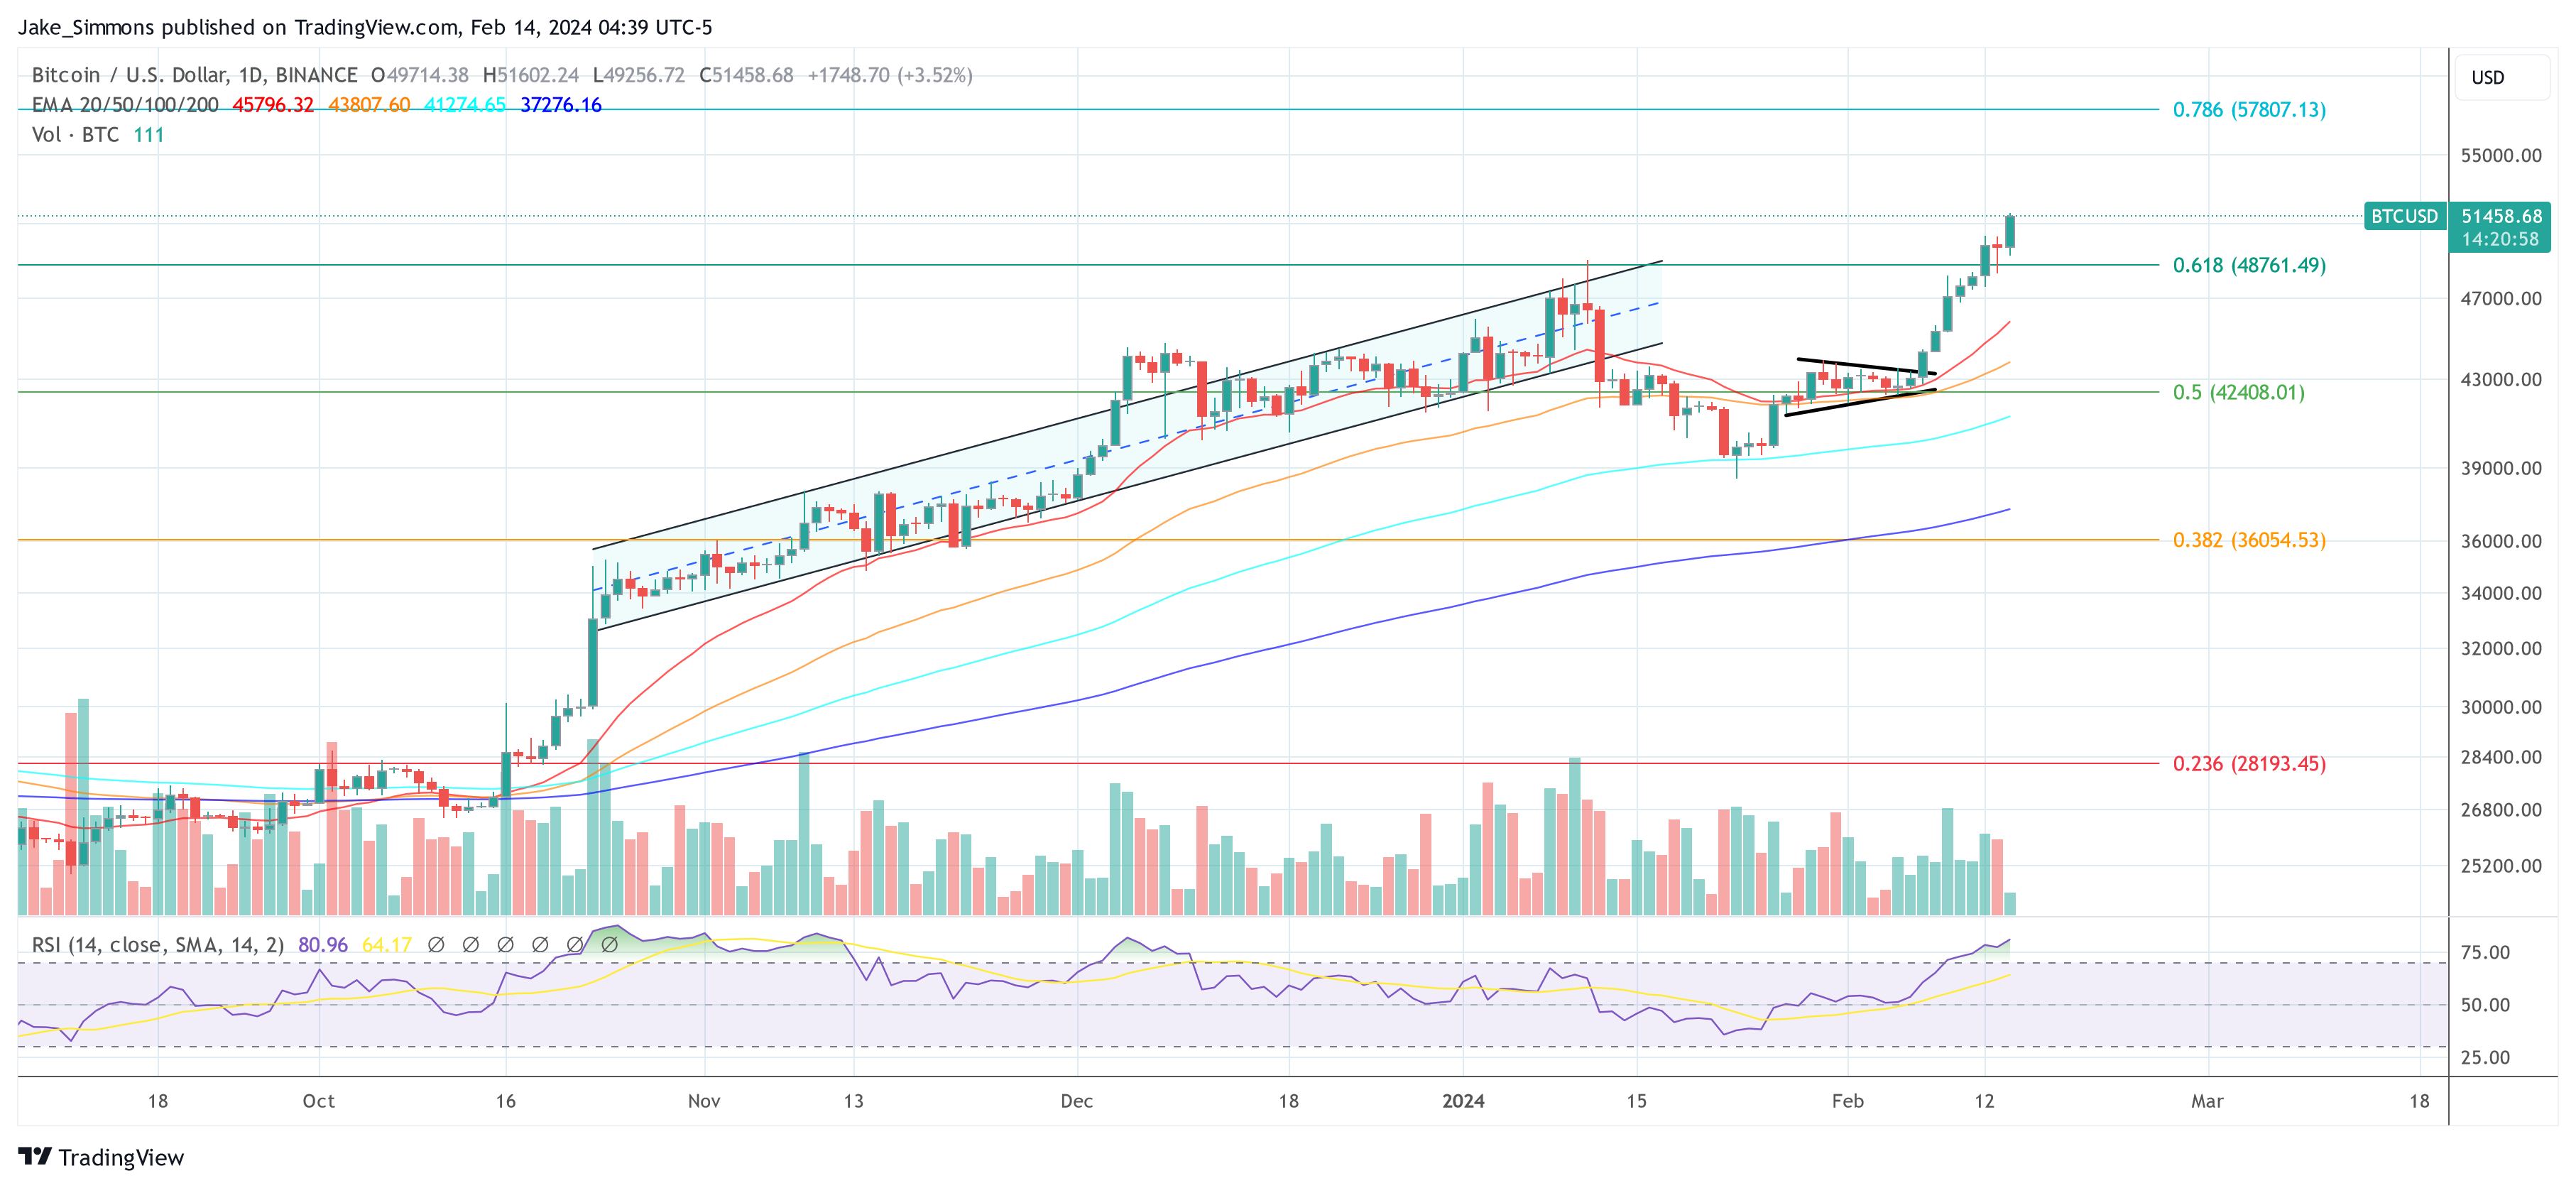
Bitcoin Price Breaks Past $51,500: 4 Key Reasons
On Tuesday, the Bitcoin price plunged from ,900 to ,300 following the release of the US inflation data. As NewsBTC reported, the data came in hotter than expected. Instead of 2.9%, headline CPI came in at 3.1%, while the core CPI was even at 3.9% instead of the expected 3.7%.
The traditional financial market reacted negatively and dragged Bitcoin down with it, as expectations for interest rate cuts have shifted further into the future. The prediction markets are now pricing in only 4 rate cuts in 2024 after CPI inflation reached 3.1% in January.
This is a huge drop in expectations as just over a month ago the markets were still pricing in 6 rate cuts. The Fed’s most recent forecast was for 3 rate cuts in 2024. The probability of a rate cut in March is below 10% and the probability of a rate cut in May is falling rapidly.
In contrast to the S&P 500, however, the Bitcoin price showed a strong reaction and quickly rose again to ,900. The reaction of the Bitcoin market is quite telling for the short-term future. And the Bitcoin price is showing just that today. At press time, BTC rose above ,500, marking a new yearly high. Here are 4 key reasons:
#1 Record-Breaking Bitcoin ETF Inflows
The surge in Bitcoin ETF inflows marks a pivotal moment for Bitcoin, reflecting a significant shift in investor sentiment and market dynamics. On a record-breaking day on Tuesday, the net inflows into spot Bitcoin ETFs reached 1 million, led by The Nine with an inflow of 4 million, signaling a substantial accumulation of Bitcoin.
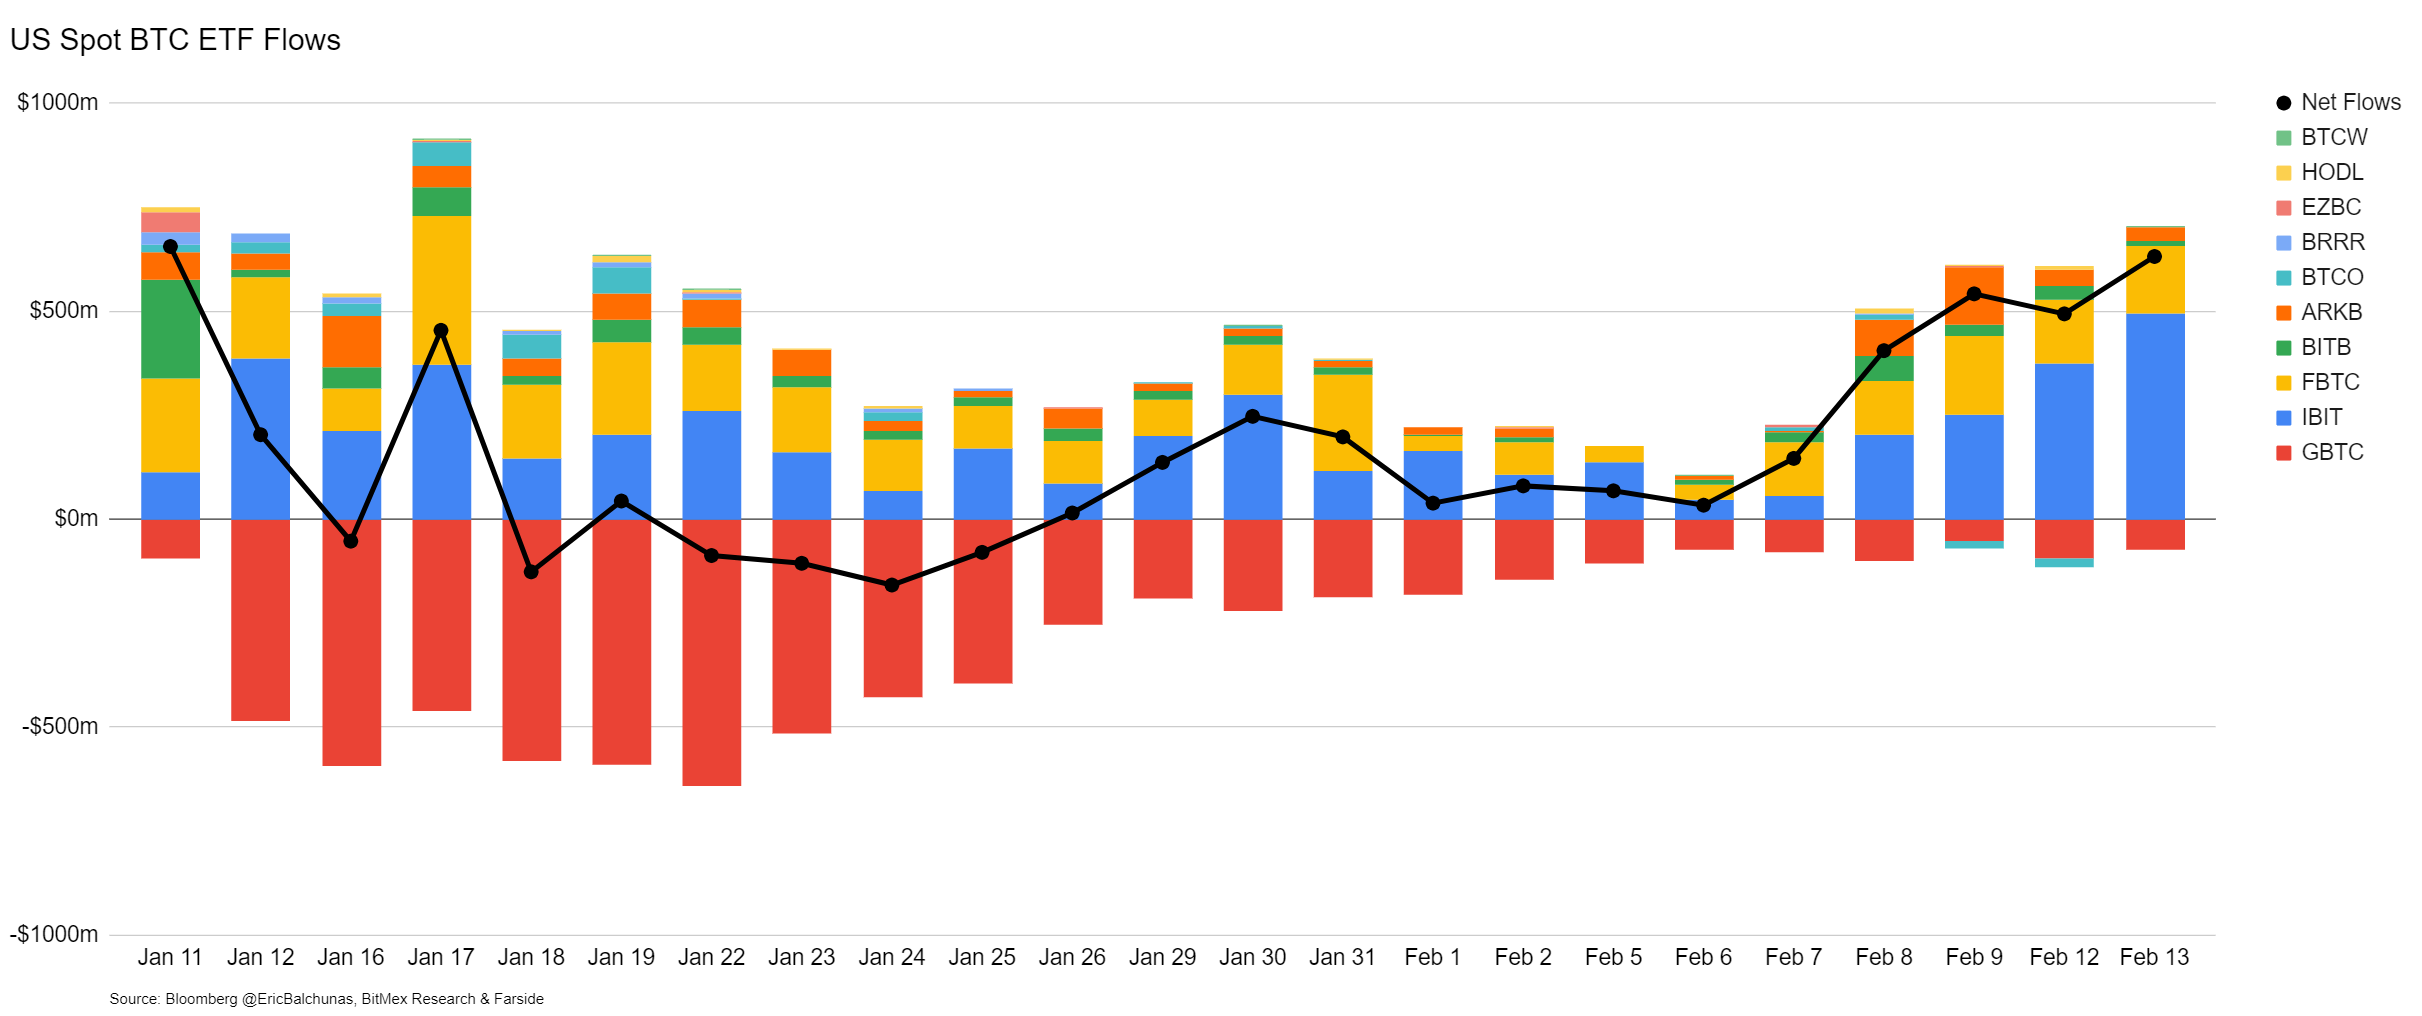
Key players like Blackrock and Fidelity played a significant role in this influx, with Blackrock experiencing nearly half a billion dollars (3 million) in inflows and Fidelity 4 million. The overall net inflow of .07 billion over four trading days, averaging over half a billion per day, highlights the staggering sustained demand for Bitcoin.
This demand is notably new capital, as GBTC outflows remained stable at million, indicating these inflows are not merely a rotation from GBTC but represent fresh investments. Matt Hougan, CIO of Bitwise emphasized the significance of this movement:
IMHO the [numbers] undercounts the fundamental new investor demand for these ETFs. People assume all of the money flowing out of GBTC to date is rotating into other bitcoin ETFs. But a good chunk of it is from inorganic holders […] Long-term investors have backfilled that and added b more on top. I suspect the real new investor-led new demand is north of b, and shows no signs of slowing.
#2 Genesis GBTC Liquidation Concerns Alleviated
Fears of a Bitcoin crash, similar to FTX’s sale of GBTC, triggered by Genesis’ planned liquidation of Grayscale Bitcoin Trust (GBTC) shares have been alleviated, as reported today on Bitcoinist. The liquidation, necessary due to Genesis’ bankruptcy, was initially viewed as a potential market downturn catalyst.
The bankrupt lender needs to liquidate approximately 36 million shares of GBTC, valued at around .5 billion, as part of its strategy to resolve financial challenges stemming from significant loans and regulatory settlements.
However, the proposed Chapter 11 settlement involves in-kind repayments to creditors, reducing direct selling pressure on Bitcoin. This strategy aligns with the interests of long-term Bitcoin holders, potentially limiting market volatility. Greg Schvey, CEO at Axoni, highlighted:
The proposed Ch 11 settlement requires Genesis to repay creditors in kind (i.e. bitcoin lenders receive bitcoin in return, rather than USD). […] Notably, in-kind distribution was a priority negotiation topic to prevent long-term BTC holders from recognizing gains when receiving USD back (i.e. a forced sale). This would seem to indicate a substantial volume of lenders don’t plan to sell immediately.
#3 OTC Demand Exceeds Supply
The statement by CryptoQuant CEO Ki Young Ju that “Bitcoin demand exceeds supply at OTC desks currently” is a significant indicator of underlying market strength. OTC transactions, preferred by large institutional investors for their discretion and minimal market impact, are reflecting a robust demand for Bitcoin. This demand-supply imbalance at OTC desks suggests that large players are accumulating Bitcoin, a bullish signal for the cryptocurrency’s price outlook.

#4 Futures And Spot Market Dynamics
The analysis of futures and spot market indicators by @CredibleCrypto sheds light on the technical factors signaling a bullish continuation for Bitcoin. The analyst points out, “Data supporting the idea that that was ‘the dip’. – OI reset back to levels before the last pump – Funding decreasing through this local consolidation – Spot premium is back.”
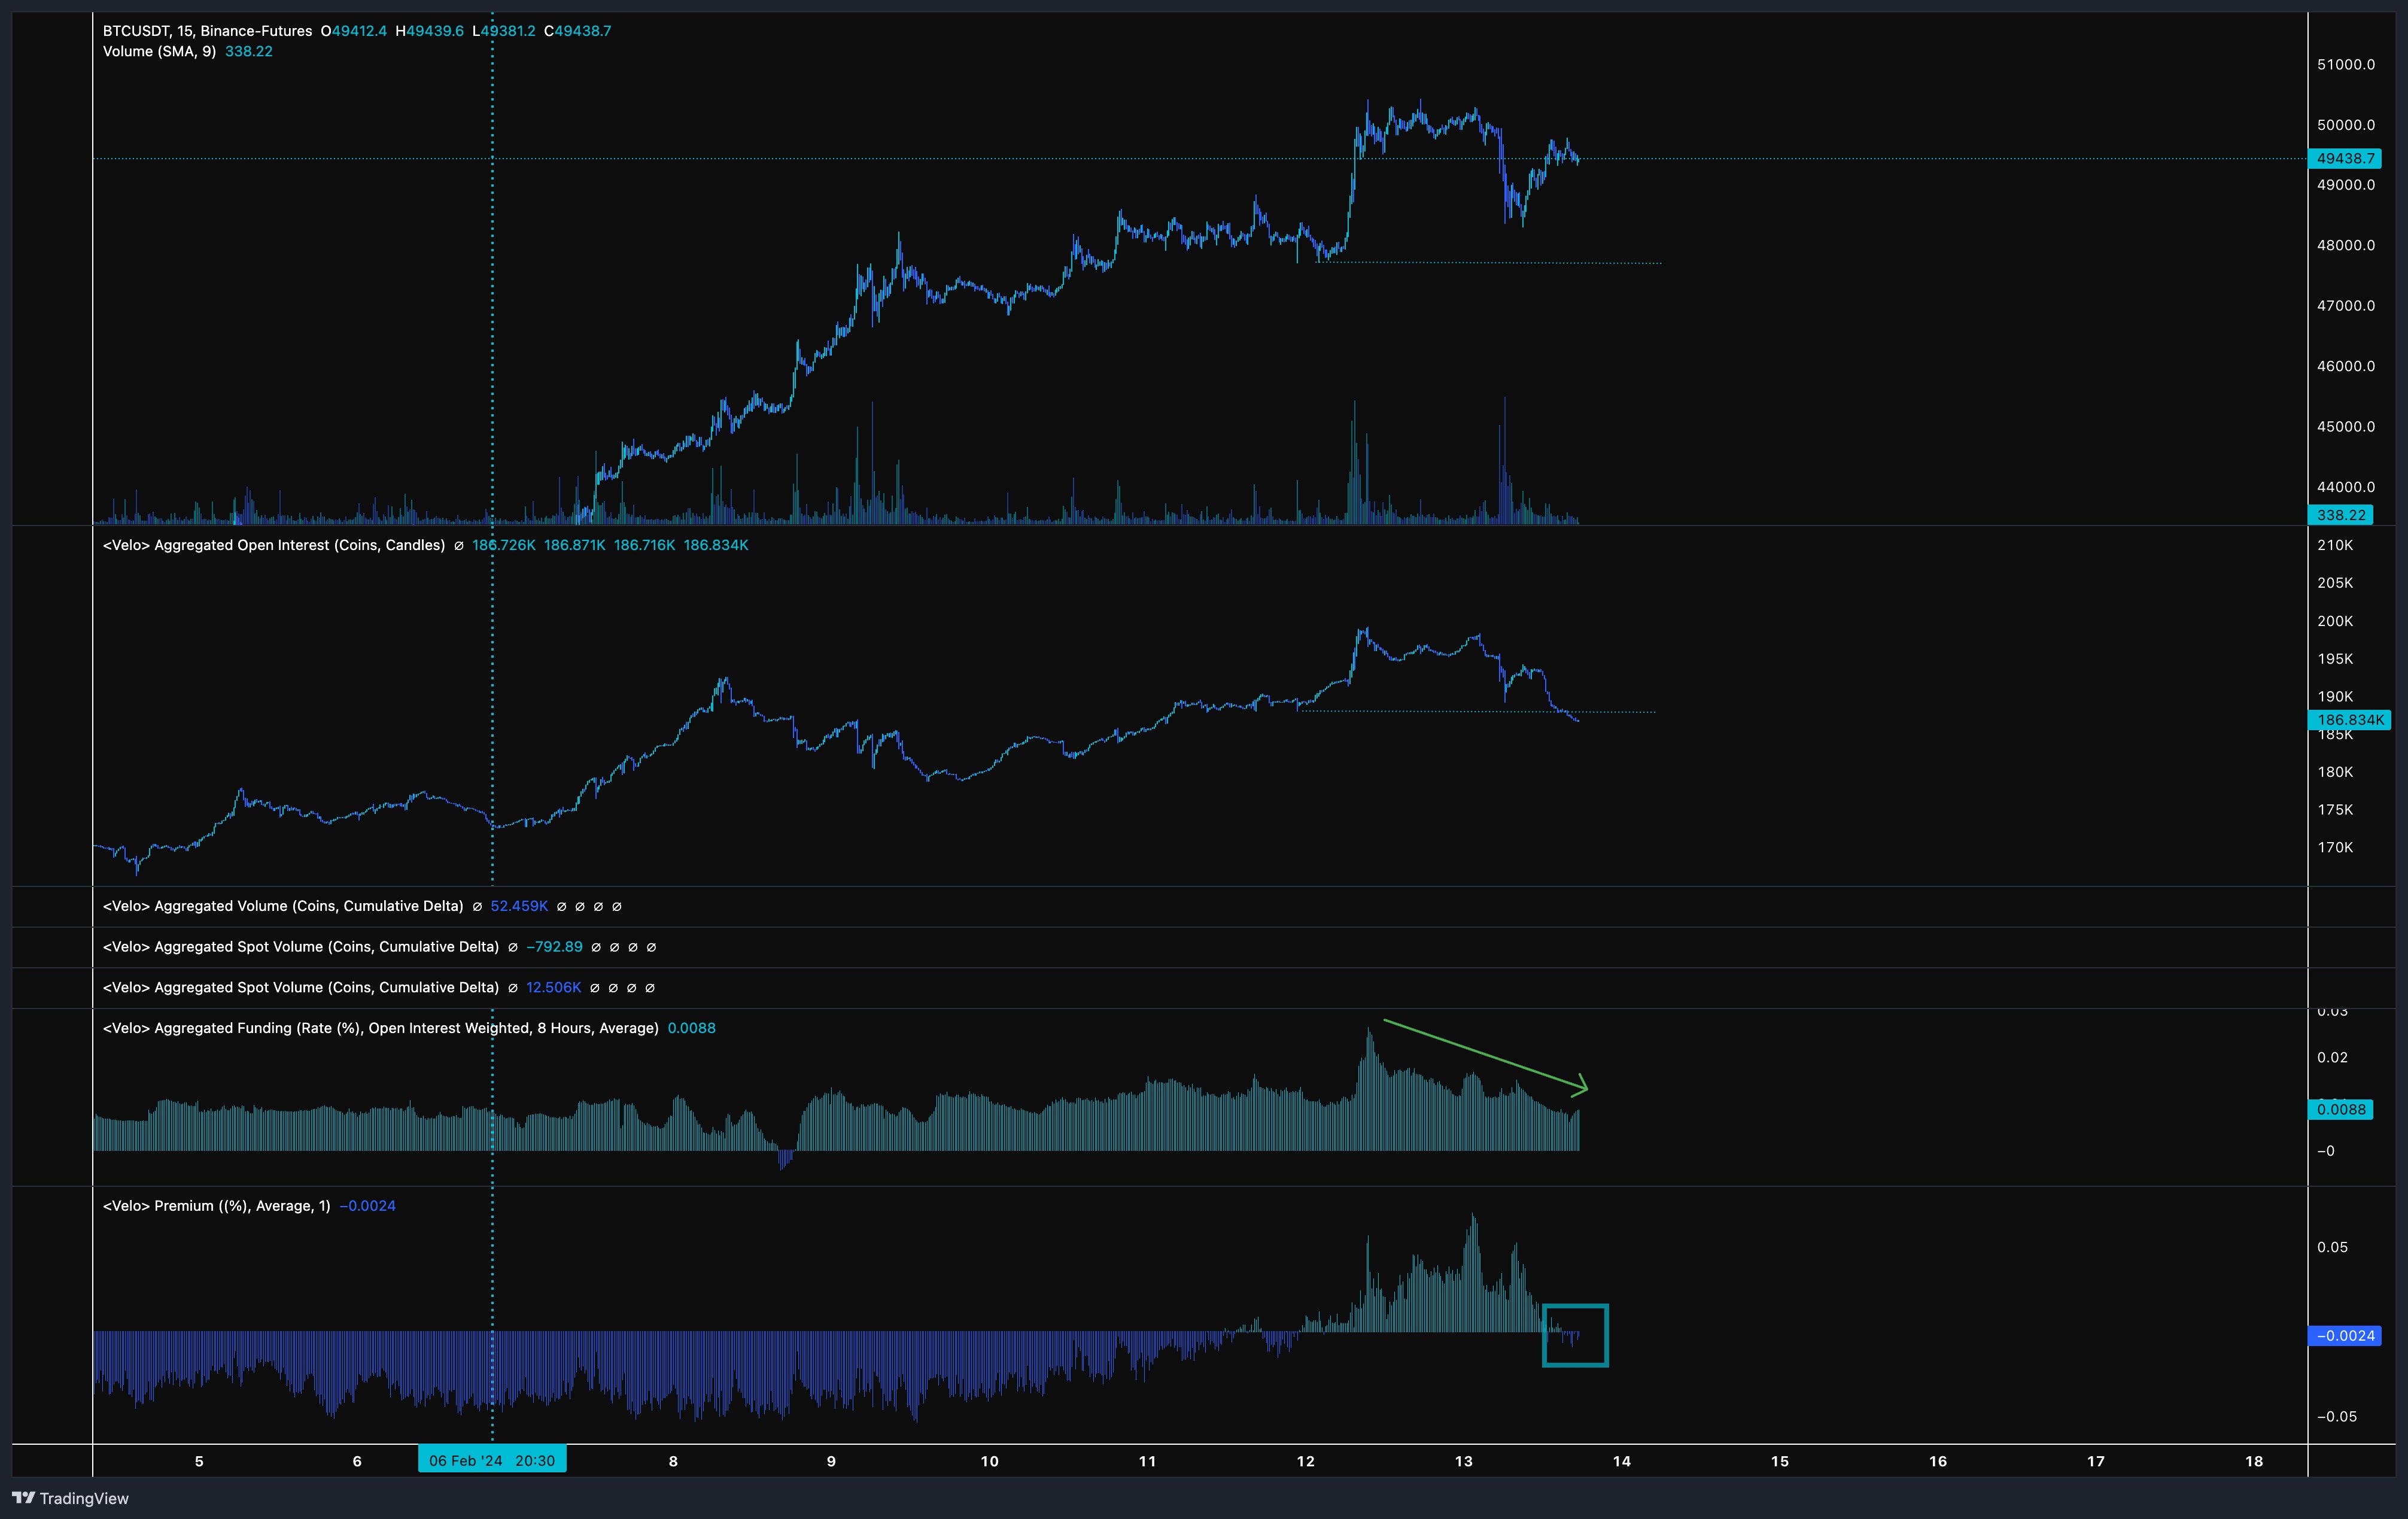
These observations suggested a healthy market correction rather than the start of a bearish trend, with the reset in open interest and the decrease in funding rates indicating that the market has absorbed the shock and is primed for upward movement.
In conclusion, The combination of record ETF inflows, alleviated concerns over Genesis’ GBTC liquidation, strong OTC demand, and favorable futures and spot market dynamics provides a compelling case for Bitcoin’s potential rally. Each of these factors, supported by expert insights and market data, underscores a growing investor confidence.
Ethereum Breaks Above $2,400: This Metric Points To Further Upside
On-chain data shows an Ethereum metric is giving a bullish signal as the cryptocurrency’s price has broken past the ,400 barrier during the past day.
Ethereum Has Continued To Leave Exchanges Recently
In a CryptoQuant Quicktake post, an analyst explained the recent relationship between the Ethereum price and data of the exchange netflow indicator.
The “exchange netflow” here refers to a metric that keeps track of the net amount of the asset entering or exiting out of the wallets of all centralized exchanges. The indicator’s value is calculated by subtracting the outflows from the inflows.
When the flow has a positive value, the inflows are overwhelming the outflows right now, and a net number of coins is moving into the custody of these platforms.
One of the main reasons investors might deposit their tokens on the exchanges is for selling-related purposes. This trend can potentially have bearish implications for the asset’s price.
On the other hand, the negative indicator implies the holders are making net withdrawals from these platforms. Such a trend suggests the investors may be accumulating for the long-term, which would naturally be bullish for the cryptocurrency’s value.
Now, here is a chart that shows the trend in the Ethereum exchange netflow, as well as its 14-day exponential moving average (EMA), over the last few months:

As highlighted by the quant in the above graph, the Ethereum price has observed an overall bullish trend in the last few months as the 14-day EMA exchange netflow has mostly been inside the negative territory.
There have been some spikes in the positive region. With these net deposits, the cryptocurrency has usually encountered some degree of resistance, implying that these transfers added to the selling pressure in the market.
Recently, the indicator has assumed red values for more than a week straight, suggesting that investors have been constantly making net withdrawals. The scale of the negative spikes has also been quite significant this time, meaning that some whales are involved.
Off the back of this potential accumulation from the investors, Ethereum has observed its recovery below the ,400 level. Since the netflow has continued to be quite negative recently, it’s possible that this rally isn’t all the coin would see; there may still be potential for further upside.
Spikes back into positive territory may be to watch for; however, if the pattern followed in the past few months is to be believed, they may cause the cryptocurrency to hit at least a local top.
ETH Price
At the time of writing, Ethereum is trading at around ,420, up more than 6% over the past week.