 Bitcoin’s price movements on April 10, 2024, showcased a day of significant volatility, with the cryptocurrency’s value swinging between ,207 and ,917. Oscillators and moving averages paint a complex picture of neutrality and cautious selling signals, amidst a backdrop of a .35 trillion market capitalization. Bitcoin’s stance of neutrality and period of consolidation precede the […]
Bitcoin News
Ethereum Technical Analysis: ETH Remains Range Bound With Neutral to Bullish Momentum

Ethereum’s price held above ,300 over the past 24 hours, ranging between ,266 and ,333. The cryptocurrency faces technical resistance at its recent highs according to an analysis of key oscillators and moving averages. These indicate continued neutral to bullish momentum over the past month across the daily, 4-hour, and 1-hour timeframes.
Ethereum
Key oscillators for ethereum (ETH) like the moving average convergence/divergence (MACD), awesome oscillator, and momentum indicators show positive momentum, trending upwards from earlier lows. However, the relative strength index (RSI) of 49.3 suggests potential overbought conditions. The Stochastic oscillator also indicates potentially overbought conditions at a neutral 50.9.
Moving averages (MAs) paint a definitively bullish picture, with ethereum’s price continuing to remain above its 10, 20, 50, and 200-day exponential MAs. The 10 and 20-day simple moving averages (SMAs) provide support. The data currently points to strong upward trending over the short, medium, and long term.
The short-term hourly chart shows volatility in price action despite the uptrend, as indicated by the drops after hitting ,333 per unit. ETH traders may look for pullbacks to swing lows or support levels to enter fresh long positions, using tight stop losses below recent lows to minimize risk.
The 4-hour chart smooths out the hourly volatility and noise, revealing sustained higher highs and higher lows. Traders could look for bullish continuation patterns for new long entries. However, ether’s failure to make new highs or break below recent higher lows would indicate weakness and bull exhaustion.
Overall, ether’s oscillators and MAs show a balanced and bullish momentum over the past month across timeframes. But the large drawdown on the daily chart suggests the potential for continued consolidation or a corrective period after the latest uptrend. Traders should watch key support levels if volatility increases.
Bull Verdict:
Overall, the oscillators and MAs indicate a bullish technical posture for ethereum over the past month across the daily, 4-hour, and hourly timeframes. While the leading crypto asset faces resistance at recent highs, the sustained uptrend suggests advantages for bullish traders on pullbacks to key support levels and continuation signals.
Bear Verdict:
Despite the bullish momentum over the past month, the large slide on the daily chart points to potential exhaustion or the top of the ethereum (ETH) uptrend. With oscillators nearing overbought territory, the technicals favor bearish traders looking to capitalize on a corrective period, particularly if the price breaks below key support levels that could signal a trend reversal.
Register your email here to get weekly price analysis updates sent to your inbox:
What do you think about ether’s market action on Monday morning? Share your thoughts and opinions about this subject in the comments section below.
Bitcoin Tests $25,000, Is BTC Bound For Bullish Continuation?
Bitcoin has rallied over the past week following the release of inflation figures in the United States. With a positive reaction from investors, BTC has consolidated above its yearly high and is currently retesting the next resistance level at ,000.
With an apparent easing of macroeconomic conditions and investors regaining confidence in the crypto industry, the market’s most prominent cryptocurrency appears poised for bullish continuation in the coming weeks.
At the time of writing, Bitcoin is currently trading at ,850 with a gain of 0.7% in the last 24 hours, indicating that BTC is forming a range for what appears to be a breakout above ,000.
Bitcoin continues to post huge gains in the seven-day timeframe, with an increase of 14.3%. And in the last 30 days, Bitcoin has continued to perform positively, with a growth of 9.6%.

Is BTC Poised For A Bullish Breakout?
As BTC spot positions continue to target the ,000 resistance level, options flows have become active recently, in line with Bitcoin price action.
According to data from crypto market research firm Deribit Insights, options activity is focused on the upside, with a significant amount of net call buyers between the ,000 and ,000 area, representing the zone of substantial interest for investors.
With February 24th options expiring in the 25K-30K range, call buying accelerates, and implied volatility (IV) rises as does spot. Deribit Insights says call spreads are “optimal buying structures as call skews and IV increase,” this market structure could support a continuation of the BTC rally.
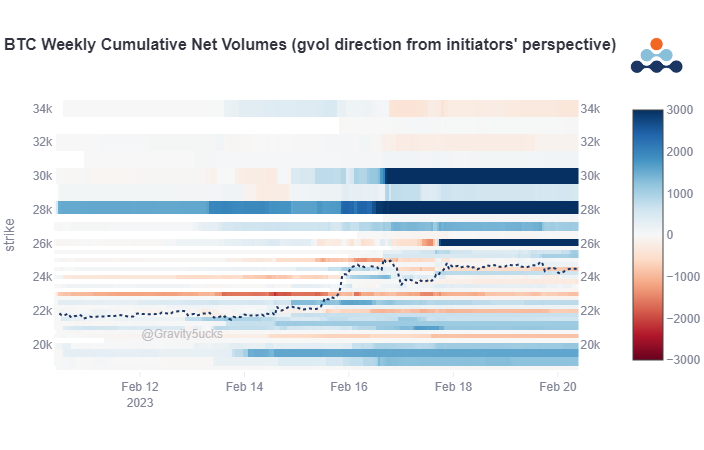
Both options and spot buying volume are increasing; bullish investor expectations characterize the market sentiment. In addition, BTC capitalization has marked a new 1-month high of 3.4 billion as the price of Bitcoin attempts to break and consolidate above the ,000 resistance level.
Checkmate For Bears?
While Bulls try another attempt on the next resistance wall around ,000 after multiple attempts, a “Notorious B.I.D” whale is buying spot price to push the price of Bitcoin up above the resistance zone, according to crypto market analysis firm Material Indicators Co-founder Keith Alan:
Multiple rejections from k correlates perfectly with BTC macro TA which is a valid reason to TP at these levels, but Notorious B.I.D. is still trying to push price up. Based on the history, and the potential to rip through upside illiquidity, I’m still scalping longs
In addition, Material Indicators added on a Twitter post that from a technical analysis (TA) perspective, the Bitcoin price made a local top, with ask liquidity spreading from the -25.5K range into the active resistance zone.
If Bitcoin breaks above the next obstacle, it could end the bear market for good. A full breakout by Bitcoin could position the largest cryptocurrency for new yearly highs and a possible climb to the k level. The current resistance level could be the last hope for the bears.
TA: Bitcoin Price Remains Range bound, Why There’s Hope of a Fresh Rally
Bitcoin started an upside correction from the ,150 zone against the US Dollar. BTC is back above ,200 and a break above ,500 could spark a fresh rally.
- Bitcoin is showing a few positive signs above the ,000 level.
- The price is trading above ,000 and the 100 hourly simple moving average.
- There is a key contracting triangle forming with support near ,200 on the hourly chart of the BTC/USD pair (data feed from Kraken).
- The pair could stage a fresh rally if there is a clear move above the ,500 resistance zone.
Bitcoin Price Recovers
Bitcoin price remained well bid above the ,150 level. BTC traded as low as ,138 and started a decent recovery wave. The price was able to recover above the ,800 and ,000 resistance levels.
There was a move above the 50% Fib retracement level of the downward move from the ,888 swing high to ,138 low. The bulls even pushed the price above the ,200 resistance zone. It is now trading above ,000 and the 100 hourly simple moving average.
There is also a key contracting triangle forming with support near ,200 on the hourly chart of the BTC/USD pair. Bitcoin price is showing a few positive signs above the ,000 level.
On the upside, an immediate resistance is near the ,475 level. It is near the 76.4% Fib retracement level of the downward move from the ,888 swing high to ,138 low. The next major resistance sits near the ,680 level.
Source: BTCUSD on TradingView.com
A close above the ,680 level might start a fresh surge to ,000. Any more gains might send the price towards the ,500 resistance zone.
Fresh Decline in BTC?
If bitcoin fails to recover above the ,680 zone, it could start a fresh decline. An immediate support on the downside is near the ,200 zone and the triangle lower trend line.
The next major support is near the ,000 level and the 100 hourly SMA. A clear move below the ,000 zone could set the pace for a fresh decline. In the stated case, the price may even test the ,500 level.
Technical indicators:
Hourly MACD – The MACD is now losing pace in the bullish zone.
Hourly RSI (Relative Strength Index) – The RSI for BTC/USD is now above the 50 level.
Major Support Levels – ,200, followed by ,000.
Major Resistance Levels – ,500, ,680 and ,000.
Shiba Inu Down By 2.03% – Yet Bound To Outpace TRX And BTC?
Shiba Inu price has dipped by 2.03% overnight and is now at a current price of 0.000012 USD. Nevertheless, the most popular meme coin is now ranked as the 15th largest crypto according to market cap.
SHIB currently has a live market cap of ,573,280,152 USD and with 8,085,679 USD of 24-hour trading volume. The coin currently has a total circulating supply of 549,063,278,876,302 SHIB coins.
Despite the entire crypto space in the red for the past couple of months, SHIB has been performing well and have in fact raised their price by 31%. With that being said, many crypto investors have started to take SHIB way seriously.
In the face of the crypto crash and with major cryptocurrencies like Bitcoin, Ethereum, and others bleeding, Shiba Inu was still able to resuscitate many crypto wallets.
Shiba Inu Can Outperform TRX and BTC?
Shiba Inu has in fact outperformed Bitcoin and is gaining traction despite the turbulent crypto crash happening. The meme coin has been taking strides in maintaining the uptrend pattern. It has been consistently going for that positive momentum with much collaboration and projects happening that will ultimately take SHIB to the next level.
SHIB investors loved the experience of having a 34% boost with a breakout point pinned at US00116 as seen in the Shiba Inu price in June this year. The token is definitely winging it with a bullish streak signaling that the market is steering closer to a bullish run.
Many SHIB investors are looking forward and optimistic for the meme coin to go over the US.0000139 zone very soon.
With the issue concerning Shiba Inu hitting , Ethereum whales have definitely set their eyes on the top meme coin to gain as much as 11% and 24% respectively this current month.
The overall market trend is looking bullish for SHIB and the trajectory is uphill. With that in mind, many ETH whales have been hoarding and adding a total of 0 million SHIB tokens into their portfolios; that consist of around 22% of their entire digital assets.
SHIB total market cap at .57 billion on the daily chart | Source: TradingView.com
SHIB To Launch SHIB.io Metaverse
SHIB investors are also excited with Shiba Inu developmental projects in collaboration with The Third Floor such as Shibarium, which is a SHIB.io metaverse together with the SHIBASWAP V2 and SHI token that aims to design virtual environments or a metaverse.
Shiba Inu has recently launched this burning portal that is designed to reward investors. With the increased amount of pressured placed on the demand and supply of SHIB, the meme coin also skyrocketed in price.
SHIB is now outpacing Tron (TRX) in terms of total market cap. Tron has a market cap of .33 billion while SHIB has a total market cap of .66 billion.
The total SHIB supply is currently at 589,625,603,102,909 and the total that has been burned out of the initial supply is at 410.37 trillion.
Featured image from BeChewy, chart from TradingView.com
NewsBTC
Bitcoin Bound To Bounce Back, Rockefeller Exec Says
Rockefeller International’s Managing Director and Chairman, Ruchir Sharma, argues that Bitcoin (BTC) is really a brilliant concept. One that has been destroyed by excessive speculative fervor and easy access to cheap capital.
Bitcoin Rebound Is A Matter Of Time
Sharma, a New York Times bestselling author and former emerging markets investor at Morgan Stanley (MS), predicted that bitcoin could experience a comeback similar to that of Amazon. Amazon’s value fell by about 90% during the early 2000s dot-com collapse but increased by more than 300 times over the course of the following 20+ years.
Although Sharma agrees that there may be more turbulence for bitcoin and the larger world of digital assets over the next months, this may also serve to remove weak players from the market. Some claim that has already occurred.
According to him, Bitcoin is still “caught up in this speculative mania,” and is still indicating a partial worldwide collapse. He brought up the Amazon incident again, noting that it took the company some time to recover. The shares of the online store needed some time to match and surpass its frothy 1999 level.
Reltaed reading | TA: Bitcoin Price Trims Gains, Key Breakdown Support Nearby
The early 2000s dot-com bust led to a huge decline in the value of Amazon’s shares. However, during the course of the following 20 years, the value of the shares was able to increase by a factor of more than 300.
He noted:
“I’m not willing to call the [market] bottom as of yet on bitcoin and cryptocurrencies. The U.S. bear market regime, which is the driver of risk appetite around the world, is still very much in play.”
As a result of the continuous slide in U.S. stocks, Sharma also forecasted severe drops in Bitcoin and other digital assets during the ensuing six months. He made the point that during bear markets, which continue for about a year, stocks frequently decline by 35%. During this bear market that has only been going on for less than a year, the S&P 500 has only fallen by 20%.
BTC/USD slides below k. Source: TradingView
Reliance On Greenback May Stop
Sharma is in favor of a monetary system that is not dominated by the US dollar. He said that although there hasn’t been a currency that can replace the dollar, bitcoin might be the solution.
“The dependence on the U.S. dollar, in general, cannot continue. There is a need for having another currency out there with some transactional need, which is a bit more stable in value. Three to five years from now, hopefully BTC will emerge as a more stable asset.”
Sharma mentioned the Federal Reserve’s moves as well, saying that he didn’t foresee the risk appetite opening up just yet.
Related Reading | Bitcoin On-Chain Data: Miners Deposit Big To Derivatives Exchanges
Featured image from iStock photos, charts from TradingView.com
NewsBTC
Solana Prices South Bound; Will It Revisit $80 Soon?
Solana depreciated by almost 6% over the last 24 hours as the broader market started to get choppy. Bitcoin was seen trading below the ,000 mark while Ethereum broke the support level of ,000.
The global market currency cap stood at .94 Trillion after a fall of 6% over the past day.
Solana had depicted considerable recovery on charts as it broke subsequent price ceilings over the past week.
The coin had managed to revisit the 0 level which the coin hovered near thrice in the past week or so. Following the recent dip, buyers decided to exit the market as the coin witnessed a sell-off as seen on the four-hour chart.
Solana Price Analysis: Four Hour Chart
Solana is nearing its immediate support level on the four-hour chart. Image Source: SOL/USD on TradingView
Solana was priced at 0 at the time of writing. The altcoin lost close to 6% of its value over the last 24 hours. SOL had noted a sharp recovery on the 18th of April and it challenged its resistance mark of 0.
At press time, SOL was aiming for its nearest support level of . The coin was trading in a descending trendline, which signifies that SOL could continue in its downward trajectory. From the four-hour chart, it signalled that Solana was undergoing a price correction.
If the bears continue to exert dominance, Solana would immediately fall by 4%. A fall from the price level would push prices to and then finally undergo a depreciation of 18% and land at .
Trading volume had dipped but was in the green, which could also mean that buying pressure was increasing at the time of writing.
Related Reading | Is Bitcoin Gonna See Another Big Drop Soon? Historical Trend May Say Yes
Technical Analysis
Solana recieved increased selling pressure on the four-hour chart. Image Source: SOL/USD on TradingView
Solana had experienced a bout of buying pressure when the coin soared on April 18th. At the time of writing, the coin witnessed a surplus of sellers.
On the Relative Strength Index, the indicator was seen below the the half-line which is indicative of increased selling strength, however there was a slight uptick on the RSI. This uptick could mean that buying strength would pick up over the next trading sessions.
On the 20-SMA, SOL was placed underneath the 20-SMA line. This referred to sellers driving the price momentum in the market.
Solana continued to depict downtrend on the four-hour chart. Image Source: SOL/USD on TradingView
Solana was on a continued price correction as seen from the above chart. MACD which is responsible for determining the market momentum indicated bearishness in the market. On the aforementioned indicator, the coin displayed a bearish crossover at the time of writing.
It also displayed small red histograms which signified that SOL would continue on a negative price action. Investing in Solana at the moment doesn’t seem to be a wise decision. For the coin to see some respite, it had to break above the 0 price mark and trade over it for a considerable period of time.
The Parabolic SAR which determines a stop-loss order, has demonstrated dotted lines above the price candlesticks which is synonymous to a negative price movement.
Related Reading | Bitcoin Under Pressure Near K, Here Are 2 Reasons Why That Could Change Soon
Featured image from Unsplash.com, charts from TradingView.com
NewsBTC
Disrupting Narratives: Is Bitcoin Bound For Longer Cycles With Diminishing Returns?
After one of Bitcoin’s worst drops in its history, many people wonder if the crypto market has reached a top. The market was hit by FUD after FUD, and it negatively impacted some holders. Many retail investors panic sold their coins. January 2018 flashbacks kicked in and suddenly there was talk of the start of a new bear market.
For months, the crypto space around Bitcoin has been dominated by bullish narratives of institutional adoption, BTC as a store of value stealing gold’s shine. “Up only” became something more than a meme, it was a conviction right until the moment when the prices broke below every critical support.
Despite its apparent sudden execution, BTC’s price crash was predicted by many experts able to read the signs and indicators that go beyond the narratives. Anonymous analyst “John Nash” has been studying this phenomenon for some time and came up with an interesting theory.
“Nash” reviewed BTC’s previous cycle to counter “moonboism”, a made-up condition suffered by those investors with an everlasting “Up Only” sentiment. As the chart below shows, every BTC since 2021 shared a characteristic: they tend to be longer than its predecessor and offer less return on investment (ROI).

Bitcoin’s first cycle began in 2011 with an 8-month duration. During this period, BTC’s price went from below to around . The second cycle started somewhere in 2013 and lasted for about 7 months with 2 different peaks at the end of that year and in 2014.
Bitcoin’s third cycle has been the longest, so far, with a 35-month duration. The current cycle has extended for 28 months, the analyst said:
Cycles clearly lengthen, ROI clear diminishes (the law of diminish returns). Whoever still believes in 4-year cycle and constant ROI is clearly in denial/delusion.
Beware Of Bitcoin’s Price Narratives
From the chart presented by the analyst, he presents 3 possible scenarios. A peak of the current cycle by summer 2022, an extension of the cycle until October 2022, if it follows the same length as the previous cycle.
Finally, the least likely scenario and the most optimistic is a peak of the cycle by December 2021. It is possible to assume, based on the previous argument, that the shorter the cycle, the more explosive the ROI. So, if this scenario plays out BTC could see massive gains.
In a separate post, the analyst warns investors about narratives, this can be powerful to drive new users, but equally dangerous if blindly follow. Based on Metcalfe’s law, used to describe the curve of adoption of new technology, “Nash” made the following conclusion:
During the past decade Bitcoin has been following adoption curve/Metcalfe’s law more or less steadily, however, with one peculiar property. Since Bitcoin’s network growth is directly expressed in monetary value it is prone to speculative episodes i.e. bubbles.
Using a logarithmic growth curve (LGC) is possible to determine BTC’s true bottom and top, the moment when the curve will start to flatten and fewer users will enter the network. This will be accompanied by more maturity (time) and less volatility for BTC’s price.
The analyst rejects models that predict a BTC price appreciating to infinity, he believes that no Bitcoin cycle outperforms its previous overextension.
In other words, it is less likely for BTC to reach an all-time high price if the grown expressed in percentage is higher than in 2017. At the time, BTC went from ,000 to ,000 increasing by 1,900%. Then, for the cryptocurrency to rise from ,000 to 0,000 in this cycle would represent a 900% increase. A plausible price according to this theory.
BTC trades at ,112 with losses in all time frames. The monthly chart has been the most affected with a 37.3% loss, at the time of writing.

Up 138% in one week, is Filecoin bound for a crash?
After a rough start, Filecoin has managed to break into the top 10 leading cryptocurrencies by market capitalization. After overtaking Chainlink (LINK) and Theta Network (THETA), with a rally of 138% in one week and 418% in one month, FIL took over the tenth position.
Founded by Juan Benet, creator of the InterPlanetary Files System (IPFS), and developed by Protocol Labs after receiving 7 million in its Initial Coin Offering, the platform has managed to attract a lot of attention in China, as journalist Colin Wu reports.
Data shared by Wu indicates that FIL has seen a 30% increase in its trading volume for the last 24 hours on Huobi’s platform. The cryptocurrency has managed to reach a new all-time high based on increased buying pressure and demand for the cryptocurrency.
The daily trading volume stood at .2 billion. In contrast, the daily trading volume for Ethereum stood at .8 billion and .8 billion for Bitcoin. The rapid increase in price has had negative consequences for investors with short positions, as Wu notes:
FILDOWN, a short-selling leveraged token in Binance FIL, plummeted by 53%, with a turnover of US.4 billion, indicating a large number of short FIL liquidation in Binance.
Increase in institutional demand for Filecoin
Additionally, Wu recorded an increase in transactions for the FIL/USD pair on Coinbase’s Pro trading service. After FIL’s price surpassed the 0 barrier, “transactions with high credibility were recorded on Coinbase,” according to the journalist. Wu added:
Distributed storage has become popular. Filecoin continues to climb to 136U, HOT has risen by nearly 40% and 2500% year-to-date, its market value is close to that of HT, the token of China’s largest exchange.
FIL’s price appears to have increased following the launch of Grayscale’s Trust based on this and other cryptocurrencies to expand its product suite. In addition, the teams behind platforms Filecoin and Livepeer have announced a “co-mining” program. According to an official release:
Livepeer is launching a co-mining pilot with Filecoin to enable Filecoin miners to become Livepeer video miners while continuing to mine on the Filecoin network by storing transcoded video data.
Thus, miners of these cryptocurrencies will be able to obtain higher profits and “additional economic opportunities”. Filecoin’s mining mechanism requires miners to obtain token FIL to make a “bid/initial response”. The latter has contributed to the increase in buying pressure for the token.
Demand from companies and start-ups to use Filecoin’s platform also seems to be accelerating, as indicated by a recent report from its team.
📢 ANNOUNCEMENT: We are less than 1 month away from the Filecoin Frontier Accelerator #DemoDay with @LongHashVC! Watch 11 blockchain startups using Filecoin’s storage & distribution network pitch to you at 9am (GMT+8) on April 23rd.
RSVP here: https://t.co/uiNPYQLdxY
— Filecoin (@Filecoin) April 1, 2021
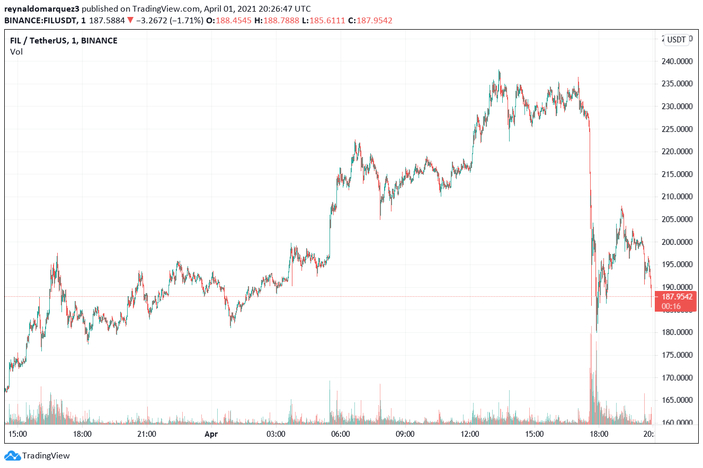
Trader Fiskantes believes the coin is “massively overvalued” and could see a 90% drop. This is mainly based on FIL’s increase supply that will double in the next 3.5 years. However, the high number of partnerships and interest from China could contribute to the prolongation of this token’s rally. At the time of writing, FIL is trading 0 with gains of 3.8% in the last 24 hours.
Fakeout or Breakout? Technicals Suggest Bitcoin Is Bound For a Correction
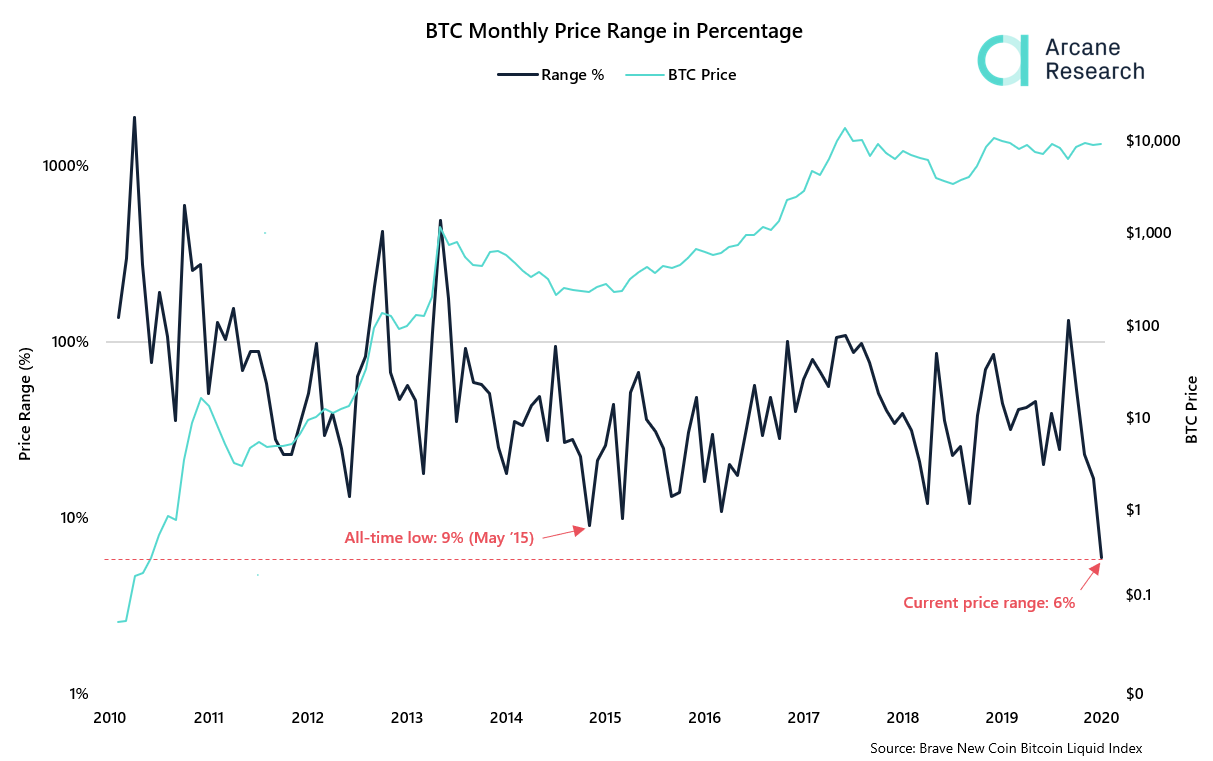
Bitcoin’s lackluster price action reached a pivotal point throughout July. As the range where it was trading was narrowing over time, BTC’s price reached the lowest levels of volatility ever recorded in its 11-year history, according to Arcane Research.
“With only 11 days left of July, we’re currently seeing the tightest monthly price range in Bitcoin’s history! We have never seen a price range this low (currently 6%), with the all-time low being 9% from May 2015,” said data-driven analytics firm.
Bitcoin's Monthly Price Range Hits New All-Time Low. (Source: Arcane Research)
Nevertheless, the flagship cryptocurrency kicked off Tuesday with a bang. Its price appreciated by 2.90% to hit an intraday high of ,440. The bullish price action got many market participants excited about what the future holds for Bitcoin, but a particular technical index suggests that the upswing could be part of a fakeout.
The TD Sequential Turns Bearish On Low Time Frames
The Tom Demark (TD) Sequential indicator has been crucial in identifying Bitcoin’s price action. Not only was this gauge able to anticipate in mid-February that BTC was poised for a steep decline, but in mid-March, it presented a buy signal that led to its run-up to ,000 before the halving.
Now that the pioneer cryptocurrency has posted significant gains over the past few hours, the TD setup estimates that a pullback is underway.
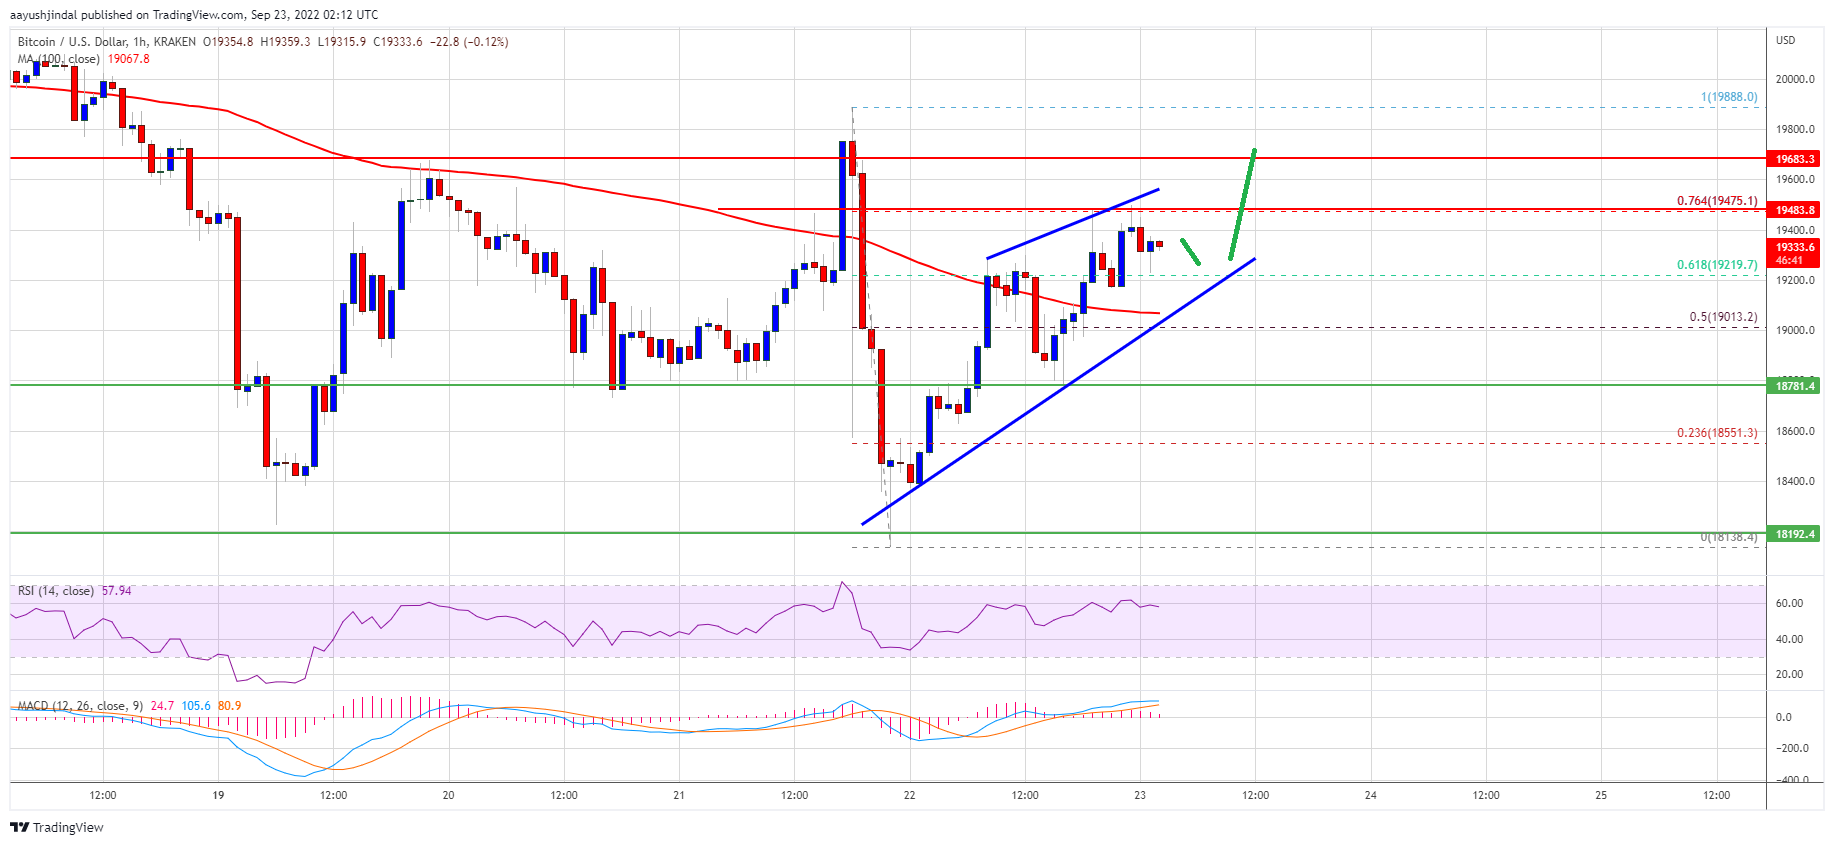
Based on BTC’s 45-min, 30-min, and 15-min charts, the renowned index presented sell signals in the form of green nine candlesticks. These bearish formations forecast a one to four candlesticks correction or the beginning of a new downward countdown.
TD Setup Presents Sell Signal For Bitcoin Across Multiple Time Frames. (Source: TradingView)
A red two candlestick trading below a preceding red one candle, within any of the time frames previously mentioned, can serve as confirmation of the pessimistic outlook.
Massive Support Wall Ahead
If sell orders begin to pile up, IntoTheBlock’s “In/Out of the Money Around Price” (IOMAP) model suggests there is a considerable supply barrier that may prevent Bitcoin from a steep decline. Based on this on-chain metric, the area between ,130 and ,400 is on the most significant support walls ahead of the bellwether cryptocurrency.
Around these price levels, roughly 3 million addresses had previously purchased nearly 1.80 million BTC.
Holders within this price range may try to remain profitable in the event of a downswing. They may even buy more Bitcoin to allow its price to bounce back up.
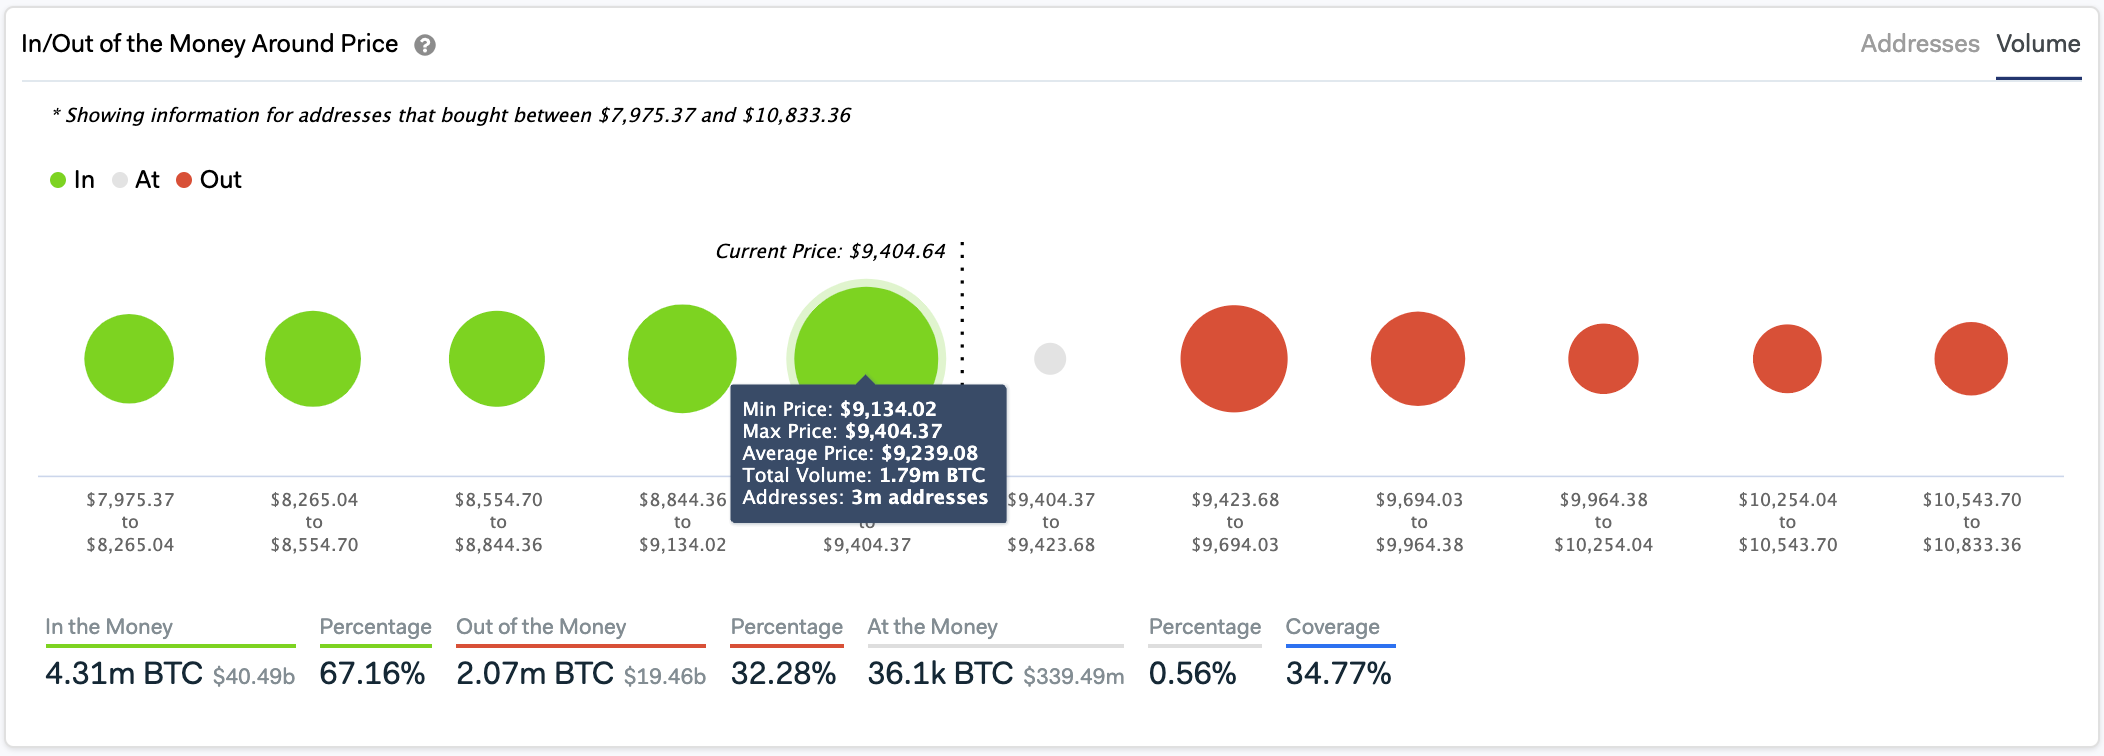
Massive Support Barrier Ahead of Bitcoin. (Source: IntoTheBlock)
On the flip side, the IOMAP cohorts show that approximately 1.20 million addresses bought over 800,000 BTC between ,420 and ,700. If Bitcoin is able to move past this hurdle, it would likely be able to resume the uptrend seen in the past few hours.
Featured Image by Depositphotos
Price tags: btcusd
Chart from TradingView.com