 Following the BCH Bliss conference, a focal event for Bitcoin Cash enthusiasts held May 14-15 in Ljubljana, Slovenia, Jonathan Silverblood introduced a Bitcoin Cash Podcast on X, featuring a collection of tracks from the event. This gathering also celebrated the “Jessica” upgrade, which launched the network’s innovative adaptive block size limit. BCH Bliss 2024: A […]
Bitcoin News
Crypto Chaos Meets BONK Bliss: 15% Rally Bucks The Trend
In a market dominated by red arrows, one Solana-based meme coin is swimming against the tide. BONK, the self-proclaimed “first Solana dog coin,” has soared a staggering 15% in the past 24 hours, emerging as a beacon of green amidst a sea of plummeting peers.
While Dogecoin and Shiba Inu wallow in double-digit losses, BONK has bucked the downtrend, leaving investors wondering if this canine crusader has the bite to back its bark.
But BONK’s bullish gallop isn’t an isolated thing. This week has seen the meme coin rise 10%, propelling its value to .00001363 – a testament to its impressive medium-term momentum.
Positive Forecast For BONK
Analysts predict this positive trajectory to continue, especially if tomorrow’s highly anticipated decision by the US Securities and Exchange Commission (SEC) on Bitcoin ETFs paves the way for a broader market bull run.
In such a scenario, BONK’s potential for disproportionate gains, even eclipsing Shiba Inu’s, is a tantalizing prospect for risk-tolerant investors.
Fueling BONK’s ascent is a potent cocktail of positive factors. Its social engagement has nearly doubled, sparking a buzz that translates into tangible market momentum.
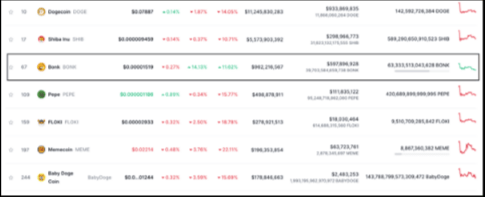
Trading volumes have skyrocketed 130%, reaching a staggering 5 million in the past day – more than twice that of Shiba Inu, showcasing the surging interest from retail investors.
This surge in activity has catapulted BONK’s market cap past 0 million, cementing its place as the 81st largest digital asset, a remarkable feat for a relatively young project.
Further driving BONK’s appeal is its upcoming listing on OKX, a leading global cryptocurrency exchange. This strategic move promises to broaden BONK’s reach and expose it to a wider audience, particularly within the Solana ecosystem.
The potential surge in investor interest this listing could trigger could be a significant catalyst for future price appreciation.
BONK Technical Overview
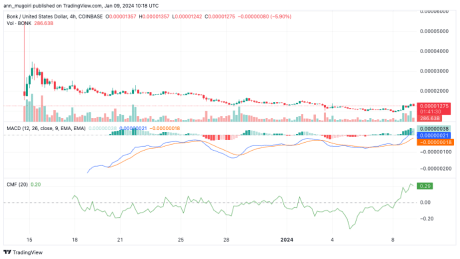
Technical indicators add to the optimistic picture. BONK currently dances above both the 10-day and 200-day Simple Moving Averages (SMAs), signaling robust buying pressure.
The 20-day Exponential Moving Average (EMA) sits comfortably above the 50-day EMA, reinforcing the upward trend. And for good measure, the Chaikin Money Flow index flashes a bullish .20, painting a picture of healthy and sustained buying interest.
However, as with any cryptocurrency, caution is paramount. Meme coins are notorious for their volatility, and BONK’s recent gains are no guarantee of future glory.
Regulatory uncertainties surrounding the SEC’s decision further cloud the outlook. Additionally, BONK’s fortunes remain tied to the overall health of the cryptocurrency market.
Despite these caveats, BONK’s performance stands out like a sore thumb in the current market landscape.
Its technical indicators, combined with its growing social buzz and strategic moves like the OKX listing, present a compelling case for the meme coin’s continued ascent.
Whether BONK dethrones Shiba Inu to become the king of meme coins remains to be seen, but one thing’s for sure – this Solana underdog is barking loud enough to turn heads in the crypto arena.
Featured image from Freepik
After Six Months of Bliss, Litecoin (LTC) Might be Preparing to Sink to $60
- Litecoin (LTC) slide 4.9 percent
- Halving talk dominates, demand expected to increase
Like Bitcoin (BTC), Litecoin is peaking, dropping 11.4 percent from last week’s close. That’s despite the impending block reward reduction, set to activate in early August, and other inbound positive fundamental factors. All in all, any break out above 0 will catalyze participation, driving demand, wiping the losses of May 30’s downturn.
Litecoin Price Analysis
Fundamentals
In the top 10, Litecoin (LTC) is one of the best performing digital assets. Six months after bottoming, the sixth most valuable coin is up five-fold, cementing its position in the top 10. Fueling this upswing are several factors including the rise of Bitcoin and well, Litecoin halving.
The halving is an event coded into Litecoin’s code, which cuts the amount of LTC issued per block in half. Within the Litecoin network, this occurrence activates after every 840,000 blocks. Trackers indicate that the impending halving is less than 62 days away, planned for -early August. As a result of this, traders are ecstatic, keen on reaping dividends from the expected inflation reduction.
Drawing conclusions from past events, the halving will reduce the coin in circulation by slashing daily rewards. Therefore, it is no wonder analysts are linking recent rally with this scheduled event. But, there’s more.
Litecoin as a network is largely successful. Its hash rate is at record highs, hinting at increasing levels of investment, which in turn improves the blockchain’s security. Besides, LTC is liquid, and is accepted as a form of digital currency by many merchants.
Candlestick Arrangement
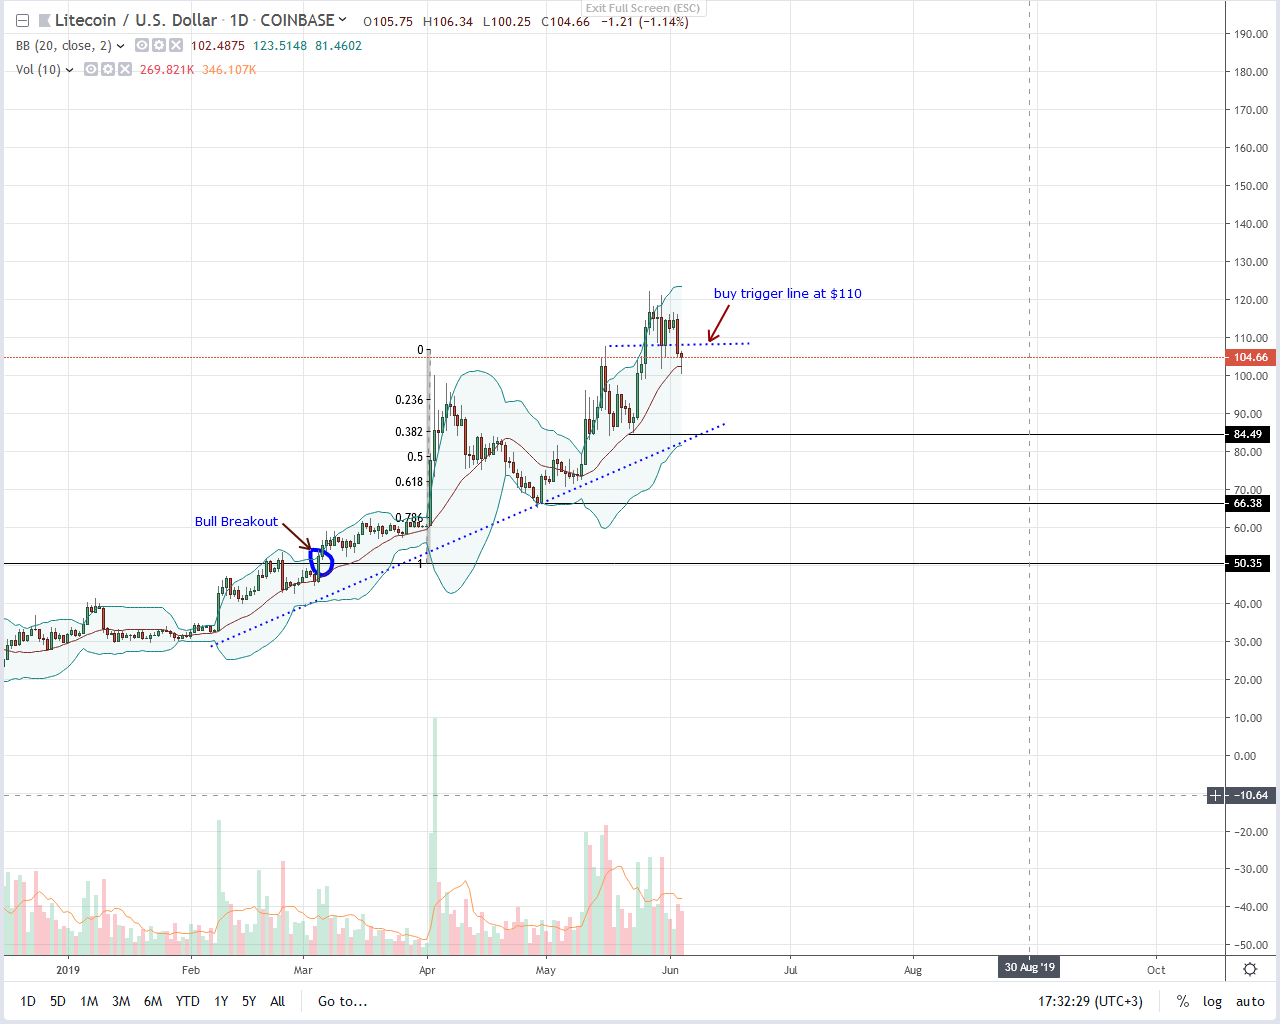
Down 11.4 percent week-to-date, LTC is stalling. Obstructing the next wave of upward price action are active bears at 0. From the chart, LTC is still in range, within a range between 0 and 0. Even though buyers are in control, there is currently resistance for higher highs.
Odds of a correction are high since prices are within May 30th bear candle, which is extensive, completing the three candle bear reversal pattern. That is despite today’s bar trending with a long lower wick revealing support in smaller time frames.
While the trend is up, aggressive traders can take advantage of the dip and buy the correction. The immediate target is 0. However, this plan is valid as long as LTC fails to drop below the 38.2 percent Fibonacci retracement of May trade range at . If bears flow back driving prices below this mark, LTC could drop to , retesting May’s low before snapping back to trend.
Technical Indicator
Anchoring this trade plan is May 30th candle. It has high trading volumes of 605k against 368k. If today’s prices end up closing below the middle Bollinger Band (BB), confirming bears of late May with the average trading volumes mentioned, LTC could end up sliding to . Conversely, any rally above 0 with high participation preferably exceeding 605k or 803k of May 16th will prop bulls aiming at 0.
Chart courtesy of Trading View. Image Courtesy of Shutterstock
The post After Six Months of Bliss, Litecoin (LTC) Might be Preparing to Sink to appeared first on NewsBTC.