Key Points
- Bitcoin cash price settled below the 0 and 0 support levels against the US Dollar.
- There was a break below an ascending channel with support at 2 on the hourly chart of the BCH/USD pair (data feed from Kraken).
- The pair could correct higher, but it is likely to face sellers near the 0 or 0 resistance level.
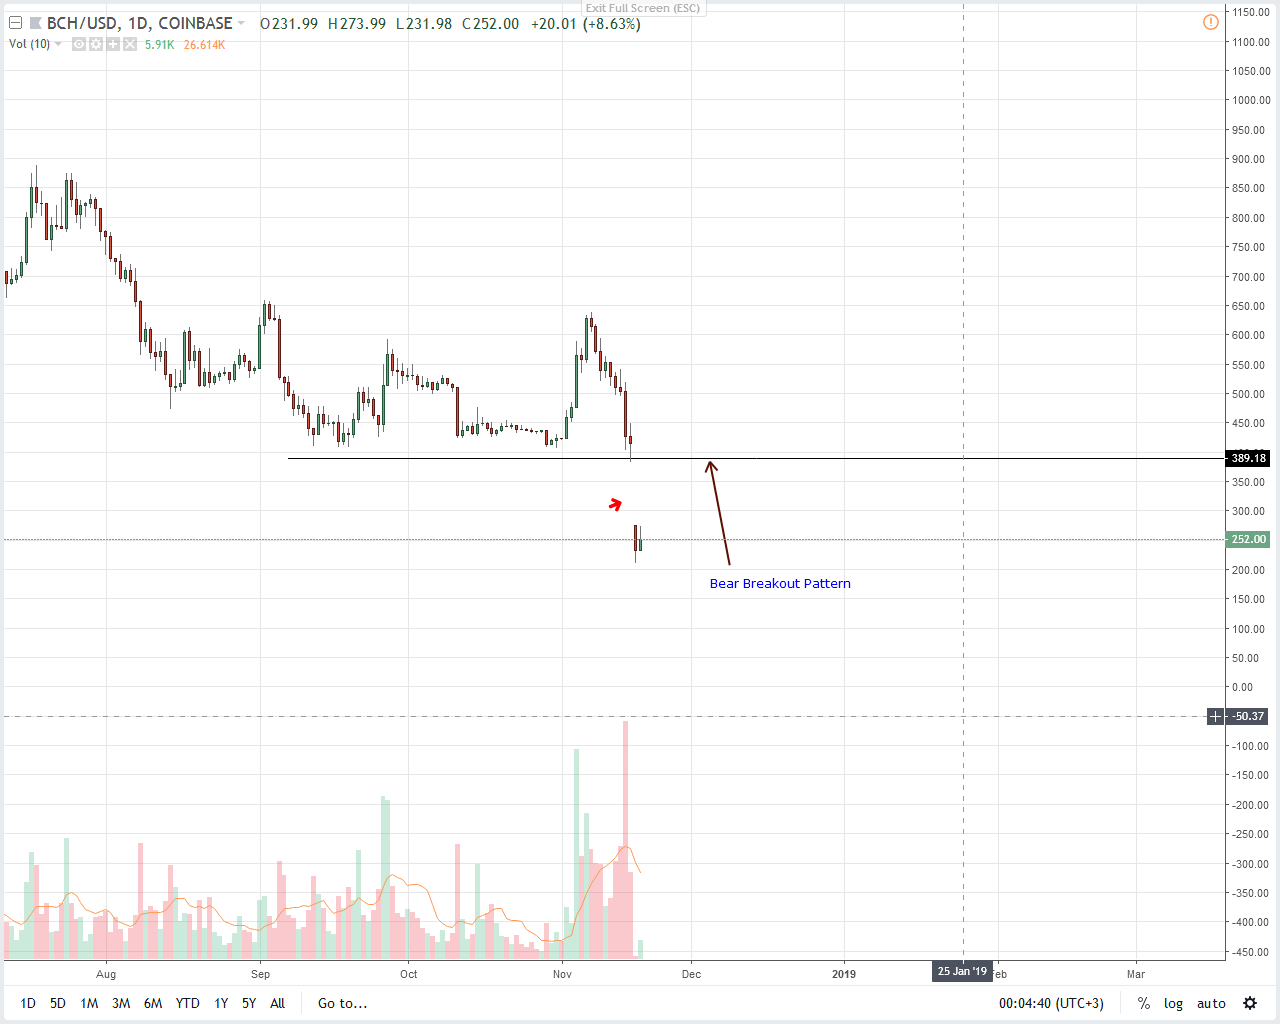
Bitcoin cash price moved back in a bearish zone below 0 against the US Dollar. BCH/USD could decline towards 0 as long as it is below 0.
Bitcoin Cash Price Analysis
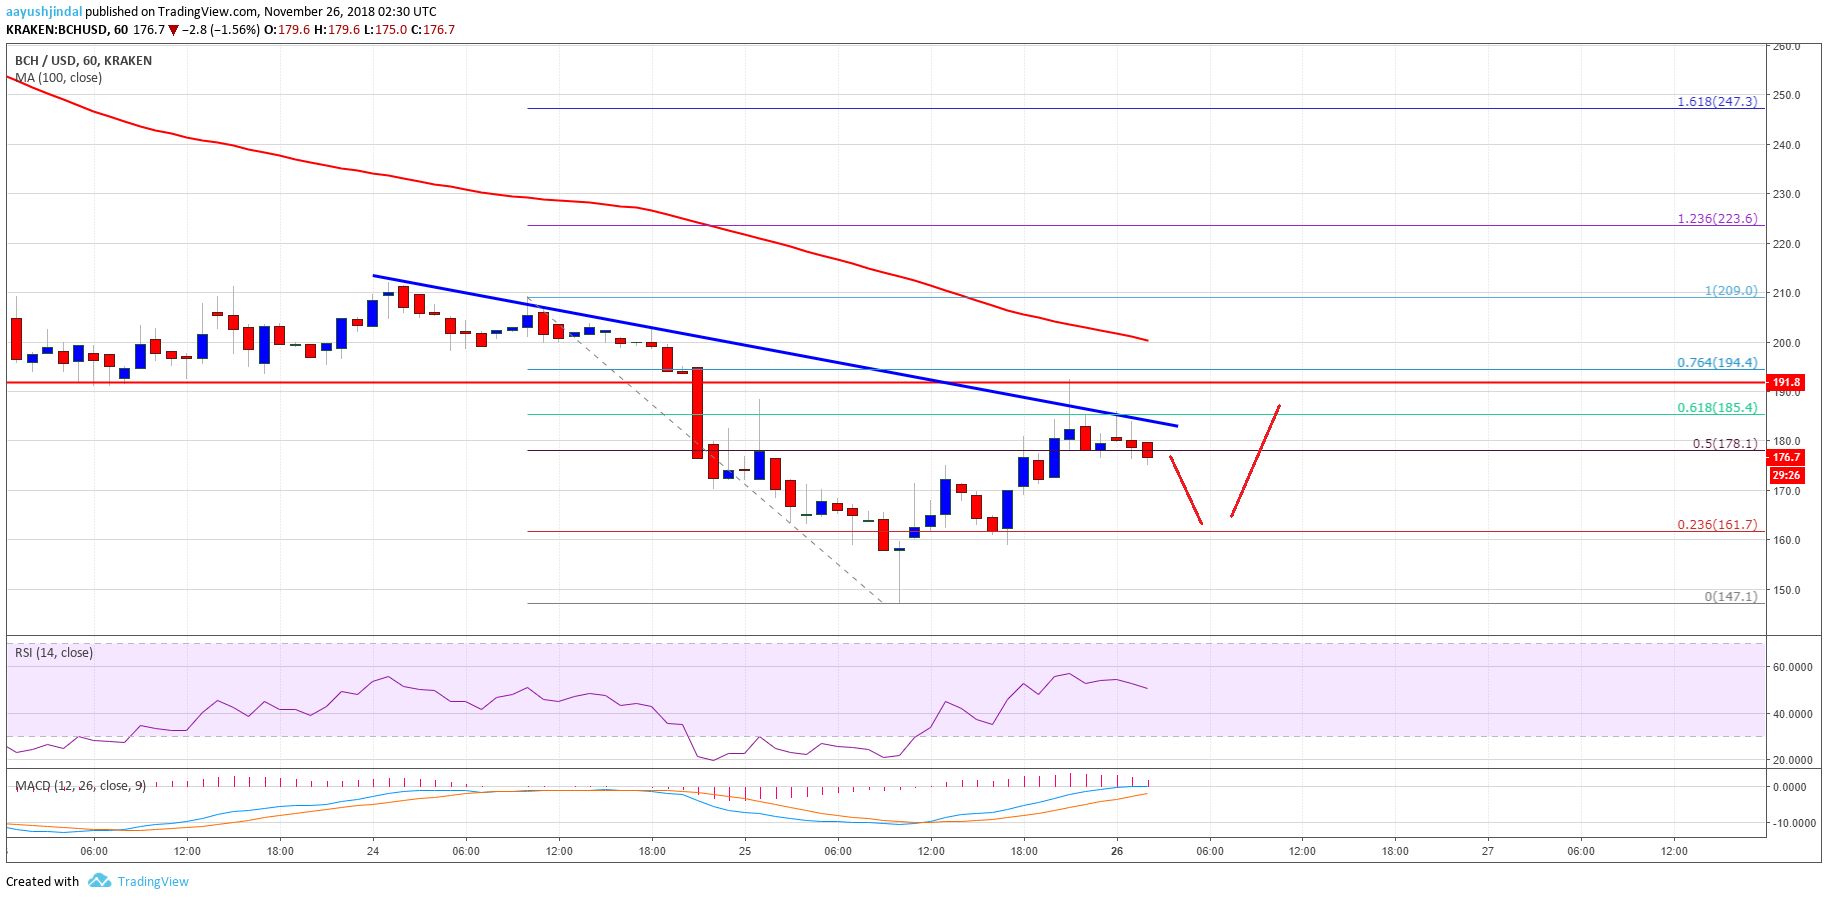
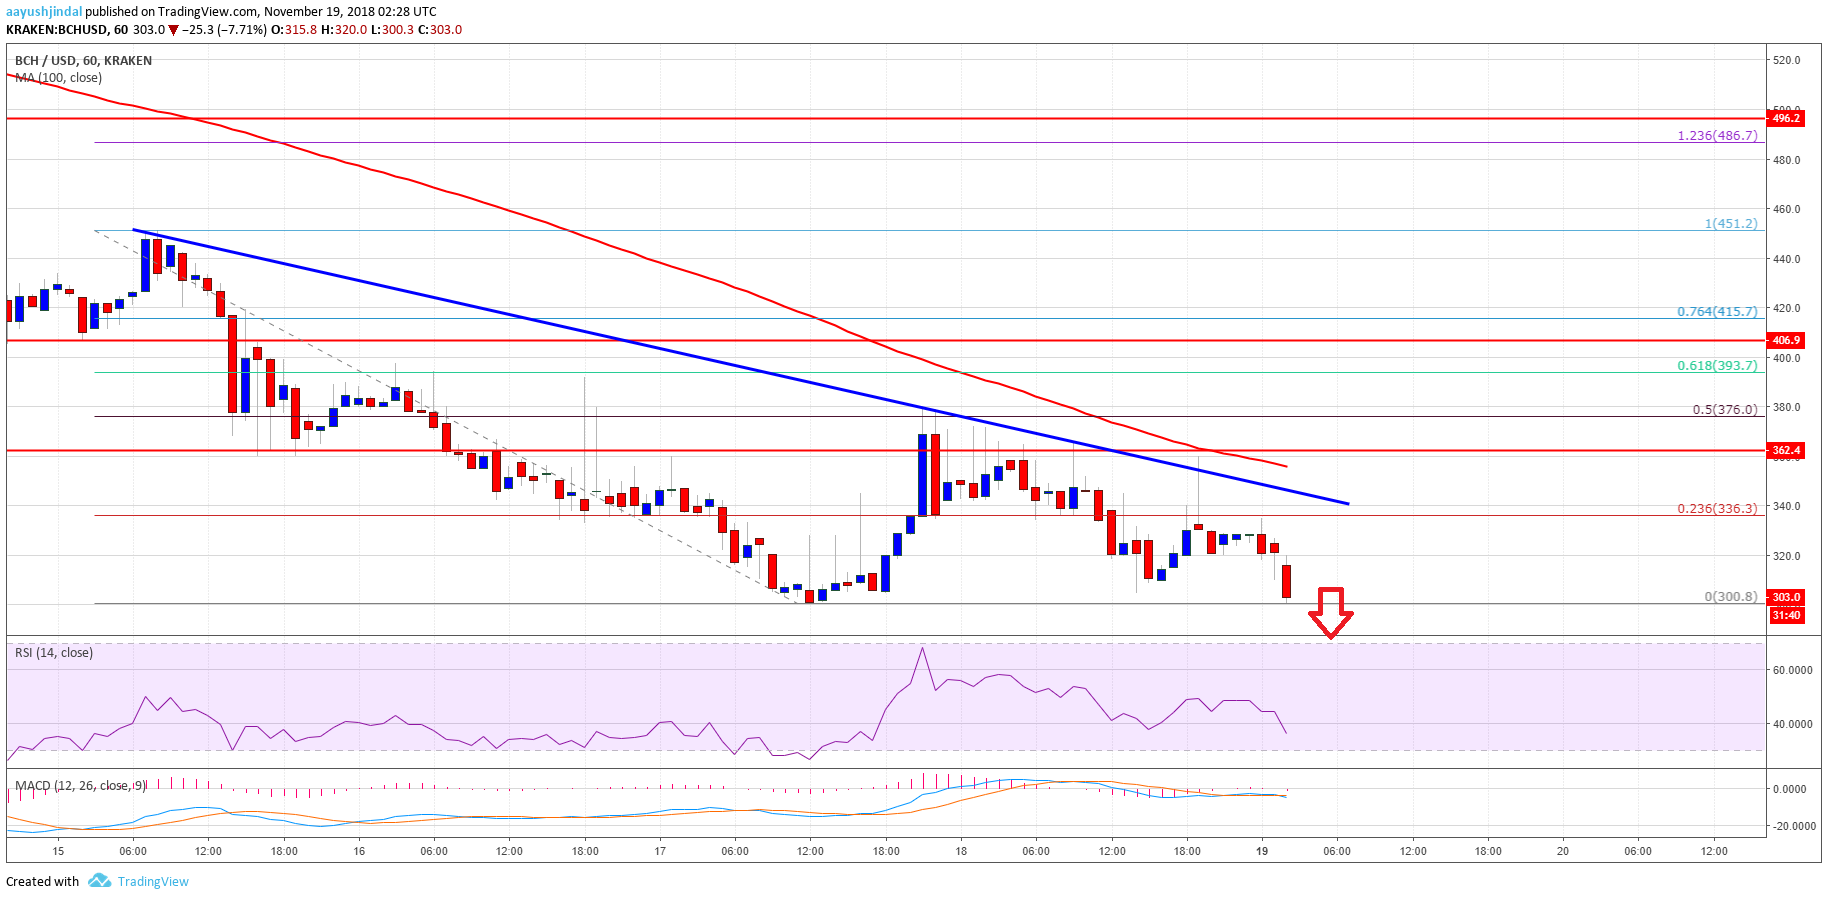
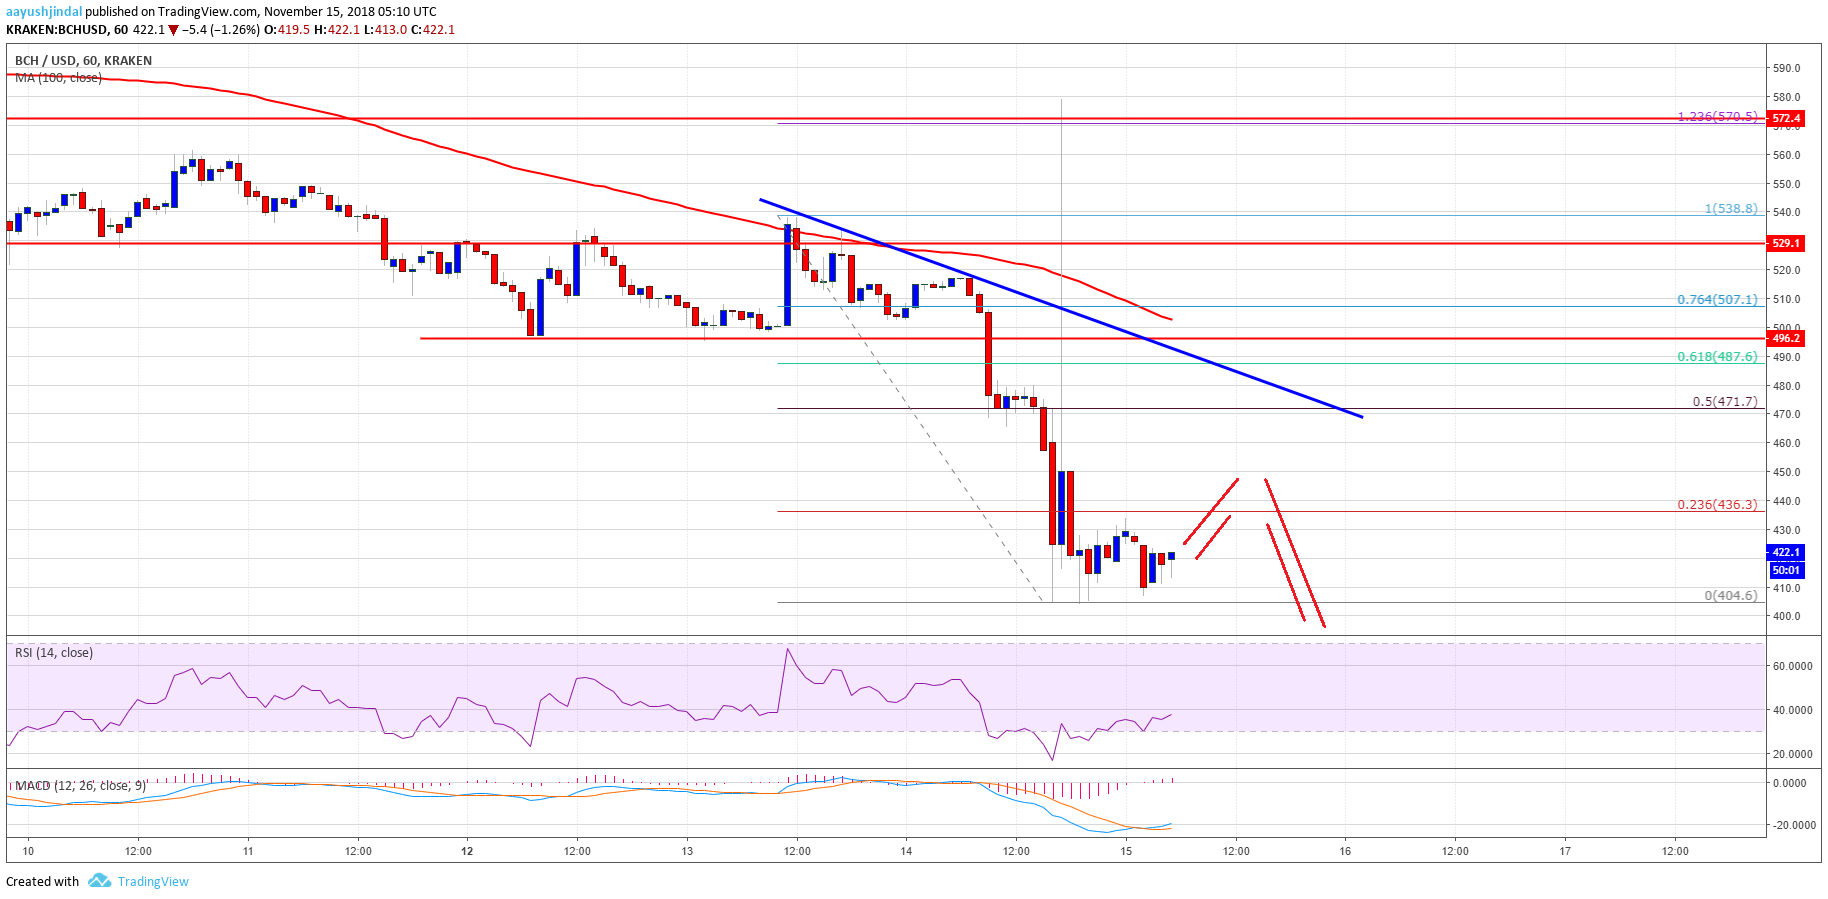
After a solid recovery above the 0 level, bitcoin cash price struggled to hold gains against the US Dollar. The BCH/USD pair started a fresh decline and traded below the 0 and 0 support levels. There was even a close below the 0 level and the 100 hourly simple moving average. The price even broke the 61.8% Fib retracement level of the last recovery from the 5 swing low to 6 high.
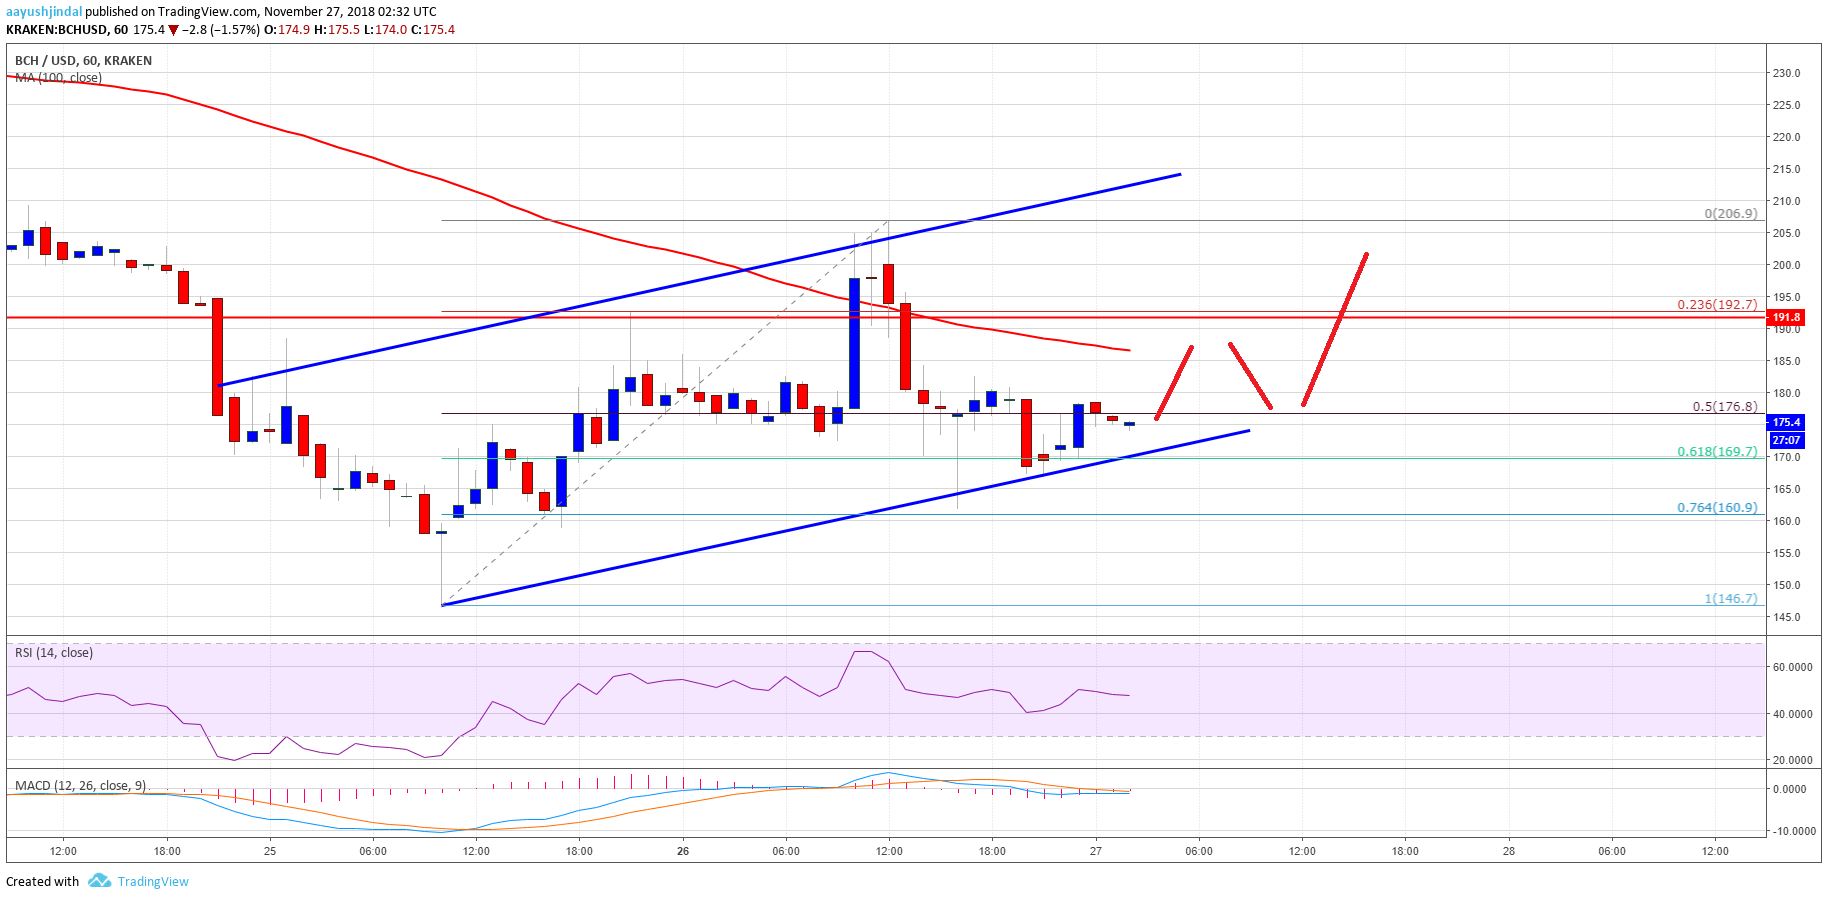
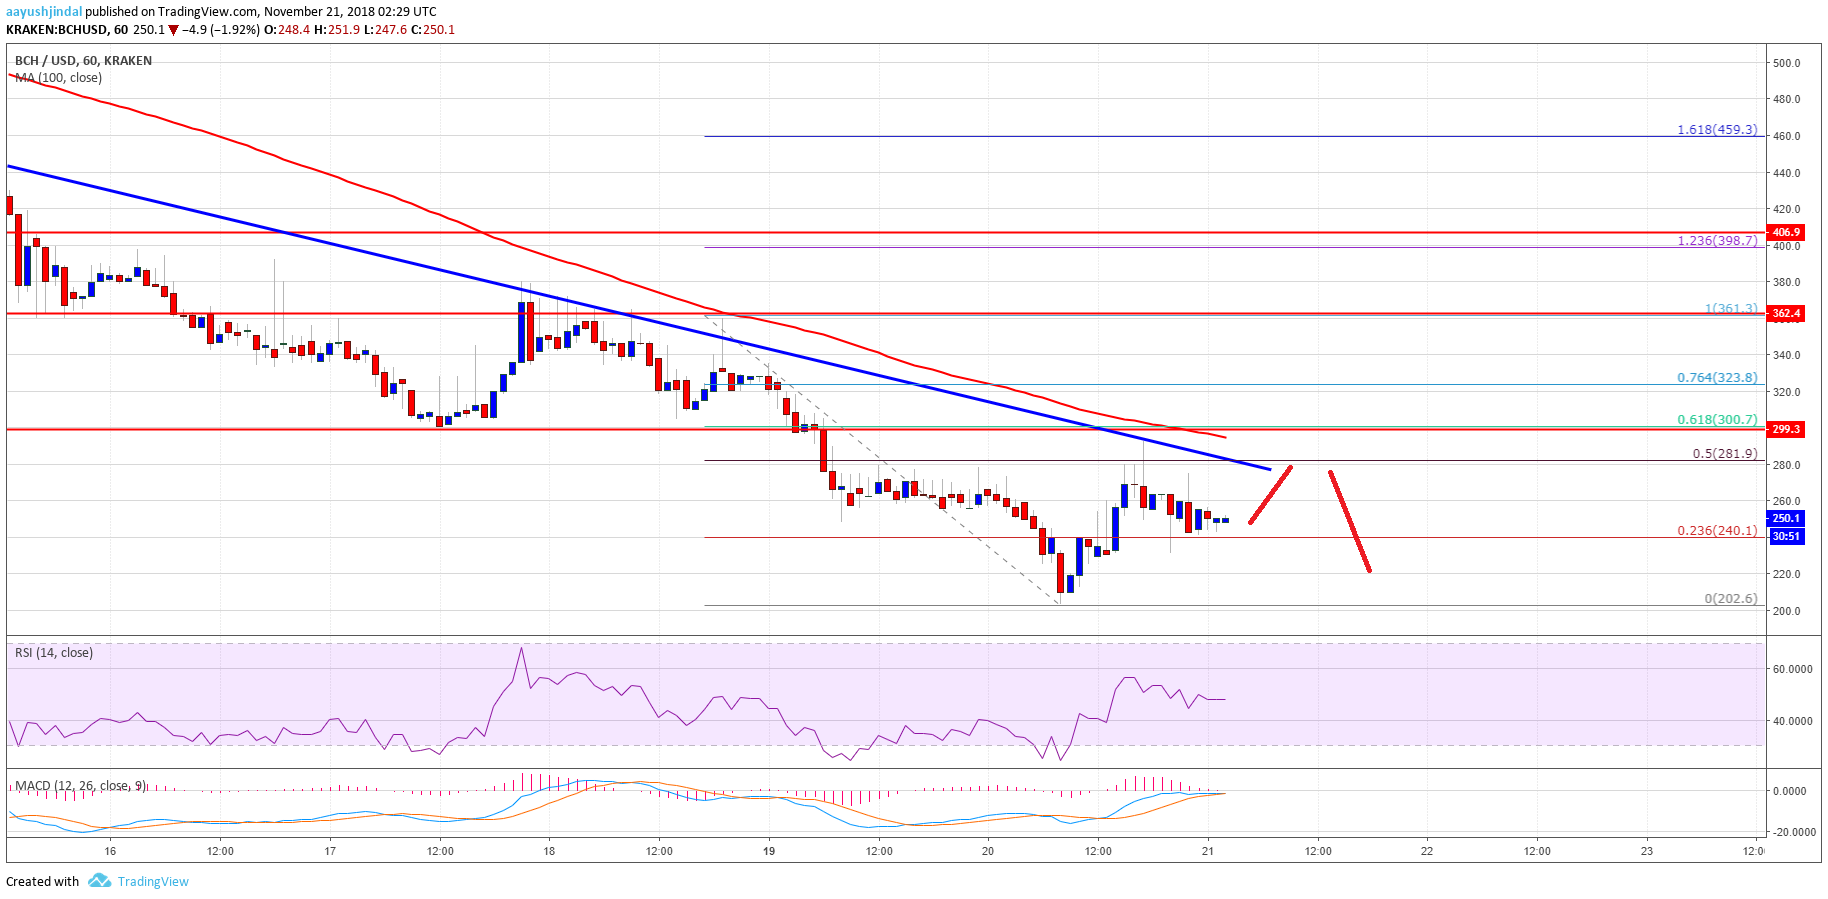
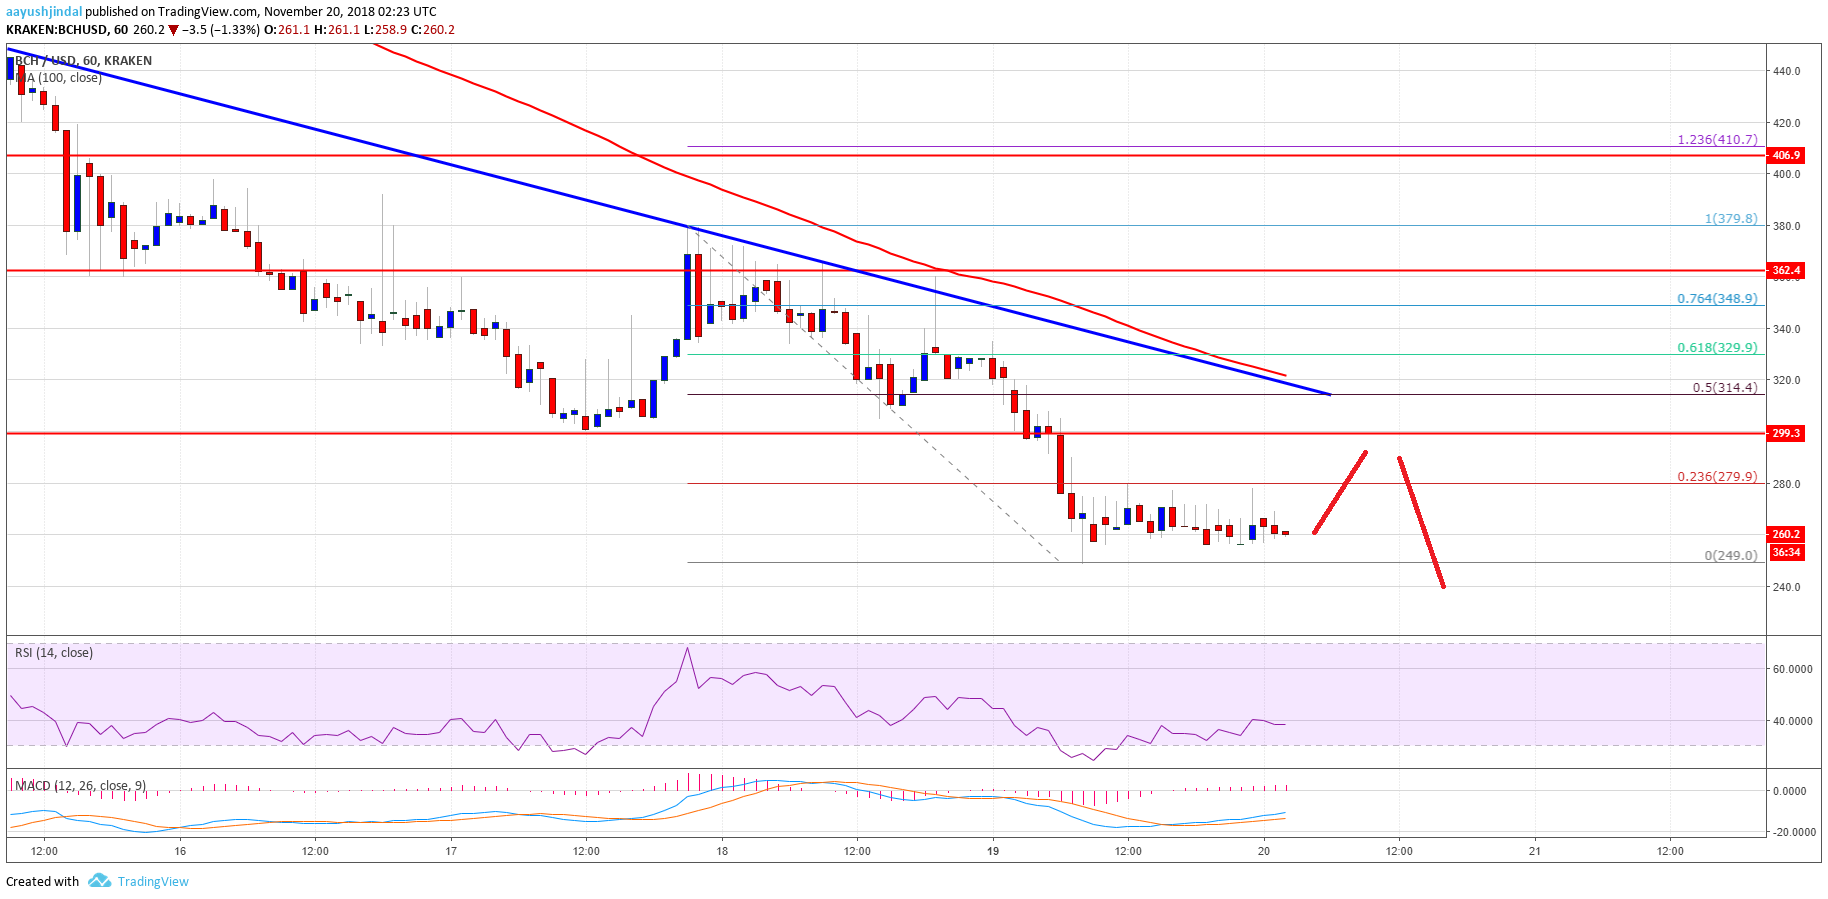
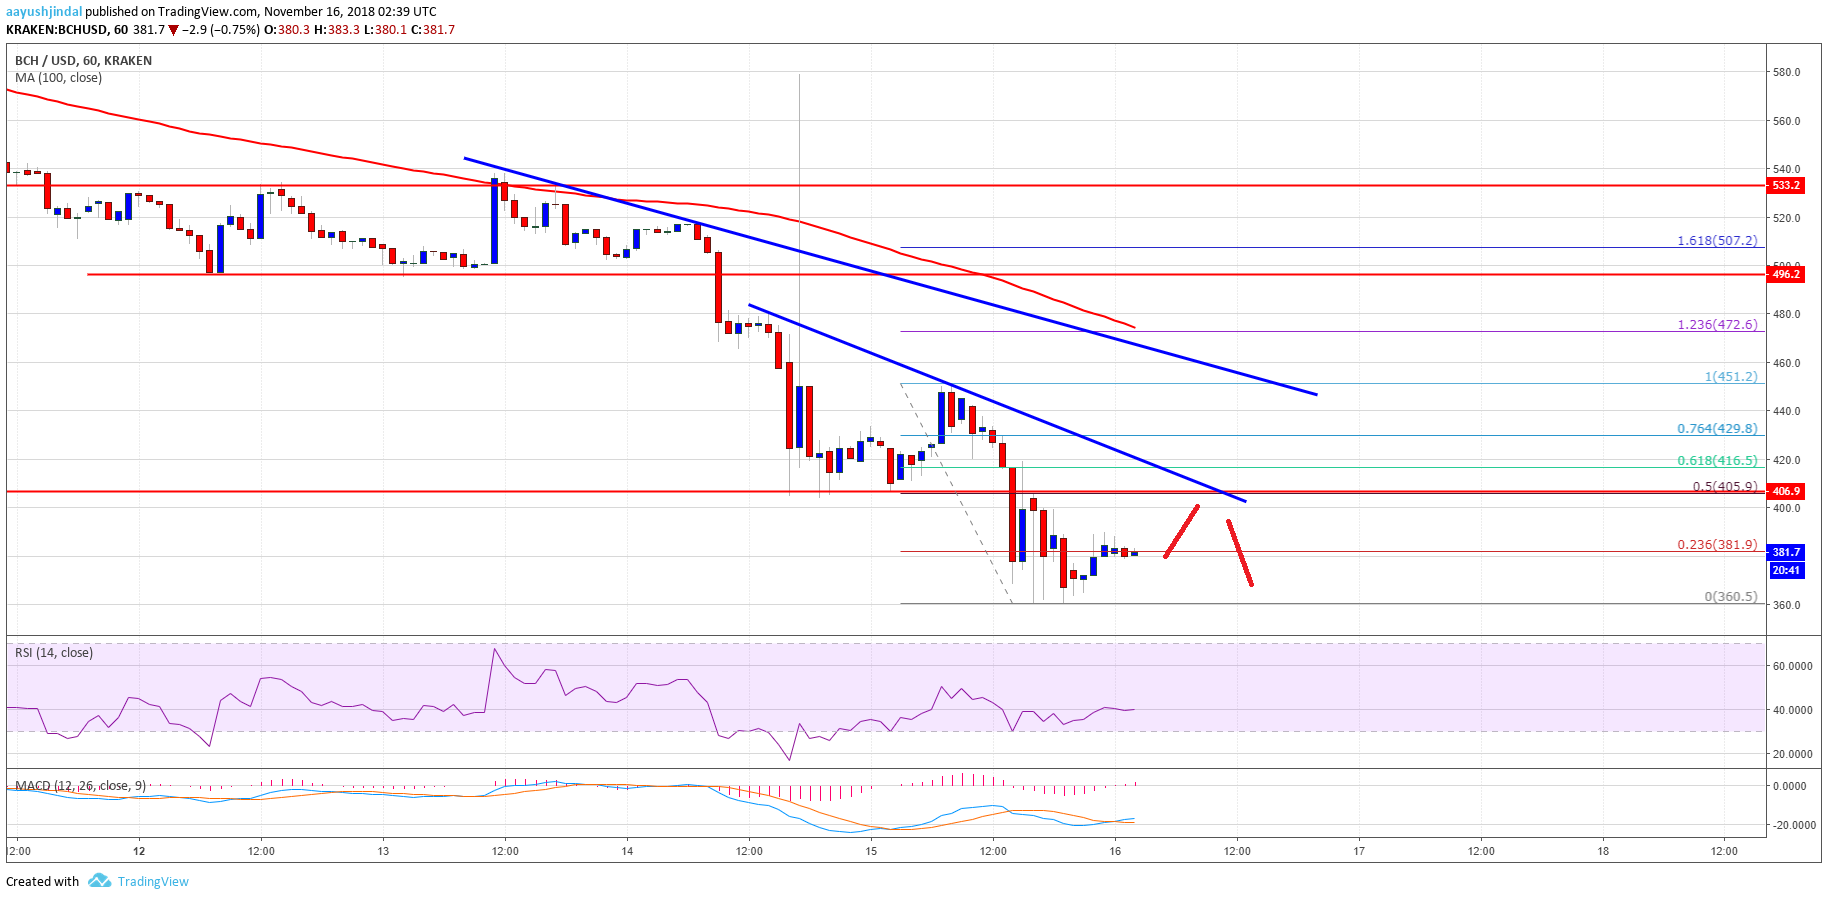
More importantly, there was a break below an ascending channel with support at 2 on the hourly chart of the BCH/USD pair. The pair tested the 0 support zone and formed a low at 1. Later, there was a minor upside correction above the 0 level. The price also moved above the 23.6% Fib retracement level of the recent decline from the 6 high to 1 low. However, there are many resistances on the upside near the 0 and 0 levels. Additionally, the 100 hourly SMA is also positioned near the 0 level.
Looking at the chart, BCH price is currently trading below the key 0 and 0 resistance levels. As long as there is no break above these resistances, the price could slide back towards 0 or 0.
Looking at the technical indicators:
Hourly MACD – The MACD for BCH/USD is slightly placed in the bullish zone.
Hourly RSI (Relative Strength Index) – The RSI for BCH/USD is placed above the 50 level.
Major Support Level – 5
Major Resistance Level – 0
The post Bitcoin Cash Price Analysis: BCH/USD Remains Sell Near 0 appeared first on NewsBTC.