Key Points
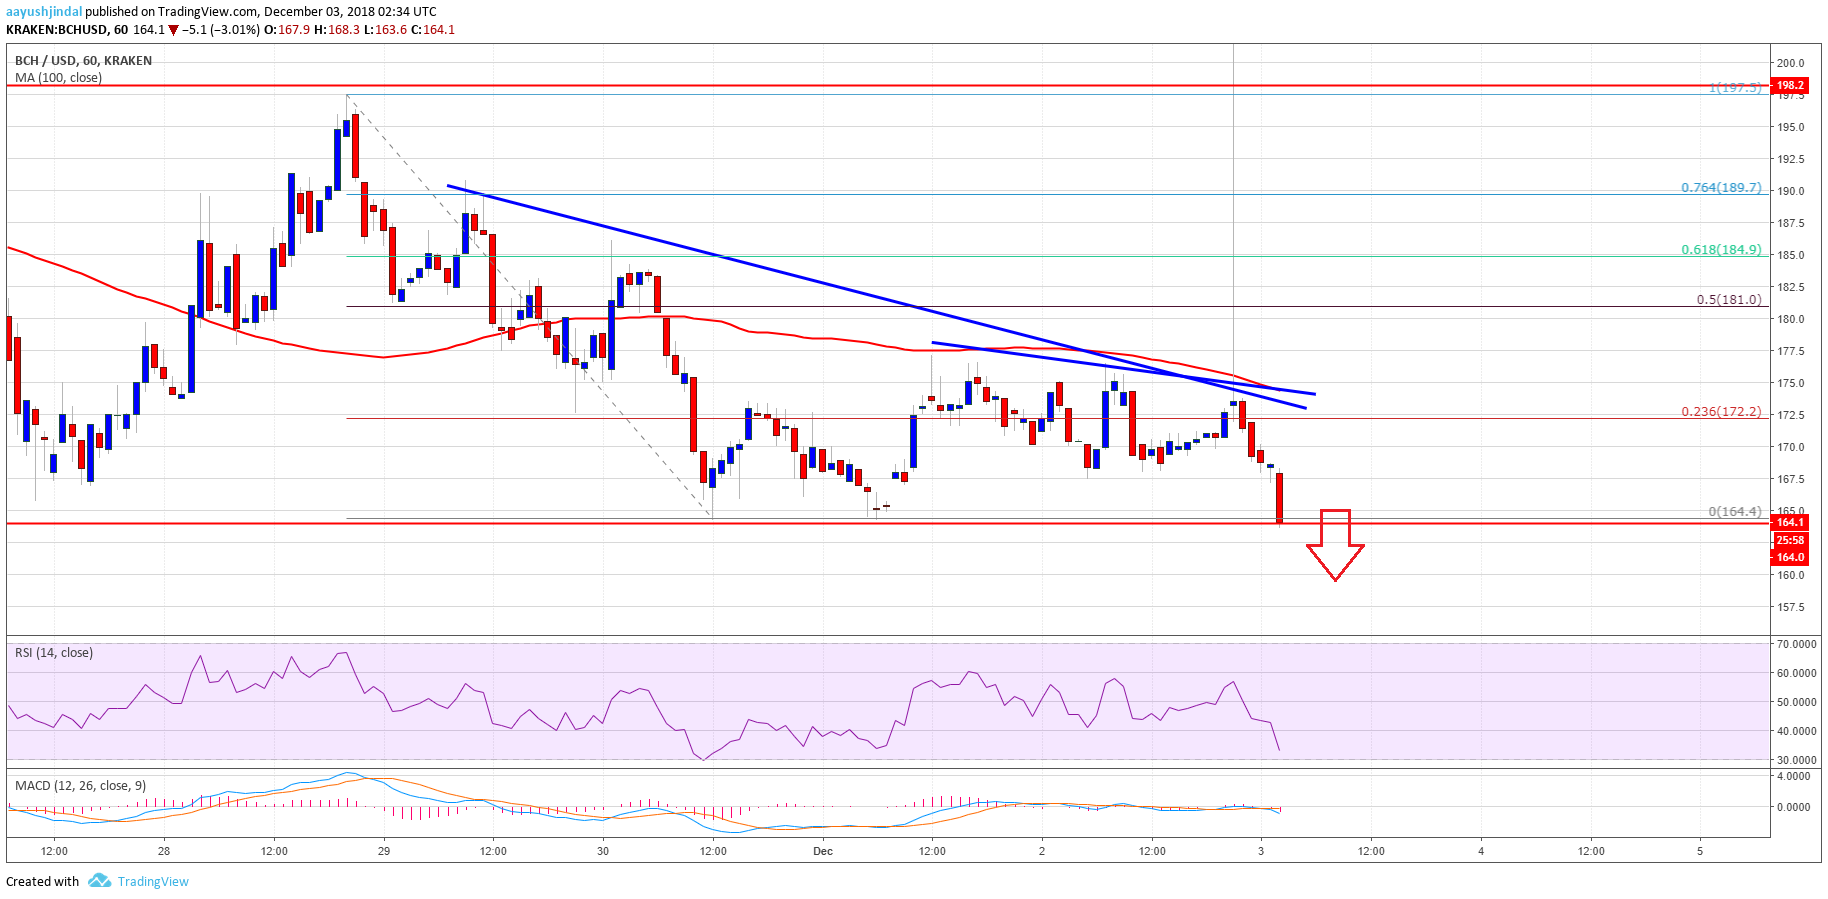
- Bitcoin cash price declined heavily and even broke the 0 support against the US Dollar.
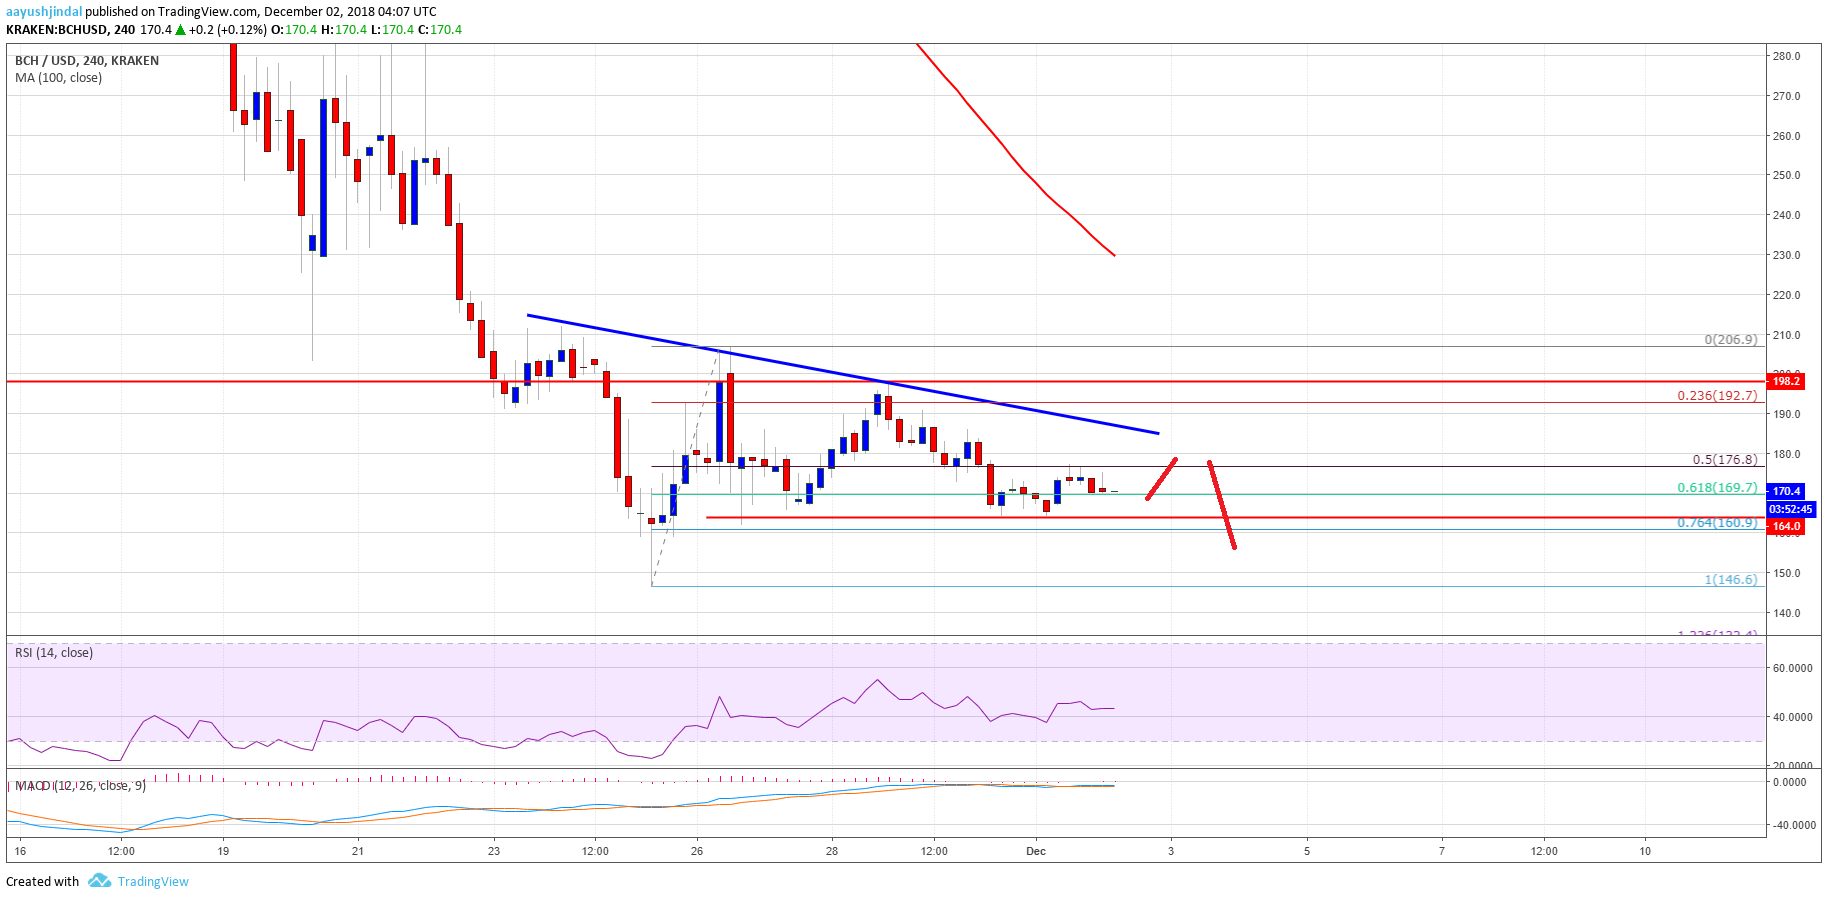
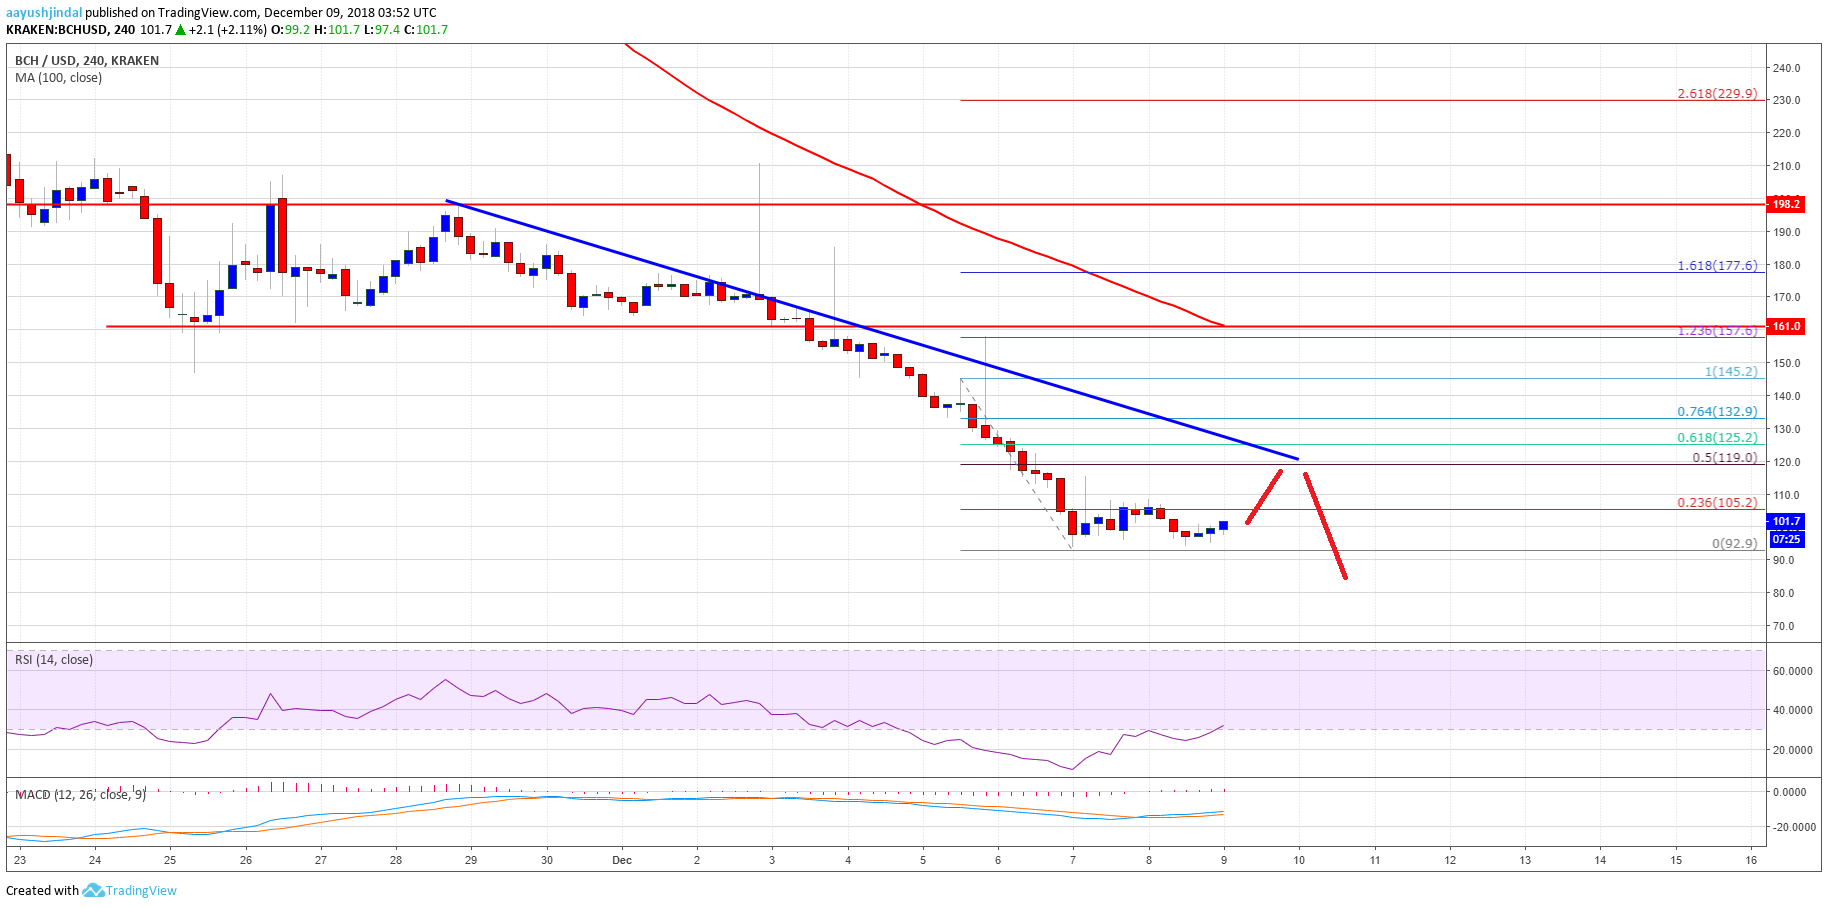
- There is a crucial bearish trend line formed with resistance at 0 on the 4-hours chart of the BCH/USD pair (data feed from Kraken).
- The pair is currently correcting higher, but it is likely to struggle near the 0 resistance.
Bitcoin cash price fell sharply below 0 and 0 against the US Dollar. BCH/USD may correct higher in the short term towards 5 or 0 resistance.
Bitcoin Cash Price Analysis
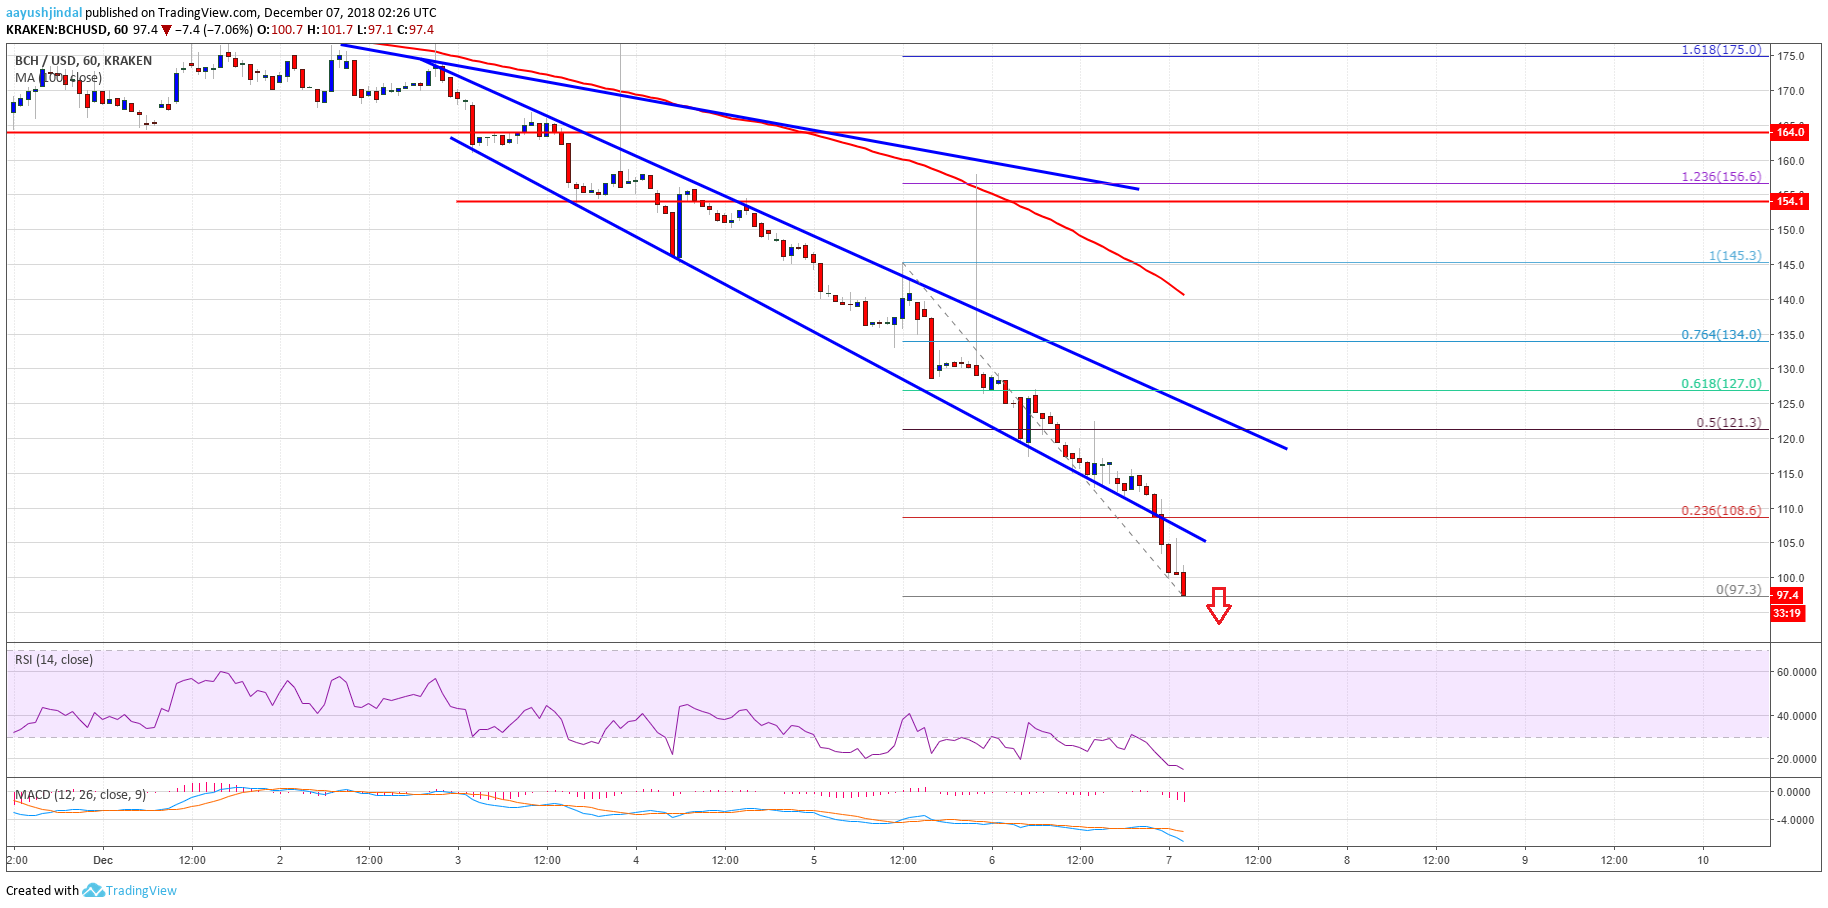
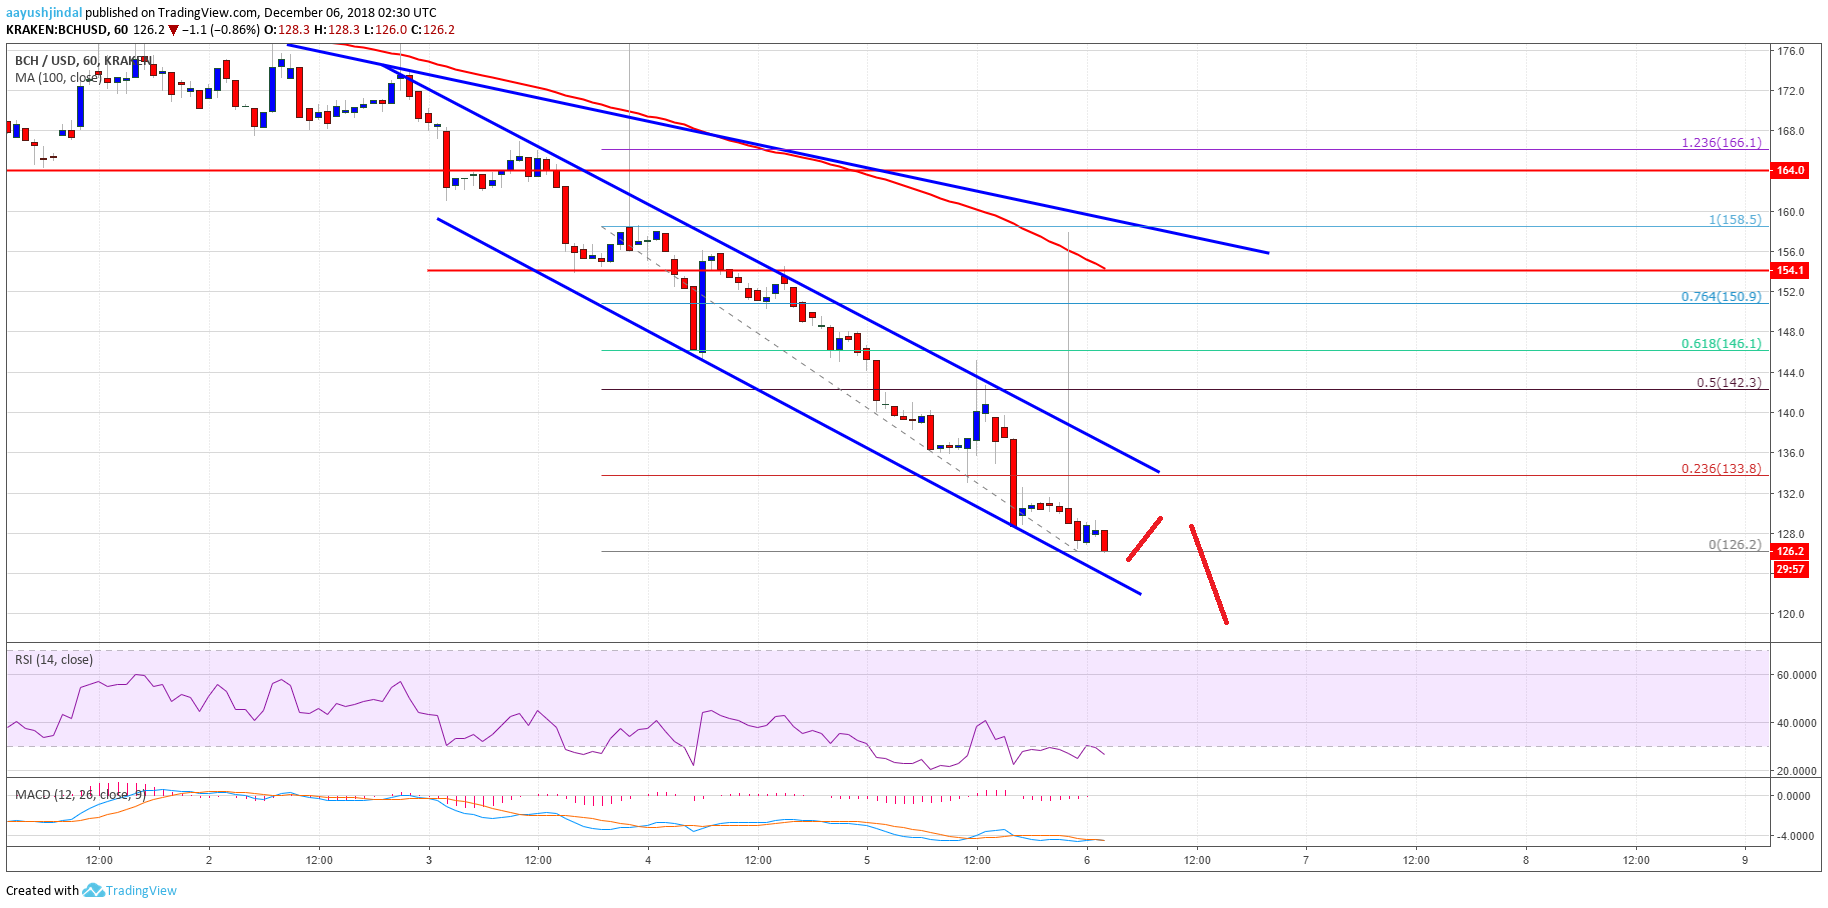
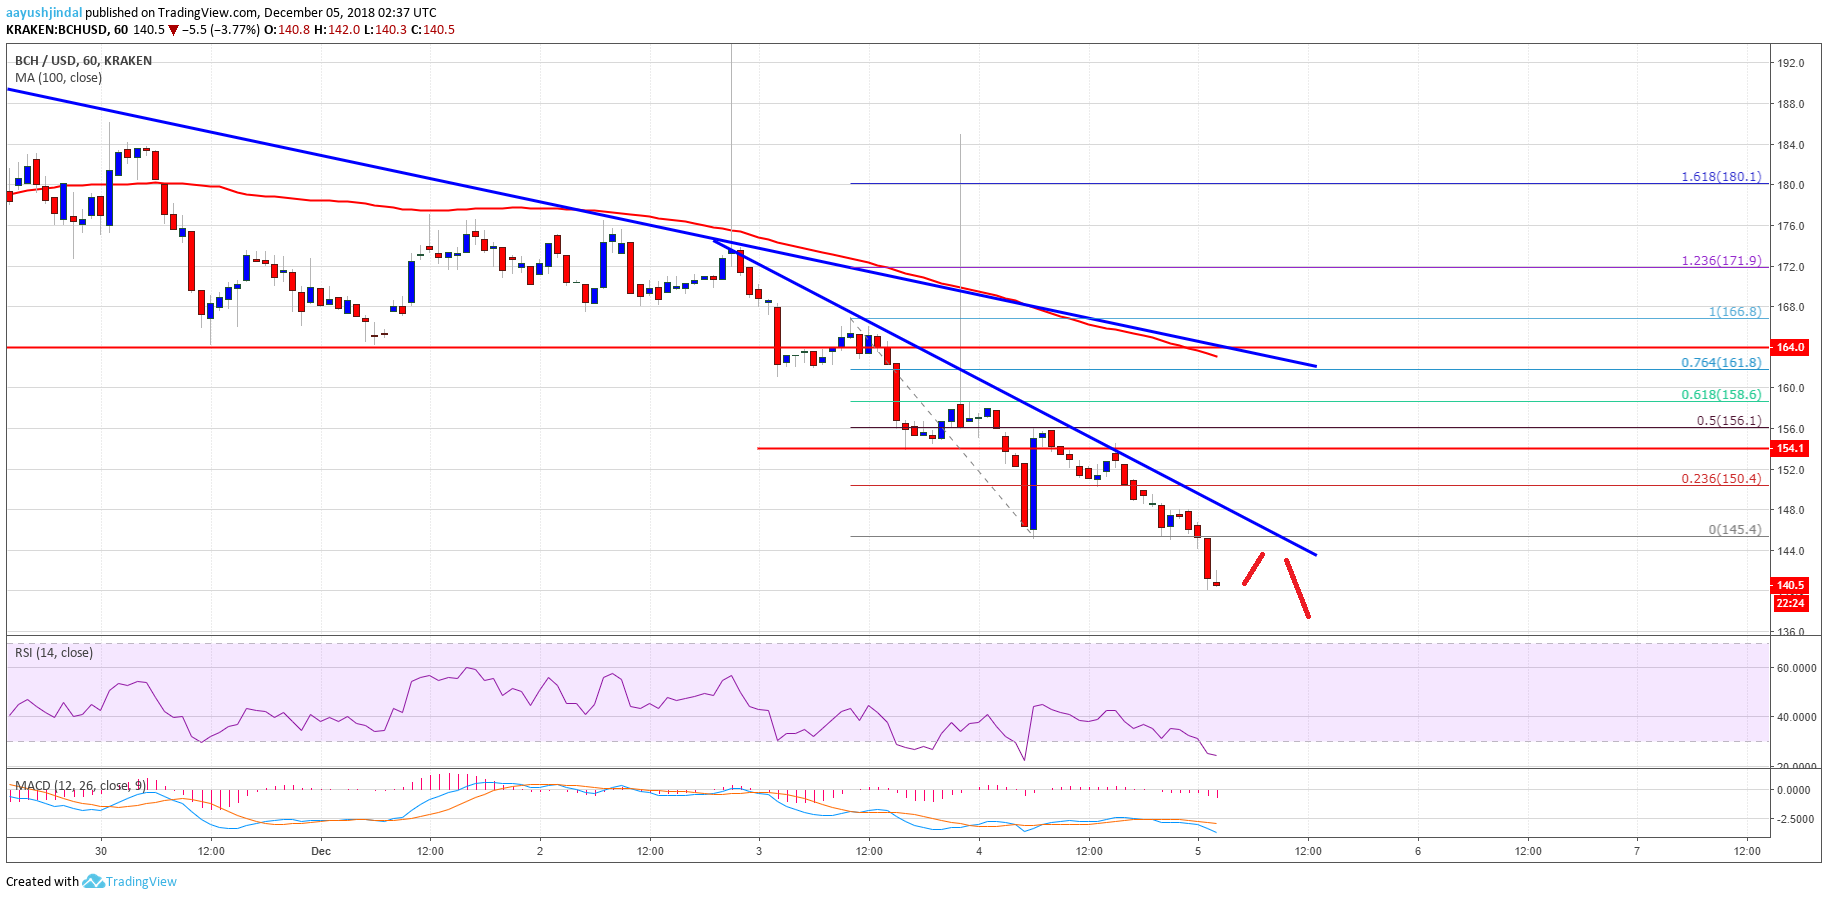
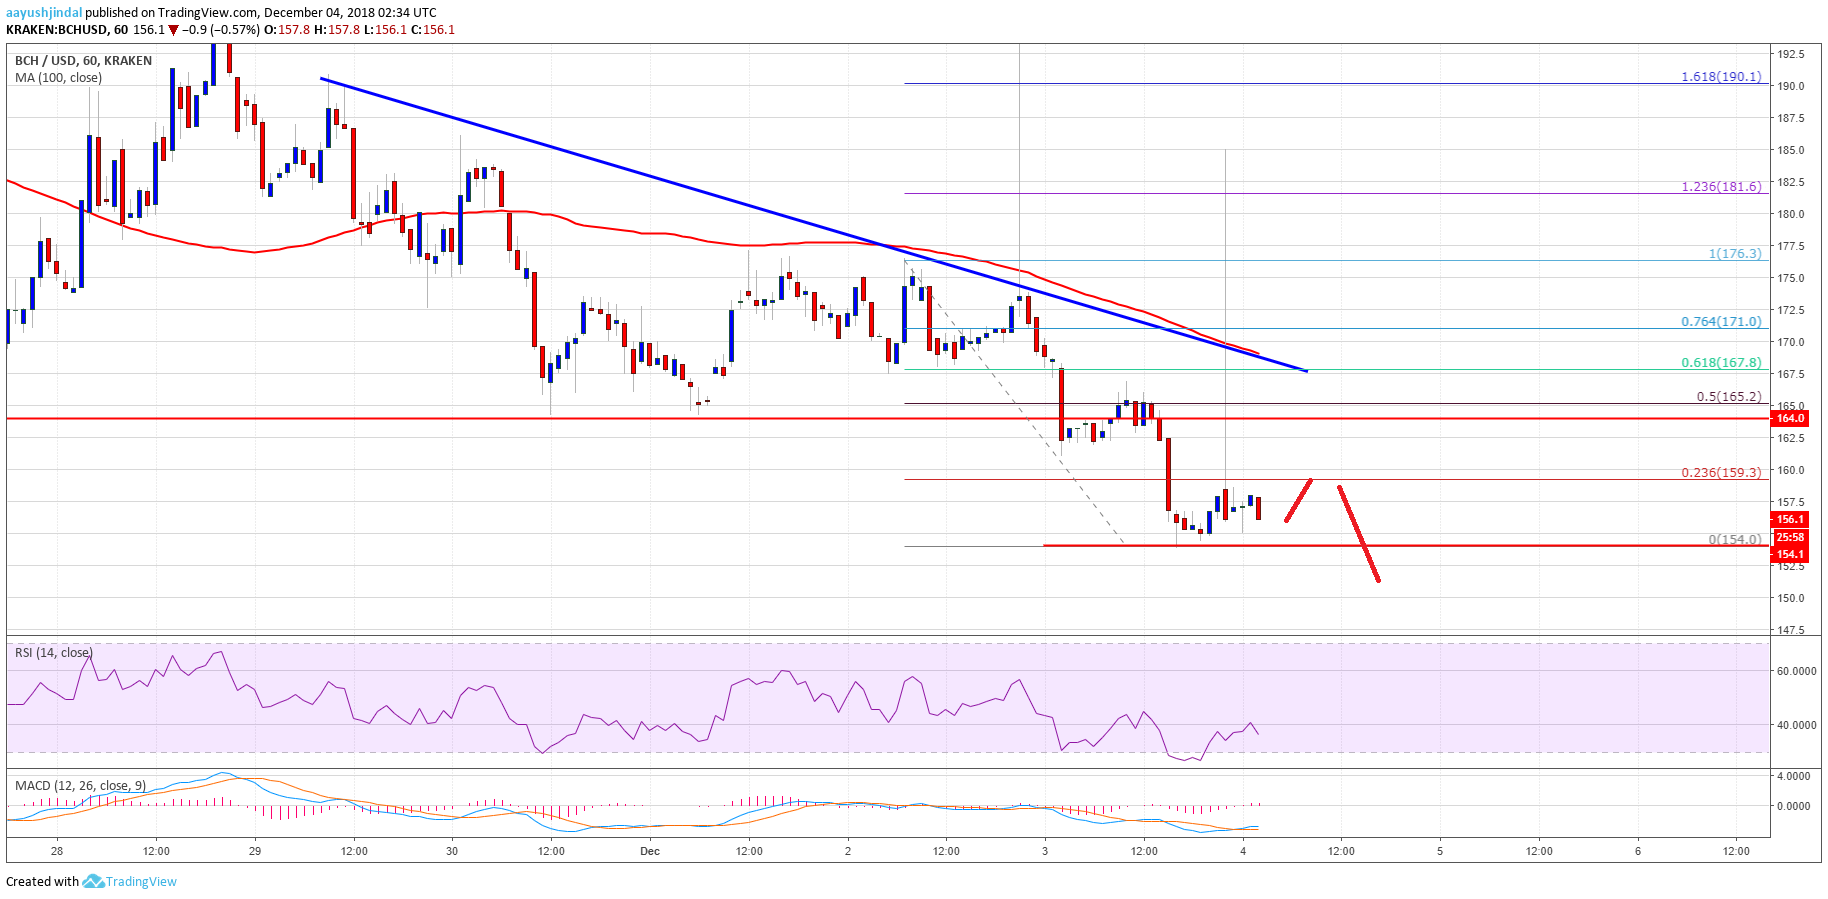
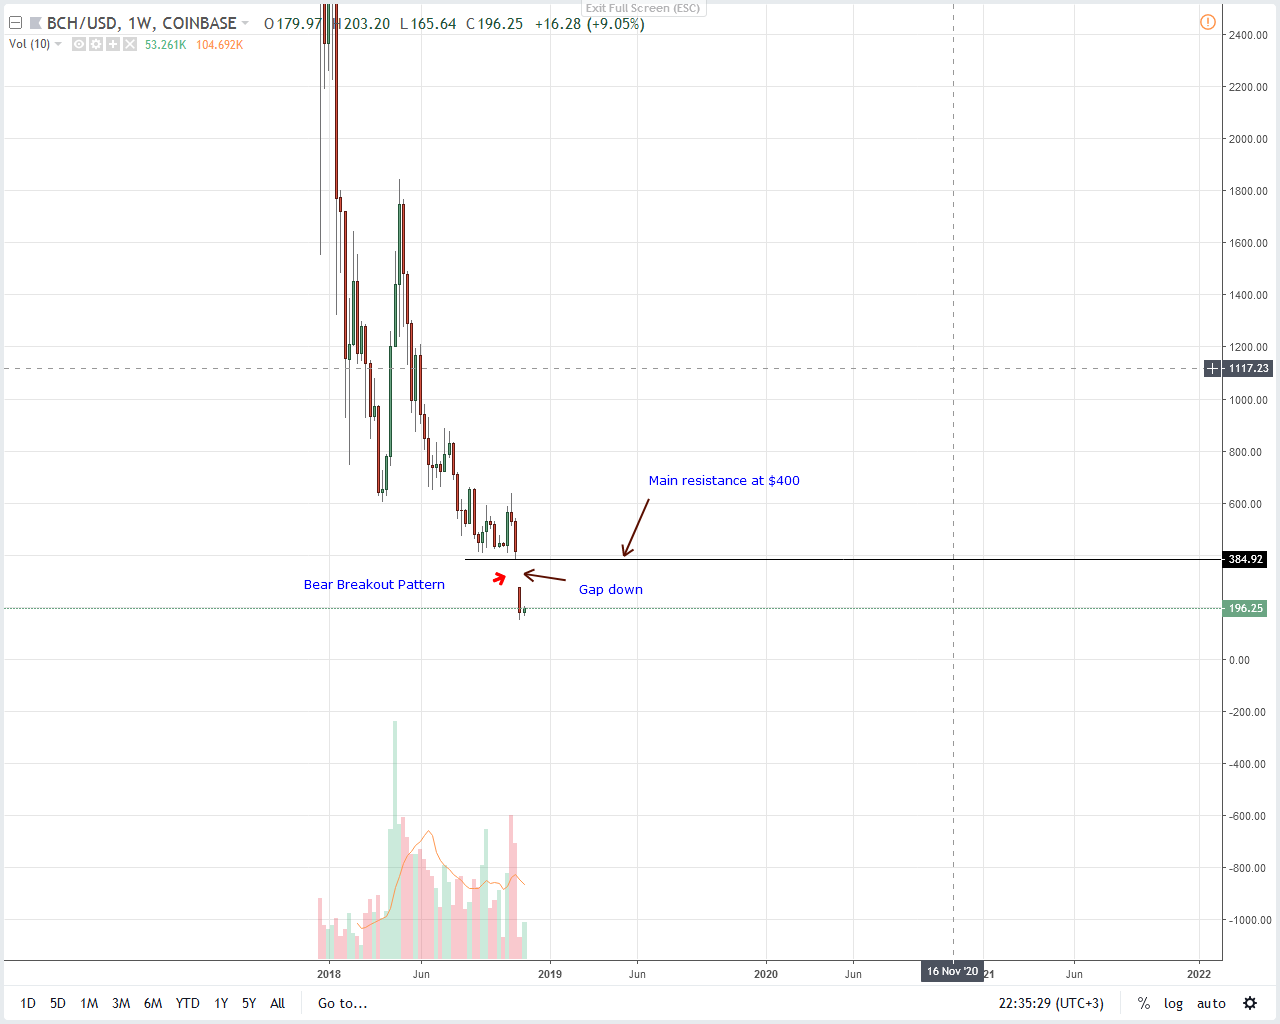
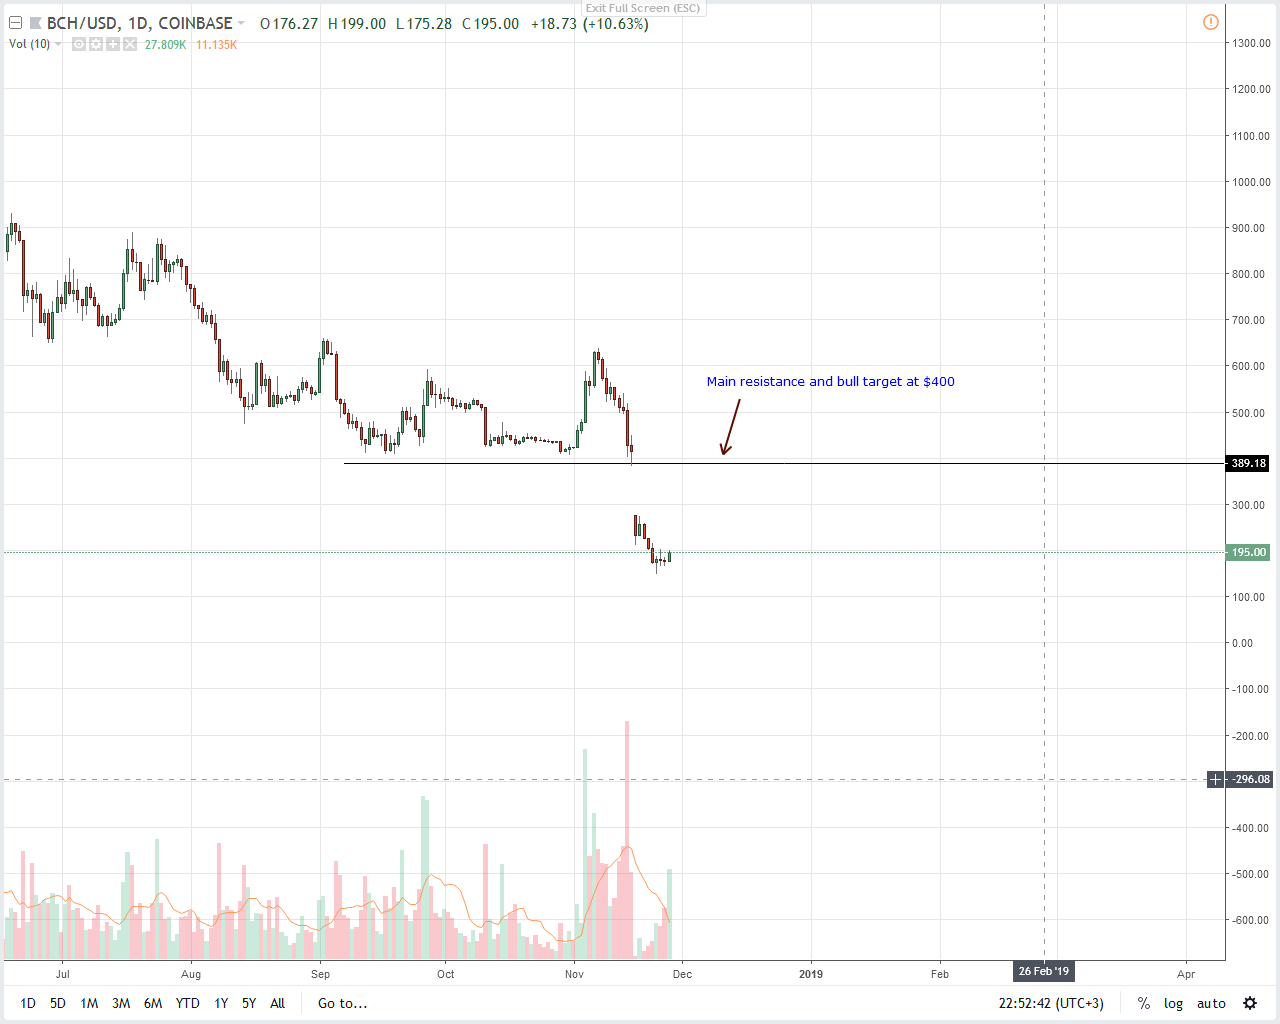
This past week, there was a major downside move below the 0 support in bitcoin cash price against the US Dollar. The BCH/USD pair declined heavily and broke the 0 and 0 support levels. The decline was such that the price even broke the 0 support and settled below the 100 simple moving average (4-hours). A new yearly low was formed at and later the price started consolidating losses.
An initial resistance is near the 5 level. It is the 23.6% Fib retracement level of the recent decline from the 5 high to low. Above 5, there is a strong resistance formed near the 5-120 zone. There is also a crucial bearish trend line formed with resistance at 0 on the 4-hours chart of the BCH/USD pair. The 50% Fib retracement level of the recent decline from the 5 high to low is also around 0. Therefore, if the price continues to move higher, it is likely to face sellers near the 5 and 0 resistance levels.
Looking at the chart, BCH price is clearly in a major downtrend below 0 and 5. If there is a fresh decline below 0, the price may even break the swing low in the near term.
Looking at the technical indicators:
4-hours MACD – The MACD for BCH/USD is slowly moving in the bullish zone.
4-hours RSI (Relative Strength Index) – The RSI for BTC/USD is currently just near the 30 level.
Major Support Level –
Major Resistance Level – 0
The post Bitcoin Cash Price Weekly Analysis: BCH/USD Could Struggle Near 0 appeared first on NewsBTC.