 Binance US responded to the court’s decision to allow the SEC lawsuit to proceed, expressing confidence in its position and criticizing the SEC’s regulatory approach. “We remain confident in our position that the SEC’s case is unsupported by the facts or the law, and that the Commission lacks the very authority it is seeking to […]
Bitcoin News
Defi Education Fund on Chevron Doctrine Overruled: ‘It Opens a New Chapter in the Battle for Clear Regulations’
 The Defi Education Fund, an organization focused on defending and bringing clarity to decentralized finance, pondered on what the recent overruling of the so-called Chevron doctrine might mean for crypto. The organization explained that this decision marks a new chapter in the battle for clearer regulations in the crypto environment, putting Congress at the forefront […]
Bitcoin News
Analysts Battle Over Cardano’s Next Move: 12,000% Rally Or 50% Crash?
Crypto analysts have given varying opinions on the Cardano (ADA) future trajectory. One analyst predicts that the crypto token could enjoy an unprecedented price rally. On the other hand, another analyst holds a bearish view and predicts that Cardano could experience a significant price crash.
Cardano To Enjoy A 12,000% Rally
In a post on Tradingview, crypto analyst Fiery Trading raised the possibility of Cardano rising to as high as and even higher. The analyst highlighted a parallel channel and noted that Cardano could reach the top of this channel in the coming bull run, which would cause the crypto token to rise to .
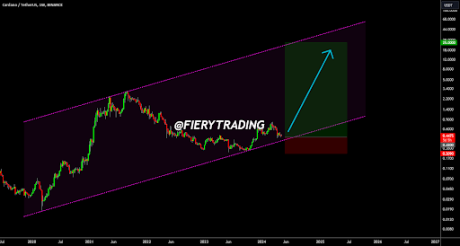
Fiery Trading admitted that Cardano rising to is not a “likely outcome” but claimed that the risk-reward ratio is worth the risk. He added that Cardano’s current price is the “entry of a lifetime” and advised crypto investors not to miss out on it.
In another post, Fiery Trading again hammered on Cardano’s current price level as an entry of a lifetime. He claimed that this entry is a “no-brainer” as long as Cardano keeps trading within that channel. Meanwhile, the crypto analyst highlighted more conservative price targets, pointing out as another price level Cardano could reach, while he mentioned as a target for “more defensive traders.”
ADA Could Drop To As Low As .24
Crypto analyst Swallow Premium gave a bearish outlook for ADA. He noted that the crypto token has finally broken the liquidity zone at around .40 and now risks dropping to as low as .24. The crypto analyst predicted that Cardano could drop to that price level within a week or two.
However, crypto analyst Sebastian suggested that Cardano might not drop below its current price range. He stated that the dump was over and that Cardano and the broader crypto market should enjoy a bounce from their current price level. He noted that the magnitude of the bounce will determine whether or not there may be more downside for ADA.
The crypto analyst further stated that the next move the market should look forward to is seeing higher lows and higher highs. He claimed that the next target for Cardano is .40 and that the crypto token needs to rise above it and stay there.
Crypto analyst Trend Rider also noted that there are “quite a few bounce signals” on Cardano’s daily chart. He stated that Bitcoin needs to stop bleeding for ADA to recover. Bitcoin’s recent drop below ,000 contributed to the significant declines that altcoins like Cardano experienced.
At the time of writing, Cardano is trading at around .38, up almost 4% in the last 24 hours according to data from CoinMarketCap.
Litecoin In Uphill Battle: Strong Resistance Might Block Recovery
On-chain data suggests Litecoin potentially has a major amount of resistance waiting just ahead, making a recovery more difficult for LTC’s price.
Litecoin Has A Large Supply Wall Waiting At Levels Just Ahead
As pointed out by X user Trader Kamikaze using data from the market intelligence platform IntoTheBlock, a large amount of LTC investors bought at levels that are coming ahead.
Below is the IntoTheBlock chart that shows the distribution of LTC addresses based on the price at which they last bought their coins on the network.
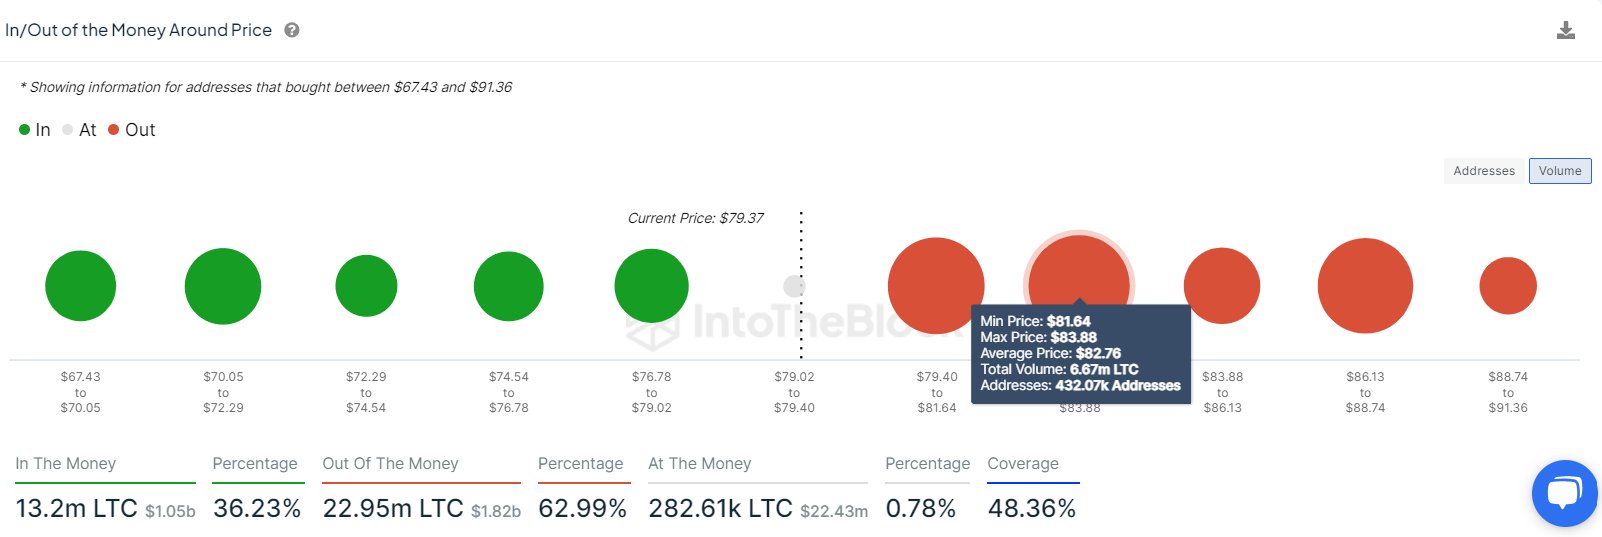
Here, the size of the dot correlates to the amount of cryptocurrency acquired in the corresponding price range. As is clearly visible, the .64 to .88 range has a large dot associated with it, meaning that a large number of tokens were bought while the asset traded within it.
More specifically, 432,070 addresses bought around 6.67 million LTC inside this range. This amount is worth north of 4 million at the current exchange rate.
Now, what relevance could this have for Litecoin? In on-chain analysis, the strength of any level as support or resistance comes down to how many coins were acquired at said level. As such, this thick LTC range with investors could potentially influence the cryptocurrency upon a retest.
The reason behind this theory is that the cost basis is an important level for any holder, so they may be more prone to show some reaction when a retest of it takes place. The larger the number of investors who share their cost basis inside a narrow range, the stronger this reaction would be.
What kind of reaction a retest would produce depends on whether it’s happening from above or below. Investors in losses just before the retest (that is, it’s taking place from below) might tend towards selling, as they could fear the price would go down again shortly. Exiting at the break-even mark would mean at least they can avoid realizing any losses.
On the other hand, holders in the green leading up to the retest could decide to take a further gamble, believing that the price would go up again.
Therefore, levels below the current price can be points of support, while those above resistance. As Litecoin has a notable supply wall at levels just ahead of the current one, it’s possible that a retest of it could produce a selling reaction.
It now remains to be seen if this thick range would impede LTC’s recovery, should the cryptocurrency rise to retest it.
LTC Price
Litecoin is currently situated just below the supply above wall, as its price is trading around .
SEC Closing Salt Lake Regional Office After Failed Legal Battle Against Crypto Firm
 The U.S. Securities and Exchange Commission (SEC) has announced the closure of its Salt Lake Regional Office (SLRO) due to attrition and a focus on organizational efficiency. This move will reduce the number of SEC regional offices from 11 to 10. The jurisdiction for Utah, previously held by SLRO, will now be managed by the […]
Bitcoin News
Ethereum Faces an Uphill Battle: Can It Overcome the Challenges?
Ethereum price extended its decline and tested the ,720 support. ETH is now consolidating and facing many hurdles near the ,800 level.
- Ethereum extended its decline and tested the ,720 zone.
- The price is trading below ,820 and the 100-hourly Simple Moving Average.
- There is a new bearish trend line forming with resistance at ,810 on the hourly chart of ETH/USD (data feed via Kraken).
- The pair could continue to move down if it breaks the ,720 support.
Ethereum Price Holds Support
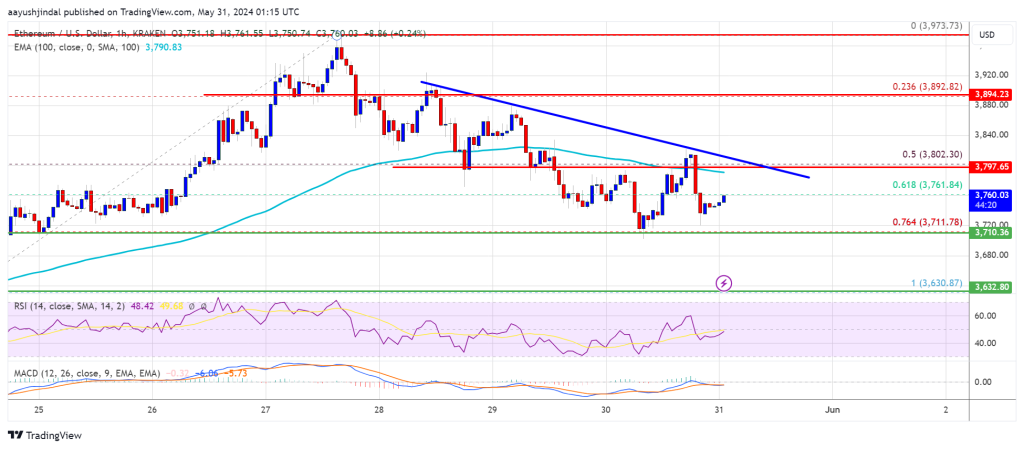
Ethereum price remained in a short-term bearish zone and declined below the ,800 support zone, like Bitcoin. ETH even traded below the 50% Fib retracement level of the upward move from the ,631 swing low to the ,975 high.
However, the bulls were active near the ,720 support zone. They protected the 76.4% Fib retracement level of the upward move from the ,631 swing low to the ,975 high.
Ethereum price is now trading below ,800 and the 100-hourly Simple Moving Average. If there is a fresh increase, ETH might face resistance near the ,800 level. There is also a new bearish trend line forming with resistance at ,810 on the hourly chart of ETH/USD.
The first major resistance is near the ,850 level. An upside break above the ,850 resistance might send the price higher. The next key resistance sits at ,890, above which the price might gain traction and rise toward the ,950 level.
If the bulls push Ether above the ,950 level, the price might rise and test the ,000 resistance. Any more gains could send Ether toward the ,080 resistance zone.
More Losses In ETH?
If Ethereum fails to clear the ,800 resistance, it could continue to move down. Initial support on the downside is near the ,720 level.
The next major support is near the ,640 zone. A clear move below the ,640 support might push the price toward ,550. Any more losses might send the price toward the ,500 level in the near term.
Technical Indicators
Hourly MACD – The MACD for ETH/USD is losing momentum in the bearish zone.
Hourly RSI – The RSI for ETH/USD is now below the 50 zone.
Major Support Level – ,720
Major Resistance Level – ,800
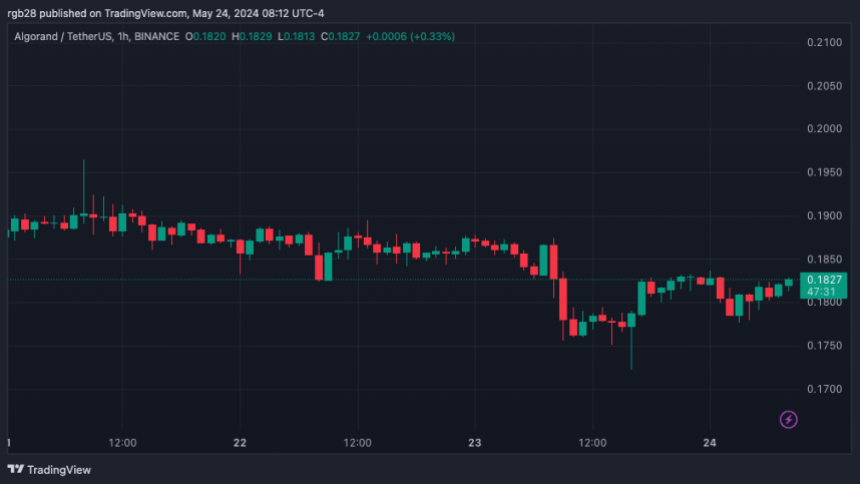
Battle Of Networks? Algorand Pokes Fun At Bitcoin, Ethereum, And Solana In New Ad
Algorand Foundation’s new ad criticized Bitcoin, Ethereum, and Solana for their efficiency. The ad received mixed reactions from the crypto community and sparked a conversation about the art of advertising crypto products.
Algorand, The Only One “Delivering”
Algorand’s latest ad has sparked controversy for “dissing” three networks. Titled “When Blockchain Meets The Real World, Only One Can Deliver,” the ad features a classic grocery store checkout line format.
The video shows three customers trying to pay for groceries with crypto: Bitcoin, Ethereum, and Solana. During the ad, the three shoppers have problems with their respective transactions, seemingly suggesting that the rival networks are unsuitable for everyday use.
The customer using Bitcoin had to wait 27 minutes for the transaction to be completed; the one paying with Ethereum was told the transaction fees were 2, and the Solana payer had his transactions repeatedly failing. All three issues in the ad are common criticisms that the three targeted networks receive.
The commercial then shows the next checkout line, with buyers using Algorand as a payment method. As this line moves quickly, the video displays text stating “Instant Finality. Low Fees. Designed for the speed of life.”
The ad finished with the cashier saying, “Should have shopped with Algorand,” and Anthony Scaramucci, investment guru and founder of SkyBridge, asking how to get in the fast-moving line.
The Crypto Ads Conundrum
The video received mixed reviews from the crypto community. Many applauded the ad, stating that Algorand is the future of Layer-1 and payments. One X user said:
I can’t stress enough how much the Algorand Foundation does compared to others. All the meetings, tweets, events, etc…this isn’t happening on other chains!
However, the negative responses didn’t take long to follow. Several community members considered the jab at other chains an unnecessary and “embarrassing” attack. A user jokingly claimed that Algorand achieved an “impossible goal” with the ad: “uniting all the factions of crypto to dunk on you.”
Crypto commentator Zach Rynes considers that this type of marketing doesn’t make sense as he is unsure who it appeals to. In an X post, Rynes explained that the ad would leave the wrong impression on non-crypto people.
To him, the video will make the public think that “crypto sucks,” not knowing that the ad is for crypto. The commentator believes it’s a “lose-lose either way” since “Crypto-native people will see this as unnecessarily combative.”
Similarly, Mert, CEO of Helius Labs, brought up a point repeated by several community members. Mert criticized Algorand for spending money on an ad when its “top two explorers [are] going out of business due to no funding.”
Moreover, he seems to consider the jab at other networks ironic when Algorand’s got its “entire economic security flipped by two dog coins on Solana (WIF + BONK).”
Cardano Joins The Advertisement Conversation
Despite the criticism, the discussion also sparked interest in the ADA community. X account ADA Whale praised the commercial for being funny.
Another community member tagged Cardano founder Charles Hoskinson in the video, suggesting he should start looking for a marketing team to promote Cardano. The user cited the US government’s U-turn, possibly bringing regulatory clarity, as a decisive factor.
This is not the first time Cardano has received criticism over its marketing approach. In March, the conversation sparked when the “Cardano Girls” video became viral.
Content creator Lily Brodi suggested that despite having the technology aspect figured out, Cardano has an “unattractiveness problem.” This problem prevents a broader audience from entering its community and adopting the technology.
Ultimately, crypto ads remain a hot topic and a useful tool for the industry. Whether users find them “cringy” or “unnecessary” sometimes, they have the potential to help with broader adoption through educational and entertaining crypto-related content.
XRP Price Faces Uphill Battle: Struggles to Initiate Fresh Upside
XRP price is struggling to clear the .5120 resistance. The price could decline again in the near term if it stays below .5060 and .5120.
- XRP is struggling to gain pace for a move above the .5120 level.
- The price is now trading below .5050 and the 100-hourly Simple Moving Average.
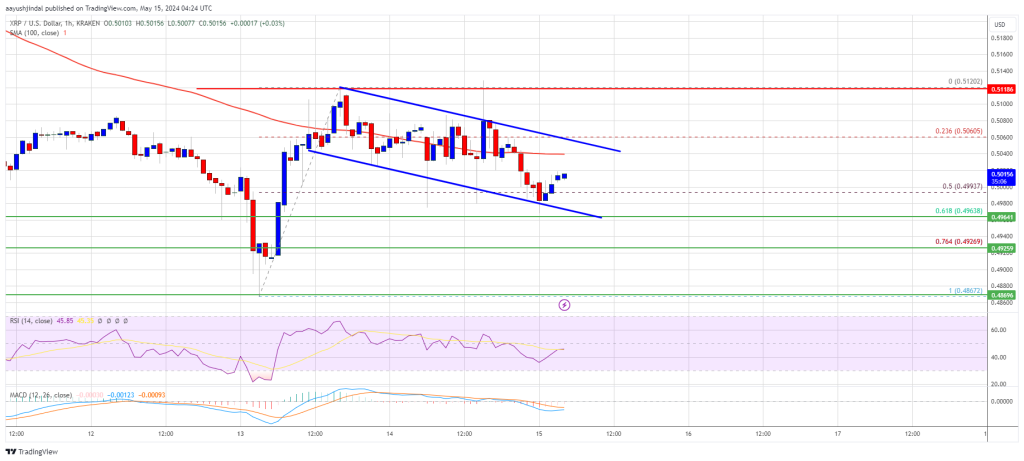
- There is a short-term declining channel forming with resistance at .5040 on the hourly chart of the XRP/USD pair (data source from Kraken).
- The pair could start a decent increase if there is a close above the .5120 resistance.
XRP Price Stuck Near .50
Yesterday, we discussed how XRP price started a recovery wave, like Bitcoin and Ethereum. There was a move above the .4950 and .50 resistance levels.
The price even moved above .5100, but the bears were active near the .5120 resistance. A high was formed at .5120 and the price is now correcting gains. There was a move below the 50% Fib retracement level of the upward move from the .4865 swing low to the .5120 high.
The price is now trading below .5050 and the 100-hourly Simple Moving Average. However, the bulls are active above the 61.8% Fib retracement level of the upward move from the .4865 swing low to the .5120 high.
Immediate resistance is near the .5040 level and the 100-hourly Simple Moving Average. There is also a short-term declining channel forming with resistance at .5040 on the hourly chart of the XRP/USD pair. The first key resistance is near .5060. A close above the .5060 resistance zone could send the price higher.
The next key resistance is near .5120. If the bulls remain in action above the .5120 resistance level, there could be a rally toward the .5250 resistance. Any more gains might send the price toward the .5350 resistance.
More Losses?
If XRP fails to clear the .5040 resistance zone, it could continue to move down. Initial support on the downside is near the .4965 level. The next major support is at .4925.
If there is a downside break and a close below the .4925 level, the price might accelerate lower. In the stated case, the price could even drop below the .4865 support zone.
Technical Indicators
Hourly MACD – The MACD for XRP/USD is now losing pace in the bearish zone.
Hourly RSI (Relative Strength Index) – The RSI for XRP/USD is now below the 50 level.
Major Support Levels – .4965 and .4925.
Major Resistance Levels – .5040 and .5120.
Bitcoin Price Linked To Binance Vs Coinbase Battle, Quant Reveals
A quant has explained how there appears to be a relationship between Coinbase’s spot volume dominance vs. Binance’s and the Bitcoin price.
Bitcoin Has Been Reacting To Binance/Coinbase Volume Changes
In a CryptoQuant Quicktake post, an analyst discussed the dynamics in the cryptocurrency market that arise out of the battle happening between Binance and Coinbase for spot volume dominance.
The quant shared a chart below that shows how this war for dominance has played out over the past decade.

As the graph shows, Binance has been the much more dominant of the two platforms when considering the spot volume. The exchange is hosting five times as much volume as Coinbase.
The analyst notes that the difference between the two would be even higher when considering the BTC-FDUSD pair, which isn’t included in the data depicted in the above chart.
Despite the much lower spot volume, Coinbase still hasn’t been irrelevant in the market. For example, the platform is the custodian for Bitcoin spot exchange-traded funds (ETFs) like BlackRock’s IBIT and Grayscale’s GBTC.
There also appears to be an interesting pattern between the dominance of the American exchange and the Bitcoin spot price. The quant has highlighted this trend in the graph.
There have been a few instances where a rise in the spot trading volume of Coinbase against Binance has preceded surges in the value of cryptocurrency. Similarly, declines in the platform’s dominance have seemingly led to drawdowns in the Bitcoin price.
The analyst has also discussed the trend in the volumes of the two exchanges more closely, using the spot volume ratio for them, as shown below.

The chart shows that the spot volume ratio between Binance and Coinbase had spiked to very high levels in 2023, with the former’s volume being 53 times the latter’s. The reason behind this was the zero-fee scheme that Binance had introduced for the Bitcoin trading pairs.
However, Coinbase’s volume has recently risen, although the ratio remains notably in favor of Binance. This shift in the market emerged as the Bitcoin spot ETF-related news started to intensify.
The quant concludes:
The dynamics between these exchanges are complex, but the graphs show that each exchange’s dominance at specific times has a direct impact on the price of Bitcoin. It’s a true battle between the market’s biggest players, where competition is constant, and the outcome is reflected in cryptocurrency movements.
BTC Price
At the time of writing, Bitcoin is trading at around ,800, down 3% over the past week.
Ethereum ETFs Face Uphill Battle With SEC: Analyst Foresees Possible Delay Until 2025
 A senior Bloomberg ETF analyst predicts that spot ethereum exchange-traded funds (ETFs) in the U.S. are unlikely to emerge this year. Despite the Securities and Exchange Commission (SEC) approving spot bitcoin ETFs, the same is not expected for Ethereum due to different regulatory considerations. The forthcoming U.S. election could further impact this scenario, potentially altering […]
Bitcoin News