 Standard Chartered has predicted that bitcoin could hit a fresh all-time high in August and reach 0,000 by the November U.S. presidential election. The bank’s analyst expects a Trump victory to boost the price of bitcoin, while maintaining year-end and 2025 targets of 0,000 and 0,000, respectively. Bitcoin Surge Predicted Amid US Presidential Race Standard […]
Bitcoin News
Is The CRV Painful Dip Over? This Event In August Could Spark A Rally
CRV, the native token of the stablecoin decentralized exchange Curve Finance, has been dumping in over the last year or so. After last week’s plunge, the token fell by as much as 75% from March 2024 highs, a huge concern for token holders.
CRV Recovers, Adds 45% After Plunging
However, according to one analyst who took to X, the bottom could be in, arguing that favorable fundamental events in roughly two months could propel the token to as high as . CRV is changing hands at around .32, up 42% from last week’s lows.
Most importantly, prices are stabilizing, with the impressive follow-through of June 13. After the flash crash that day, prices fell to as low as .22.
However, what was encouraging was the long lower wick, pointing to welcomed demand by the close of the trading day. This push was clear the next day when prices closed higher, with bulls extending gains over the weekend.
Whether the June 13 plunge marked the end of CRV woes remains to be seen. For now, the sharp 45% recovery from last week’s lows and the expansion in Ethereum prices could create demand, further propelling CRV to the .40 mark.
Curve To Change Token Emission As Erogov’s Bad Debt Cleared
The analyst thinks something big is in the pipeline for Curve Finance as a protocol and CRV as the primary token priming platform. In mid-August, the token’s inflation rate would fall from 20.37% to as low as 6.34%. This reduction would be primarily because of the protocol’s shift to CRV distribution.
From August 12, Curve will automatically cease allocating CRV to the core team for vesting. Instead, gauges will distribute the token directly to the community, drastically slashing inflation.
Curve gauges determine how CRV is distributed to various liquidity pools. Through gauges, Curve Finance remains decentralized. This is because token holders can now vote on how much the liquidity providers of a given pool can receive CRV as an incentive.
Besides the shift in CRV distribution, the liquidation of Michael Egorov’s position eliminates the issue of bad debt. Accordingly, Curve can not generate real revenue for CRV holders, drawing value.
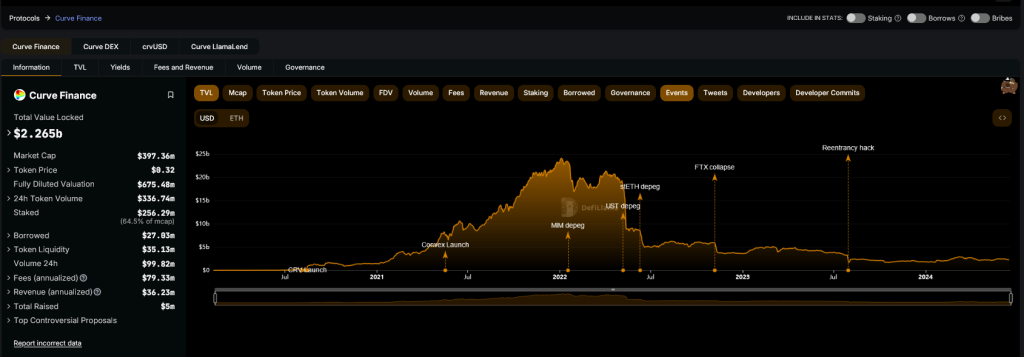
According to the analyst, Curve could evolve to be a leading decentralized Forex market over the coming years. The protocol is one of the largest decentralized finance (DeFi) platforms. According to DeFiLlama, it commands a total value locked of over .2 billion.
Robert Kiyosaki Says His Prediction of Bitcoin Hitting $350K in August ‘Is Not a Lie’ — Also Bullish on Ethereum and Solana
 Rich Dad Poor Dad author Robert Kiyosaki has emphasized that his prediction of bitcoin hitting 0K on Aug. 25 “is not a lie.” He also expressed his bullish outlook for ethereum and solana, noting that he will keep buying the three cryptocurrencies because he is “quite certain their prices will continue to rise.” Robert Kiyosaki […]
Bitcoin News
Déjà Vu? Bitcoin Price Eyes Repeat Performance, Could Hit $140,000 By August – Analyst
Recent bitcoin analysis and predictions from leading experts shed light on the potential trajectory of the top crypto asset’s price in the coming months, with a focus on 2024 and beyond.
Market Insights And Price Forecasts For Bitcoin
As the crypto community eagerly anticipates the future of Bitcoin, a diverse range of price predictions has emerged. Notable figures such as Arthur Hayes, Messari, Tim Draper, JP Morgan, Berenberg, and VanEck have weighed in with their forecasts, painting a varied picture of what lies ahead for the pioneering cryptocurrency.
While some experts project conservative estimates, suggesting a price range of around ,000, others are more bullish, envisioning BTC soaring to over 0,000 by 2024.
These forecasts are underpinned by a nuanced understanding of market dynamics, including factors such as institutional interest, regulatory developments, and the impact of halving events on Bitcoin’s supply and demand dynamics.
Historical Analysis And Market Cycle Patterns
Drawing insights from historical data and market cycle patterns, analysts have identified intriguing parallels that could signal significant upside potential for Bitcoin. Previous market cycles have shown that after surpassing key all-time highs, Bitcoin prices have the propensity to double within a relatively short timeframe.
The analysis of past cycles, particularly the peaks in 2013, 2017, and 2021, suggests a pattern of rapid price appreciation following the breach of previous price records. If history is any indication, Bitcoin could be poised for a substantial move upwards, with projections indicating a potential doubling in price to around 0,000 in the near future.
Expert Opinions And Market Sentiment
Amidst the flurry of price predictions and market analyses, experts and analysts continue to offer valuable insights into the evolving landscape of cryptocurrency markets. Notable figures such as Alphanalysis and Will Woo have shared their perspectives on Bitcoin’s price trajectory, highlighting the importance of market corrections, accumulation phases, and the gradual build-up towards new all-time highs.
In 2017 the price of Bitcoin doubled in just 4 weeks after it established brand new all time highs.
In 2021 the price of Bitcoin doubled in just 4 weeks after it established brand new all time highs.
In 2024 the same action would imply a 8,000 price by the end of June.
pic.twitter.com/4kOBPa6y11
— alphanalysis.io (@Sawcruhteez) May 22, 2024

While everyone was freaking out that #Bitcoin price was not rising the last 2 months, available BTC was quietly being scooped up, and importantly without paper BTC printed in its place.
Last time I’ll say it… It’s only a matter of time before BTC squeezes past all-time-highs. https://t.co/j2FJs7bSpc pic.twitter.com/HoPSSJfHqz
— Willy Woo (@woonomic) May 22, 2024
Bitcoin Price Prediction
Meanwhile, in the most recent estimate of CoinCodex for the price of Bitcoin, it shows the price will increase by 27% by June 22, 2024, to reach ,997. This technical indicator indicates that the present mood is bullish, and the Fear & Greed Index is reading 76, which indicates extreme greed.
Over the previous 30 days, Bitcoin’s price fluctuated by 4.47%, with 12 out of 30 (or 40%) green days. The Bitcoin forecast indicates that this is a favorable moment to purchase Bitcoin.
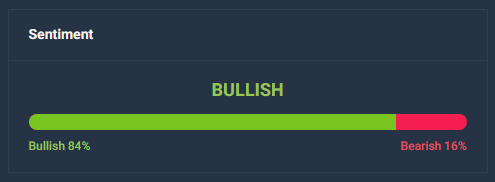
Latest data shows that there is a bullish general mood on Bitcoin price prediction, with 84% technical analysis indicators indicating optimistic signs and 16% indicating negative signals.
Featured image from NPR, chart from TradingView
Former Bitmex Chief Expects Bitcoin to Trade Within $60K-$70K Range Until August
 Former Bitmex CEO Arthur Hayes predicts bitcoin will range-bound trade between ,000 and ,000 until August. “The slow addition of billions of dollars of liquidity each month will dampen negative price movement from here on out,” Hayes said, adding that he expects “prices to bottom, chop, and begin a slow grind higher.” Arthur Hayes’ Bitcoin […]
Bitcoin News
Bitcoin All-Time High Ahead: Historical Pattern Signals 50% Chance Of Reaching $100K By August
Bitcoin (BTC), the world’s largest cryptocurrency, has surged to a 26-month high, reaching ,000 and reigniting predictions of surpassing its previous all-time high (ATH) of ,000.
The market has experienced a resurgence of bullish sentiments, fueled further by the recent adoption of Bitcoin spot exchange-traded funds (ETFs). These have spurred notable growth within just one month of approval by the US Securities and Exchange Commission (SEC).
Bitcoin Poised For A Major Breakout?
Investment manager and market expert Timothy Peterson, who recently made a bold claim on social media platform X (formerly Twitter), reinforces Bitcoin’s renewed optimism.
Peterson stated that Bitcoin had achieved an almost exact 100% gain in 180 days, a feat that has occurred 41 times since 2015. In 78% of these instances, Bitcoin reached even higher price levels.
Furthermore, Peterson’s analysis of historical data suggests that the average return for the next 180 days after such a gain was also approximately 100%.Based on this historical pattern, Peterson asserts that there is a 50% chance Bitcoin will reach the significant milestone of 0,000 by August.
However, despite this possibility, as the halving event approaches, there could be another correction that, while not putting the bull run in jeopardy, could trigger significant liquidation rates as the hype surrounding the current uptrend mounts.
Pre-Halving Correction Looms
The upcoming halving event scheduled for April, combined with historical patterns, suggests that Bitcoin may experience one final correction before the bull run resumes, presenting a crucial moment for investors.
Crypto analyst Rekt Capital emphasizes the significance of a pre-halving retrace, noting that historically, it tends to occur only a few weeks before the actual halving event.
Looking back at previous halvings, such retracements have ranged from -38% in 2016 to -20% in 2020. Based on these patterns, a retracement of around 27% is possible in the current market scenario.
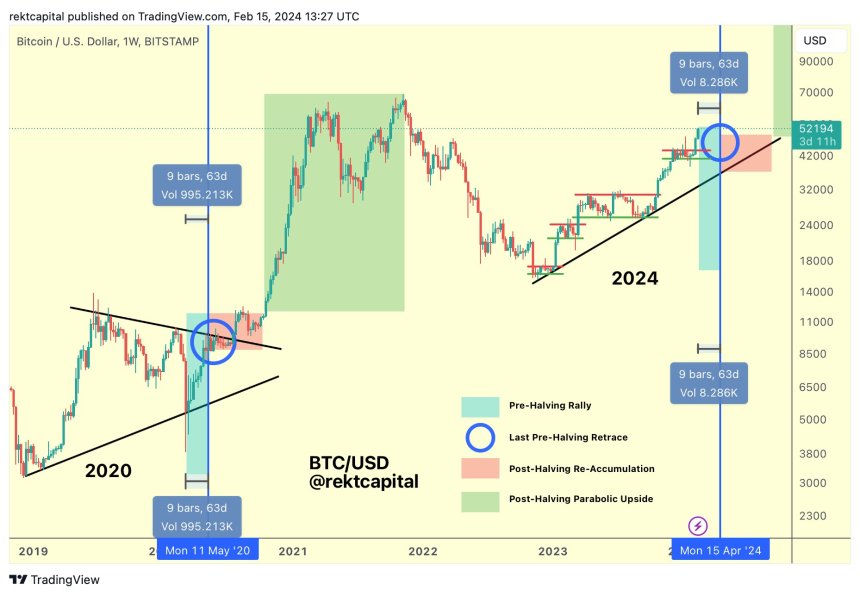
If a retracement of this magnitude were to occur, it would place the Bitcoin price at approximately ,900, as indicated in Rekt Capital’s pre-halving retrace chart. This level represents an important threshold for investors to accumulate the cryptocurrency before the next phase of the halving event and the anticipated bull run rally.
Key Resistance For BTC’s Trajectory
Bitcoin’s continued rise has brought its price to a critical juncture, with the current trading level of ,100 catching the attention of the founders of blockchain data and intelligence platform Glassnode.
According to their analysis, historical data reveals that the ,000 level has acted as a formidable resistance point on the weekly chart, making it a crucial threshold for Bitcoin’s trajectory.
The platform’s founders suggest that a successful breach of this level could trigger a surge of buying pressure, potentially leading to a Fear of Missing Out (FOMO) scenario among investors.
Overall, the future direction of BTC price remains uncertain, leaving investors to ponder whether the current uptrend will be sustained or if a potential pre-halving retrace will occur before resuming its upward trajectory to surpass its previous all-time high and reach the coveted 0,000 level.
Featured image from Shutterstock, chart from TradingView.com
FDUSD Nears $1 Billion Cap — A Rapid 253% Surge in Supply Since August
Recent data indicates that the market capitalization of the newly introduced stablecoin, first digital usd (FDUSD), is approaching the billion threshold. This growth, a 253% increase in supply, has been recorded since August 4, 2023. Currently, the circulation of FDUSD tokens stands at 921 million.
FDUSD’s Market Value Climbs Toward Billion in Just 120 Days
Since its inception, FDUSD’s market value is on the brink of reaching billion, having expanded its supply by a substantial 253% over the past 120 days from August 4, 2023. To date, the issuer of FDUSD has released three attestations, with the latest monthly report concluding in October. As of December 2, 2023, the circulation of first digital usd (FDUSD) stands at approximately 921,272,192 tokens.

Of the 921 million FDUSD in existence, a mere 224 holders possess the stablecoin, which has been transacted onchain only 1,471 times. Dominating the FDUSD landscape, Binance holds the top three addresses. The leading address alone accounts for a staggering 90.96% of FDUSD’s total supply. Following closely, Binance‘s second wallet contains 7.65% of the circulating FDUSD. The third wallet, also under Binance’s control, holds 0.81%.
Wintermute owns the fourth-largest FDUSD wallet, comprising 0.16% of the total supply, equivalent to 1,502,179 FDUSD. The fifth-largest wallet, whose owner remains unidentified, controls 999,998 FDUSD, or 0.10% of the supply. Collectively, the top 100 holders own 921,269,821.68 FDUSD tokens, nearly the entire circulation.
FDUSD’s rising prominence has positioned it as the sixth-largest USD-pegged token by market capitalization. While it closely trails behind BUSD, TUSD, and DAI, FDUSD is considerably smaller compared to giants like USDC and USDT. However, it boasts a larger supply than newer entrants like Paypal’s PYUSD, Tron’s USDD, and Gemini’s GUSD stablecoin.
What are your thoughts about FDUSD’s growth over the past 120 days? Share your thoughts and opinions about this subject in the comments section below.
XRP Shines Bright: 14% Weekly Gains And New Highs After August Dip
XRP has demonstrated its resilience in the volatile world of digital assets. This week, XRP investors and enthusiasts have ample reasons to celebrate as the coin saw an impressive surge of 14.2% in its price over the past seven days, bringing it to a notable high after its last dip in August.
This remarkable surge highlights the cryptocurrency’s ability to experience significant price movements within a relatively short timeframe. The upward trajectory of XRP’s price over the past week suggests an increase in investor interest or positive market sentiment, which has driven its value to levels higher than what was observed just seven days ago. At the time of writing, XRP is trading at .559841, with a modest 0.2% loss over the past 24 hours.
One of the most significant indicators of XRP’s current performance is the overwhelming interest from buyers rather than sellers. The Volume Delta metric cited in a price analysis in highlights this trend vividly.
Volume Delta essentially measures the difference between buying and selling pressure in the market, serving as a valuable gauge for traders seeking to make informed decisions. In the case of XRP, this metric is painting a positive picture as buying sentiment dominates, giving traders the confidence to enter long positions.
This surge in buying interest suggests that investors have renewed faith in the coin’s potential, as the coin has rebounded from the lows witnessed in the past. With growing adoption and an increasing number of use cases for XRP, it’s no surprise that the cryptocurrency is attracting a substantial inflow of funds.
Large XRP Transfer To Bitstamp Sparks Intrigue
Meanwhile, in the world of cryptocurrency transactions, a noteworthy event has piqued the interest of the XRP community. In the last 24 hours, an anonymous wallet executed a substantial transfer of 26,800,000 XRP to the major EU-based exchange, Bitstamp. This sizeable movement of XRP tokens has raised questions and fueled speculation within the crypto community.
Data provided by the XRP explorer, Bithomp, has shed some light on the sender’s identity, revealing a connection to Ripple Labs, a blockchain decacorn known for its involvement in the development and promotion of the token’s ecosystem. This significant transfer underscores the confidence in its future, as well as the growing influence of Ripple Labs within the cryptocurrency space.
XRP’s Resurgence Indicates Positive Market Sentiment
The crypto’s recent performance showcases its ability to rebound from challenging times and regain investor confidence. With a notable surge in price over the past week, XRP has demonstrated its potential to shine in the competitive world of cryptocurrencies. The dominance of buying sentiment, as indicated by the Volume Delta metric, hints at a positive market outlook for XRP.
Furthermore, the substantial transfer to Bitstamp, likely orchestrated by Ripple Labs, adds an intriguing layer to the narrative, emphasizing the ongoing commitment of key players to the success of XRP and the broader blockchain ecosystem.
As XRP continues to carve its path in the digital asset landscape, investors and enthusiasts eagerly await further developments, making this cryptocurrency a compelling one to watch in the coming weeks and months.
(This site’s content should not be construed as investment advice. Investing involves risk. When you invest, your capital is subject to risk).
Featured image from FX Empire
This Shibarium Milestone Could Rocket Shiba Inu To August Highs
Shiba Inu’s latest price action seems like the meme token has bounced off the critical .0000061 support level to set the stage for a possible bull run. The cryptocurrency is up by 3.63% in the past 24 hours and 5.79% in a seven-day timeframe.
However, a larger timescale reveals a different picture, as the value of the cryptocurrency has dropped by 49% since reaching its yearly high of 0.00001471 on February 5. Nevertheless, positive momentum could be building up at the moment, particularly with Shiba Inu’s Layer-2 scaling solution Shibarium attaining a new milestone.
Shibarium Reaches 1.3 Million Mined Blocks
Shibarium was created to provide lower gas fees and faster transaction times for Shiba Inu. As a result, the Layer-2 scaling solution has been well accepted by the Shiba Inu community since it launched, despite having a few hiccups after its early stages. Data from Shibariumscan revealed that Shibarium recently surpassed 1.3 million blocks mined and a total transaction of 3.574 million.
The 1.3 million block milestone in such a short time shows the sheer capability and adaption of Shibarium. Each block has an average processing time of 5.0 seconds, demonstrating its efficiency and speed. In comparison, Bitcoin, the world’s largest cryptocurrency, has a block creation time of 10 minutes.
Potential Price Impact For SHIB?
Past news around Shibarium has always positively affected the price of SHIB. Each new milestone and benchmark reached in developing Shibarium generates excitement and drives up the price of SHIB.
Rumors surrounding its launch in August propelled SHIB to .00001137, although it has since lost most of those gains. At the time of writing, SHIB is trading at .000007484, and it appears to be on the verge of a price breakout that could retest its August highs. This would mean a 43% spike from its current price.
According to data from DeFi aggregator DeFiLlama, the total TVL in Shibarium is now at 0,562. While this is low compared to its TVL of .47 million in late August, the new milestone and Shibarium’s continued adoption could also push up the TVL in the next few days.
What’s Next For Shiba Inu?
The entire crypto market has had an influx of funds in the past few days, with Bitcoin leading the charge with a 24-hour increase of 10.37%. SHIB has also piggybacked on these gains and has had a few whale movements.

— Whale Alert (@whale_alert) October 21, 2023
Recent price action shows the crypto testing a minor resistance at the .0000076 level. A strong breakout could push SHIB to another resistance at .0000087 and then to its August high of .00001137.
With a thriving layer 2 ecosystem and a large community, Shiba Inu could transition from being just another meme cryptocurrency to cement itself as a leader in decentralized finance and payments.
Biggest Movers: MATIC Moves to Highest Point Since August
Polygon surged to its strongest level since the end of August, as the token extended recent gains. The rally comes despite cryptocurrencies mostly consolidating on Wednesday, following recent declines. XRP was another notable gainer today.
Polygon (MATIC)
Polygon (MATIC) rose for a back-to-back session on Wednesday, hitting a multi-week high in the process.
MATIC/USD moved to an intraday high of .5937 in today’s session, which comes following a low of .5523 the day before.
This resulted in polygon climbing to its highest point since August 29, when the price peaked at .6355.
Looking at the chart, the surge saw the relative strength index (RSI) rise past a ceiling at the 62.00 zone.
Currently, the index is now at a reading of 62.76, with an upcoming resistance level at the 70.00 point.
A crossover between the 10-day (red) and 25-day (blue) moving averages also seems to be one of the reasons for today’s rally.
XRP
XRP was another big mover on Wednesday, as the price attempted to break out of a key resistance level.
After Tuesday’s low at .5075, XRP/USD rallied to an intraday high of .5449 during today’s session.
As a result of this surge, the world’s fifth-largest cryptocurrency briefly rose past a ceiling at .5400.
Earlier gains have since edged lower, which comes as the RSI fell below a ceiling at the 62.00 mark.
The index has since dropped further, and is now tracking at 56.57, and seems to be heading towards a floor of 51.00.
Register your email here to get weekly price analysis updates sent to your inbox:
Will XRP plunge further as the session progresses? Let us know your thoughts in the comments.