 The volume of daily transactions on the Bitcoin network has seen a significant decline since Jan. 28, 2024, with numbers falling from peaks above 600,000 to below 300,000 transactions per day. This downturn is in sync with a decrease in the daily creation of Ordinal inscriptions, overall easing congestion and reducing onchain fees. Network Activity […]
Bitcoin News
SEC Sees Surge in Spot Bitcoin ETF Securities Registrations as Approval Deadline Approaches
Five spot bitcoin exchange-traded fund (ETF) applicants have filed to register their funds as securities with the U.S. Securities and Exchange Commission (SEC) as the approval deadline draws near. While some interpret this development as approval confirmation of spot bitcoin ETFs by the SEC, experts clarify that several steps remain before these ETFs are greenlighted to launch.
Vaneck, Valkyrie, Fidelity, Bitwise, and Grayscale File to Register Spot Bitcoin ETFs as Securities With SEC
Several asset managers have filed to register their spot bitcoin exchange-traded funds (ETFs) as securities with the U.S. Securities and Exchange Commission (SEC). The first deadline for a spot bitcoin ETF decision is Jan. 10. However, many expect the SEC to make a decision before that date.
Vaneck, Valkyrie, and Grayscale Investments filed on Thursday. Fidelity filed on Wednesday, and Bitwise filed last week. Grayscale’s and Bitwise’s spot bitcoin ETFs plan to list on the NYSE Arca exchange. Vaneck’s and Fidelity’s spot bitcoin ETFs will be listed on the Cboe BZX Exchange, and Valkyrie is seeking to list on Nasdaq.
Fidelity’s filing details: “The securities to be registered hereunder are shares … of the Fidelity Wise Origin Bitcoin Fund … An application for listing of the shares of the trust has been filed with and approved by Cboe BZX Exchange, Inc.”
More Steps Remain Before Spot Bitcoin ETFs Can Launch
Some people on social media took securities registration filings as confirmation that the SEC has approved these spot bitcoin ETFs.
Bloomberg analyst James Seyffart explained that to his understanding for an ETF to launch, Form S-1 (registration statement) has to be completed and Form 19b-4, used for a proposed rule change by a self-regulatory organization (SRO), has to also be approved. “In order to list, the ETF still needs a 19b-4 approval and they need an effective/approved/completed S-1 document. No 19b-4 yet. And S-1 is still preliminary,” Seyffart wrote.
While noting that securities registration needs to be done before a spot bitcoin ETF can launch, the analyst emphasized: “But they don’t mean they’re approved or anything — yet.”
Vaneck’s director of digital assets strategy, Gabor Gurbacs, explained the process of launching a spot bitcoin ETF or any exchange-traded products (ETPs) on X Wednesdat:
An issuer can register a security, but approved 19b-4 and effective S-1 still needed to be in place to launch an ETF/ETP … it’s clear that people know very little about the ETF process and hype up everything. Stay calm and enjoy the show.
What do you think about spot bitcoin ETF applicants filing for securities registrations for their spot bitcoin ETFs with the SEC ahead of potential approval? Let us know in the comments section below.
Ethereum Price Relatively Muted But Approaches Crucial Breakout
Ethereum price is consolidating gains below the ,350 resistance zone. ETH could revisit the ,200 support before it starts a fresh increase.
- Ethereum is still holding gains above the ,250 support zone.
- The price is trading below ,280 and the 100-hourly Simple Moving Average.
- There is a connecting bearish trend line forming with resistance near ,290 on the hourly chart of ETH/USD (data feed via Kraken).
- The pair could extend its decline and revisit the ,200 support zone.
Ethereum Price Remains In A Range
Ethereum price started a downside correction from the ,350 level. ETH declined below the ,320 and ,300 levels. It even spiked below the ,250 level.
A low was formed near ,247 and the price is now attempting a fresh increase, like Bitcoin. There was a move above the ,265 level. The price climbed above the 23.6% Fib retracement level of the downward move from the ,327 swing high to the ,247 low.
Ethereum is now trading below ,280 and the 100-hourly Simple Moving Average. On the upside, the price is facing resistance near the ,290 level. There is also a connecting bearish trend line forming with resistance near ,290 on the hourly chart of ETH/USD.
The trend line is close to the 50% Fib retracement level of the downward move from the ,327 swing high to the ,247 low. A close above the ,290 resistance could send the price toward ,320.
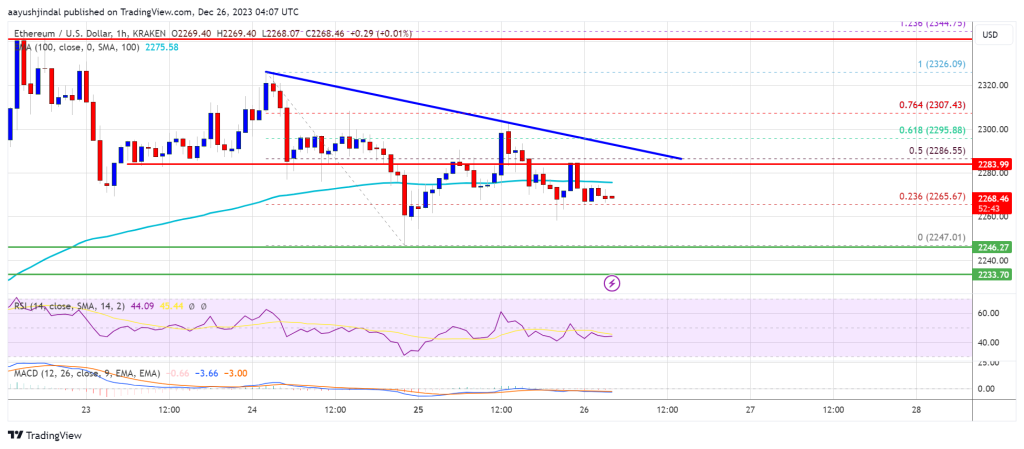
Source: ETHUSD on TradingView.com
The main resistance sits at ,350. A clear move above the ,350 zone could start a major increase. The next resistance sits at ,420, above which Ethereum might rally and test the ,550 zone.
More Losses in ETH?
If Ethereum fails to clear the ,290 resistance, it could start a fresh decline. Initial support on the downside is near the ,250 level.
The first key support could be the ,220 zone. A downside break and a close below ,220 might spark more bearish moves. In the stated case, Ether could revisit the ,120 support. Any more losses might send the price toward the ,040 level.
Technical Indicators
Hourly MACD – The MACD for ETH/USD is losing momentum in the bullish zone.
Hourly RSI – The RSI for ETH/USD is now below the 50 level.
Major Support Level – ,220
Major Resistance Level – ,290
Forecast Frenzy — Bitcoin Price Predictions Surge as 2024 Approaches

As 2023 winds down with bitcoin soaring by 165% since January, numerous luminaries, visionaries, speculators, and market players predict that the leading cryptocurrency’s value will soar even higher in 2024. This week, Markus Thielen, leading Matrixport’s research division, shared insights expecting approval for a spot bitcoin exchange-traded fund (ETF) come January and highlighted that BTC’s value is likely to surge past K each by the month’s close.
Analysts Predict Sky-High Bitcoin Prices in 2024, While Some Projections Are More Grounded
Ever since bitcoin’s value ascended past the K mark, a flurry of forecasts emerged, with many anticipating a significant surge in bitcoin’s worth come 2024. For example, Bitwise, a well known crypto asset management firm, unveiled ten predictions for the upcoming year, suggesting bitcoin might climb to ,000. Similarly, the crypto derivatives exchange Bitget projected bitcoin might hit the 0K threshold, amidst other predictions aiming for even loftier heights.
On Dec. 20, 2023, Matrixport’s lead researcher Markus Thielen detailed that his team is expecting a spot bitcoin (BTC) ETF approval in January. “We are expecting the SEC to approve bitcoin Spot ETFs in January,” Thielen wrote. “This should lift bitcoin prices above ,000 by the end of January 2024.” The researcher added:
Parallels to historical instances, such as the CME Group’s bitcoin futures launch in 2017, we note significant price escalation preceding the event. From the moment the CME confirmed the launch of bitcoin futures until traders could trade those futures, there was a window of six-to-seven weeks with prices rising by +196%.
While numerous forecasts aim high, some 2024 predictions are more grounded. Changelly’s web portal suggests a modest January 2024 bitcoin value, predicting a minimum of ,156 and an average of ,240. Yet, looking ahead to 2025, Changelly anticipates a rise, with a minimum BTC price of ,001 and an average of ,359. In another vein, a Polymarket prediction market, valued at ,895, is questioning whether BTC will reach a new all-time high (ATH) by March 31, 2024.
Currently, about 21% of Polymarket’s bettors believe BTC will achieve an ATH by that date, while a significant 81% do not foresee it hitting an ATH by then. As 2023 concludes with bitcoin’s impressive price rise, the crypto community buzzes with anticipation, energized by promising trends.
Projections vary, but the common thread is optimism, with significant events such as a spot bitcoin ETF and the halving event on the horizon possibly catalyzing further growth. Whether reality meets these lofty expectations or treads a more modest path, the journey ahead for bitcoin remains a focal point of global financial discourse.
What do you think about the bitcoin price predictions for 2024? Share your thoughts and opinions about this subject in the comments section below.
Bitcoin Price Approaches Breakout – Why BTC Could Rally 10%
Bitcoin price is gaining pace and trading above the ,000 resistance. BTC could continue to rise once it clears the ,500 and ,000 resistance levels.
- Bitcoin started a decent increase above the ,500 resistance zone.
- The price is trading above ,500 and the 100 hourly Simple moving average.
- There is a key bullish trend line forming with support near ,800 on the hourly chart of the BTC/USD pair (data feed from Kraken).
- The pair could start a strong rally if there is a close above ,300 and ,500.
Bitcoin Price Aims Higher
Bitcoin price settled above the ,500 resistance zone to move further into a bullish zone. BTC broke many hurdles and even spiked above the ,000 level.
It tested the ,300 resistance zone. A high was formed near ,300 and the price is now consolidating gains. The price corrected a few points below the ,100 level. However, it is stable above the 23.6% Fib retracement level of the upward move from the ,820 swing low to the ,300 high.
Bitcoin is now trading above ,500 and the 100 hourly Simple moving average. There is also a key bullish trend line forming with support near ,800 on the hourly chart of the BTC/USD pair.
On the upside, immediate resistance is near the ,200 level. The first major resistance is forming near ,300 and ,500. A close above the ,500 resistance could start a strong rally and the price could even clear the ,000 resistance.
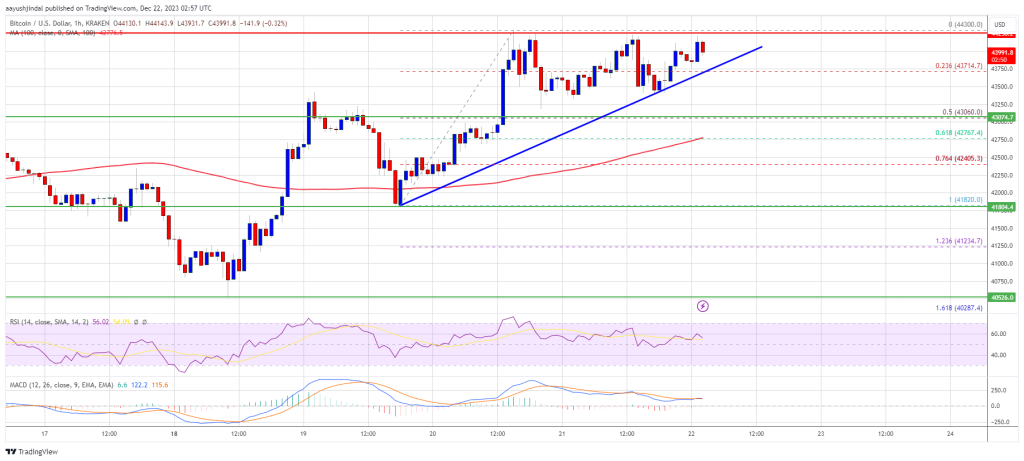
Source: BTCUSD on TradingView.com
The next key resistance could be near ,500, above which BTC could rise toward the ,200 level. Any more gains might send the price toward ,000.
Fresh Decline In BTC?
If Bitcoin fails to rise above the ,300 resistance zone, it could start a fresh decline. Immediate support on the downside is near the ,800 level and the trend line.
The next major support is near ,750 or the 61.8% Fib retracement level of the upward move from the ,820 swing low to the ,300 high. If there is a move below ,750, there is a risk of more losses. In the stated case, the price could drop toward the ,200 support in the near term.
Technical indicators:
Hourly MACD – The MACD is now gaining pace in the bullish zone.
Hourly RSI (Relative Strength Index) – The RSI for BTC/USD is now above the 50 level.
Major Support Levels – ,800, followed by ,750.
Major Resistance Levels – ,300, ,500, and ,000.
Fed Observer Jim Grant Foresees Long-Term High Rates as FOMC Meeting Approaches
Market participants, including both investors and traders, have their attention keenly set on the upcoming Federal Open Market Committee (FOMC) meeting, slated for Dec. 13, 2023. There is widespread speculation about whether Fed Chair Jerome Powell will continue to uphold the current elevated benchmark interest rate. Concurrently, Jim Grant, renowned for his four-decade-long work on Grant’s Interest Rate Observer, holds the conviction that interest rates will stay at a “higher for much, much, much, much longer” level.
Economic Expert Jim Grant Anticipates Persistent High Interest Rates Post-FOMC
Presently, the federal funds rate stands between 5.25% and 5.50%, reaching its highest point in 22 years. This benchmark rate, crucial for banks and other financial institutions for inter-lending, serves as a pivotal mechanism for central bank officials in steering U.S. monetary policy. This week, the investment community is eagerly anticipating the Federal Open Market Committee’s (FOMC) announcement, as well as Fed Chair Jerome Powell‘s press remarks after the meeting.
Current market sentiment does not foresee a rate increase by the Fed in the imminent meeting. As per CME’s Fedwatch Tool, the likelihood of a rate hike stands at a mere 2.9%. Conversely, the odds favor the rate remaining unchanged at 97.1% as of Dec. 10, 2023. Additionally, a significant number of market observers predict that the U.S. central bank will have to reduce rates soon. Wall Street Journal journalist Justin Lahart, on Dec. 9, opined that the Fed “can’t put off preparing for rate cuts.”
According to Lahart’s analysis, a shift towards reduced rates seems imminent, with early 2024 likely seeing Powell needing “to start preparing for it.” Yet, not all share this view of impending rate reductions. JPMorgan’s leader Jamie Dimon anticipates an increase in interest rates and a looming recession. On December 9, esteemed financial author and publisher Jim Grant shared insights with Forbes, asserting his belief in persistently high rates for an extended duration.
With over four decades of monitoring the U.S. central bank through his publication, “Grant’s Interest Rate Observer,” Grant voiced concerns in his Forbes interview about an impending economic crisis, highlighting the U.S. economy’s burgeoning debt problem, worsened by years of almost zero interest rates. He anticipates the federal funds rate remaining “higher for much, much, much, much longer.”
Grant added:
It is the historical track record, it is the pattern, that interest rates exhibit a tendency to trend over generation-long intervals.
Still, contrary opinions suggest a shift towards rate reductions by the Fed in mid-2024. In an interview with CNN, KPMG’s chief economist Diane Swonk remarked, “We’re moving into higher-for-long-enough.” Additionally, futures markets indicate a high likelihood of a rate cut by the Fed in March 2024.
As the financial sector awaits the FOMC’s verdict, views are sharply divided. In the meantime, Grant expresses concern over the credit market, burdened by years of inexpensive debt affecting businesses, consumers, and governments. Grant’s opinion is very similar to Dimon’s who emphasized at the 2023 New York Times Dealbook Summit he wasn’t trying to scare people.
What do you think about Jim Grant’s insights? Share your thoughts and opinions about this subject in the comments section below.
Tether (USDT) Cap Approaches $90 Billion: Why This Affects Bitcoin
Data shows that the Tether (USDT) market cap is almost billion. Here’s why this growth could matter for the price of Bitcoin.
Tether Market Cap Has Continued To Observe A Rise Recently
Tether is a cryptocurrency pegged to the US Dollar, meaning its price remains stable around the mark. The asset is the most famous such “stablecoin” in the sector, with its market cap outstripping any other stable’s.
As the market intelligence platform IntoTheBlock pointed out, the largest stablecoin supply has only continued to grow recently. The chart below shows the trend in the market caps of the various stablecoins in the cryptocurrency sector over the past year.
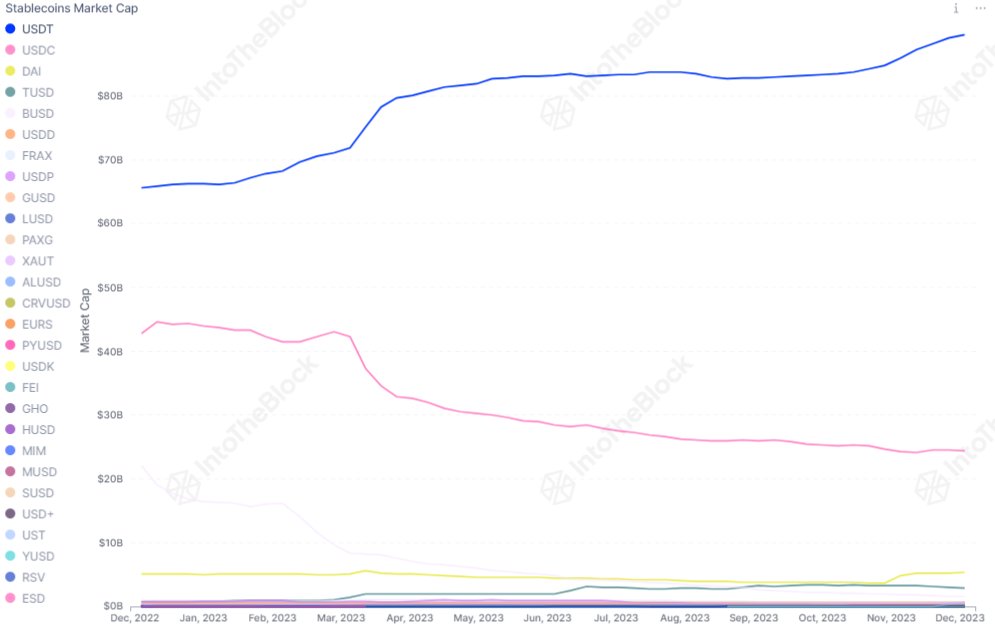
As displayed in the above graph, Tether has observed an overall uptrend during the past year, while USD Coin (USDC), the next largest competitor, has observed outflows as its market cap has fallen.
The chart also puts into perspective how small the other stables are when compared to these two assets, making them perhaps insignificant for the wider market.
What relevance does a large stablecoin like Tether have for Bitcoin and other coins in the sector? The answer to that question lies in what the stablecoins represent.
Generally, investors make use of stables whenever they want to avoid the volatility associated with the other assets in the sector. The holders keeping their capital locked in these fiat-tied tokens usually plan to return towards the volatile side, however, as they would have gone for fiat itself if they wanted to keep away from cryptocurrency altogether.
When such investors finally move back towards coins like Bitcoin, they naturally put buying pressure on their prices. For this reason, the supply of stablecoins could be considered the “potential buying supply” for BTC and others.
There are two ways the USDT market cap grows. The first is an influx of fresh capital directly going to the asset, which is naturally a bullish development as it means the total capital in the sector goes up.
The second is through a swap from another coin like Bitcoin. In this case, the overall capital present in the sector wouldn’t change, as it’s just a reshuffling, but whatever asset is being sold in favor of the stablecoin would naturally see some decline.
The most bullish scenario for the market is, therefore, when both the BTC price and Tether market cap head up, as it implies, a fresh influx of capital is happening towards both the coins.
As analyst James V. Straten explained in a post on X, the correlation between the USDT market cap and BTC has almost hit 100% during this latest rally, as both have shot up.
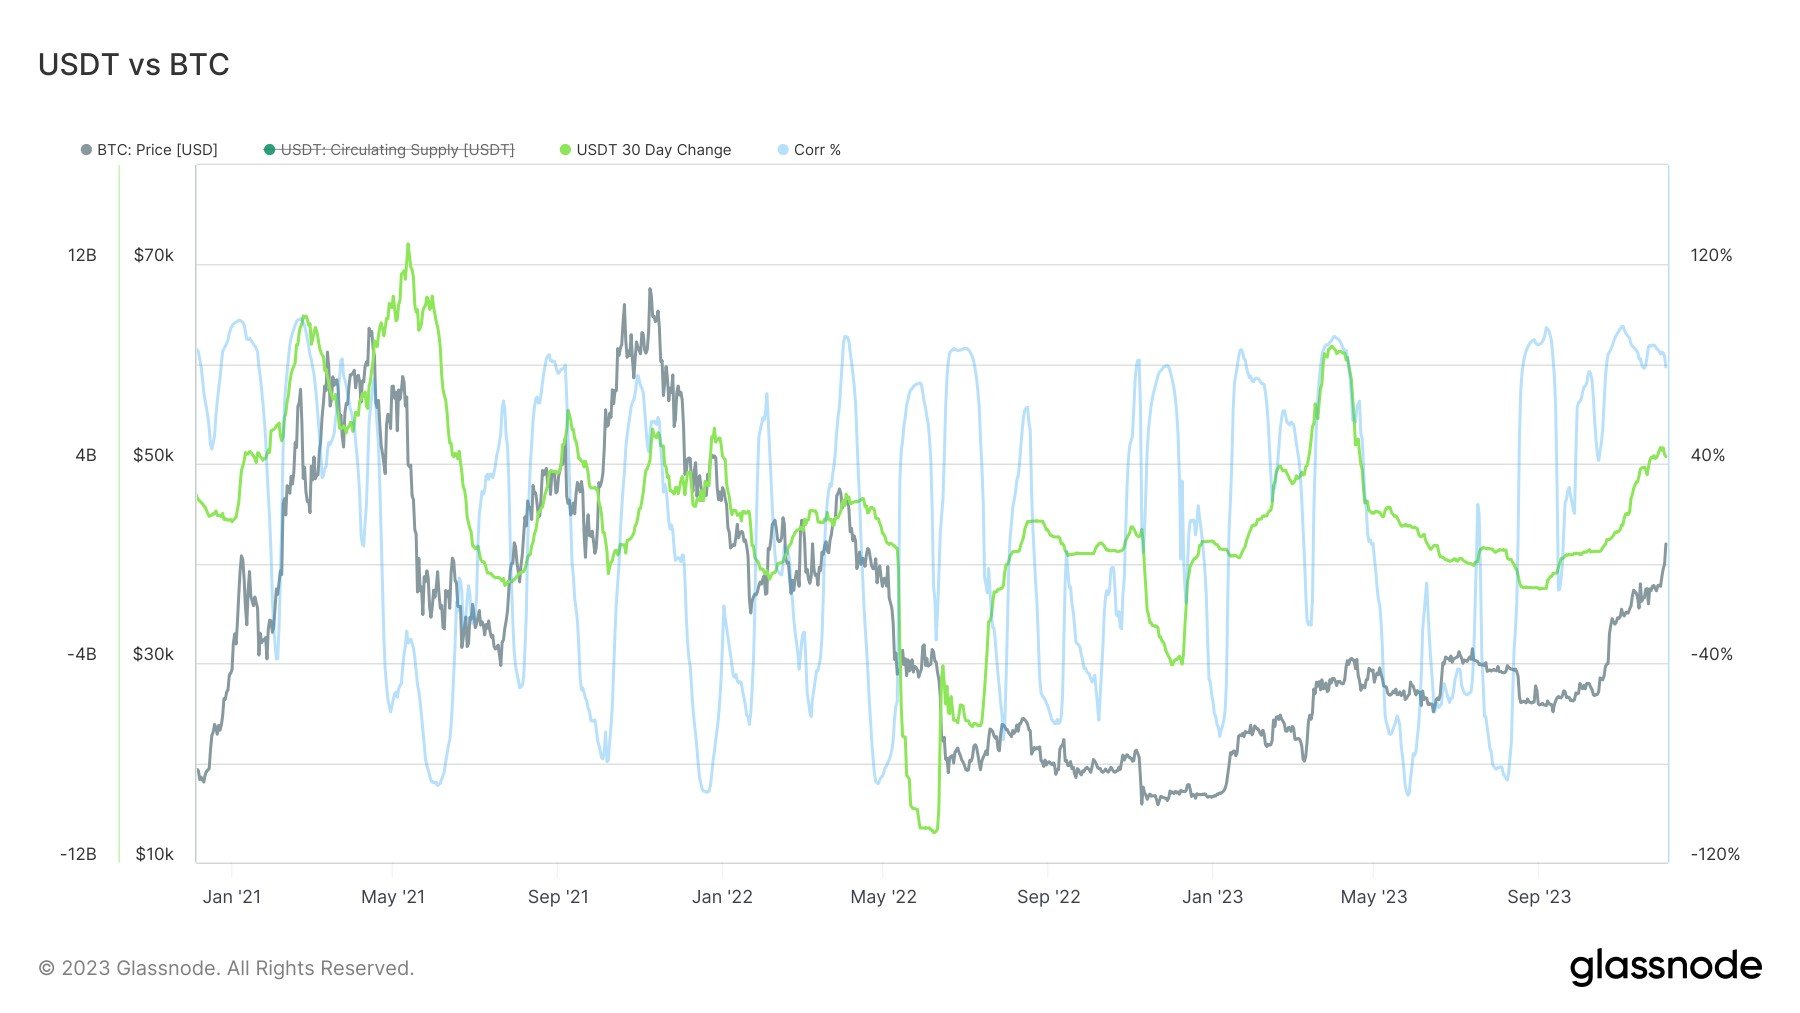
The USDT market cap continuing to grow in these circumstances is certainly an optimistic sign for the current rally, as it means that all this dry powder that’s accumulating could potentially be deployed into Bitcoin should the surge slow down, helping extend the move further.
BTC Price
Bitcoin had breached the ,000 mark earlier in the past day, but the asset has since seen some pullback as it’s now back around ,800.
Bitcoin, Ethereum Technical Analysis: BTC Approaches Key Price Ceiling Ahead of Friday’s US Payrolls Report
Bitcoin continued to consolidate on Thursday, ahead of the upcoming U.S. nonfarm payrolls (NFP) report in the United States. Payrolls are expected to come in at 170,000 for September, down from 187,000 the month prior. Ethereum fell for a fourth straight day.
Bitcoin
Bitcoin (BTC) continued to trade close to a key price ceiling on Thursday, ahead of tomorrow’s NFP report.
BTC/USD peaked at ,875.59 earlier in the day, which comes following a low of ,339.27 the day before.
The move pushed bitcoin closer to a recent resistance level of ,900, however bulls were unable to capture this point.
Earlier gains have since faded, which comes as the relative strength index (RSI) encountered some turbulence of its own.
At the time of writing, the index is at a reading of 60.21, which is marginally below a ceiling at 63.00
Should this decline continue, price strength could land at a floor of 58.00 in the not-too-distant future.
Ethereum
Ethereum (ETH) moved lower for a fourth straight session on Thursday, as the cryptocurrency closed in on a recent point of support.
Following a high of ,654.43 on Wednesday, ETH/USD dropped to an intraday low of ,632.72 earlier today.
This extended slippage pushed ethereum towards a floor at ,620, which was last hit on September 29.
Today’s fall in price came as the RSI marginally dropped below a support of its own at the 50.00 zone.
Currently, the indicator is reading 49.24, with a lower level at 44.00 a possible target for sellers in the market.
Register your email here to get weekly price analysis updates sent to your inbox:
How will nonfarm payrolls impact crypto prices? Leave your thoughts in the comments below.
Cardano (ADA) Approaches The $0.3 Resistance: What Lies Ahead?
The journey of Cardano (ADA) toward reclaiming the .3 price level seems to be growing more challenging in the days ahead, as the cryptocurrency grapples with persistent bearish pressure.
After successfully managing to hold the line at .3 during the latter part of July, the digital asset encountered a setback in early August when this crucial support level split, potentially paving the way for further price declines.
The .3 mark not only signifies a March low but also acted as a pivotal resistance point during the months of June and July. This level demonstrated its resilience by transforming into a support level in late July and early August. Nevertheless, the breach experienced in early August did not immediately send ADA into a downward spiral.
However, recent price analysis reveals a concerning development: a retest of this level followed by a price rejection has formed a bearish order block (OB) on the daily chart.
Founder’s Jab At Ethereum Adds Intrigue Amidst ADA Struggles
Meanwhile, Charles Hoskinson, the visionary founder of Cardano, has thrown shade at Ethereum, a primary rival in the cryptocurrency landscape.
I remember when we were brutally mocked by the ETH Devs about the design of Ouroboros. Goodtimes
— Charles Hoskinson (@IOHK_Charles) August 12, 2023
Hoskinson’s remarks were sparked by a video clip in which Ethereum developer Justin Drake commented on staking, likening it to sausage-making and suggesting that understanding the intricate process could lead to disillusionment.
Hoskinson’s use of the colloquialism underscores his perspective on Ethereum’s staking mechanism. Some interpreted his comment as a candid critique of the opacity surrounding Ethereum’s staking process, hinting at potential undesirable aspects hidden beneath the surface.
Ethereum’s own founder, Vitalik Buterin, has previously expressed reservations about staking Ether due to security and operational complexities, providing a backdrop to Hoskinson’s dig.
Cardano Market Performance
At present, ADA is trading at approximately .290, according to CoinGecko data. Over the last 24 hours, the cryptocurrency has remained flat, while its value has decreased by a measly 0.5% over the past seven days.

As the broader cryptocurrency market continues to navigate through volatility, Cardano’s ability to regain its foothold at the .3 level remains a pivotal factor in determining its short-term trajectory.
Cardano’s struggle to recapture this price level amidst ongoing bearish pressure is a matter of growing concern. The recent breach of this crucial support level, coupled with a bearish order block formation, underscores the challenges ahead.
In addition, Hoskinson’s subtle critique of Ethereum’s staking process adds an intriguing layer to ADA’s narrative, as the cryptocurrency community keenly watches its path forward in a dynamic and evolving landscape.
(This site’s content should not be construed as investment advice. Investing involves risk. When you invest, your capital is subject to risk).
Featured image from Analytics Insight
Bitcoin, Ethereum Technical Analysis: BTC Back Above $28,000, as ‘Death Cross’ Approaches

Bitcoin was once again trading above ,000 on Tuesday, as the 10-day and 25-day moving averages neared a death cross. The two trend lines have moved closer to one another, with an upwards bullish crossover somewhat imminent. Ethereum was also marginally higher today.
Bitcoin
Bitcoin (BTC) jumped back above ,000 on Tuesday, with a possible death cross signaling upcoming bullish momentum.
BTC/USD hit a peak of ,044.76 today, following a low at ,563.88 earlier in the session.
Today’s move led to bitcoin remaining close to a three-week high at ,473, which was marginally below a ceiling at ,500.
Looking at the chart, Tuesday’s rebound comes as the relative strength index (RSI) remained above a floor at 53.00
At the time of writing, the index is now tracking at 54.29, with a ceiling of 57.00 still a possible target for current bulls.
As the session has progressed, earlier gains have somewhat slipped, as market uncertainty remains high.
Ethereum
Ethereum (ETH) was relatively more stable during today’s session, remaining above ,900 for the majority of the day.
Following a low of ,879.08 on Tuesday, ETH/USD raced to an intraday high of ,916.57, as the session matured.
Similar to BTC, this move saw ethereum continue to track close to its strongest point since May 8.
An upwards crossover of the 10-day (red) and 25-day (blue) moving averages has already occurred, which could likely entice further bulls to reenter the market.
In the event this happens, a ceiling at ,930 will be one of the last points of resistance preventing a move above ,000.
Register your email here to get weekly price analysis updates sent to your inbox:
Could we see ethereum & bitcoin make significant gains in June? Leave your thoughts in the comments below.