 Five days ago, the total value locked (TVL) in decentralized finance (defi) protocols exceeded the billion mark, and since that point, it has expanded by an additional .66 billion. As it hovers above the billion threshold, the TVL is approaching the 0 billion milestone, a figure not observed since before the collapse of […]
Bitcoin News
Speculation and Price Models Fuel Bitcoin Bull Market Predictions Amidst Rising Optimism
 This week, bitcoin’s value ascended to the vicinity of ,000, leading to a widespread belief among observers that the bullish trend has officially commenced. Speculation centers on the exact moment this upward trajectory began, given that bitcoin has appreciated by 46% since the start of the year and 139% over the previous six months in […]
Bitcoin News
Bitcoin ETF Breaks Records: BlackRock’s IBIT Joins Elite ‘$10 Billion Club’ Amidst Soaring Demand
The demand for spot Bitcoin exchange-traded funds (ETFs) has surged since their recent approval on January 10, with BlackRock’s IBIT Bitcoin ETF leading the way. This ETF has reached impressive milestones in less than two months, attracting significant investor interest and opening doors for various market participants to invest in the largest cryptocurrency directly.
As institutional and retail investors flock to these new investment vehicles, market experts predict a bullish trend and anticipate a potential price surge.
Bitcoin ETF Frenzy
According to Bloomberg ETF expert Eric Balchunas, BlackRock’s IBIT Bitcoin ETF has quickly joined the esteemed “ billion club,” reaching the milestone faster than any other ETF, including Grayscale’s Bitcoin Trust (GBTC), noting that only 152 ETFs out of 3,400 have crossed the threshold.
Balchunas notes that IBIT’s ascent to this club was primarily driven by significant inflows, which accounted for 78% of its assets under management (AUM). This reflects the growing appetite for Bitcoin exposure among investors seeking diversified and regulated investment options.
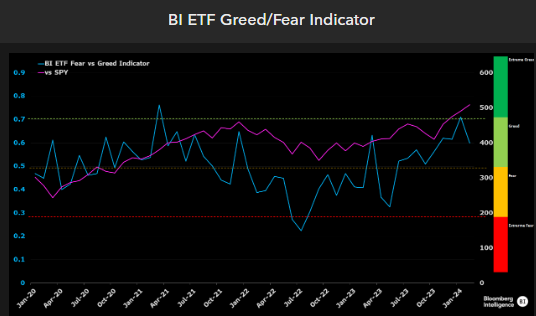
In particular, the current trajectory of the ETF market paints a picture of resilience and bullish sentiment in the market. Equity ETF flows, and leveraged trading levels are positive indicators, although they have not yet reached the euphoria seen in 2021, Balchunas notes.
However, Bloomberg’s new BI ETF Greed/Fear Indicator, which incorporates various inputs, highlights the optimistic outlook shared by ETF investors, as seen in the chart below.
On this matter, crypto analyst “On-Chain College” went to social media X (formerly Twitter) to emphasize the significant demand for Bitcoin as evidenced by its rapid departure from exchanges.
In its analysis, On-Chain College highlights that Bitcoin ETFs buy approximately ten times the daily amount of BTC mined. At the same time, the upcoming halving event will further reduce the mining supply. The analyst predicts when demand will exceed available supply, leading to potential upward price pressure.
Highest Monthly Close Since 2021
Bitcoin’s recent market performance has caught the attention of wealth manager Caleb Franzen, who highlights the significance of the highest monthly close since October 2021.
Franzen further emphasizes the bullish momentum by pointing out that the 36-month Williams%R Oscillator has closed above the overbought level for only the fourth time in history. Historical data reveals impressive returns following such signals, indicating the potential for substantial gains in the coming months.
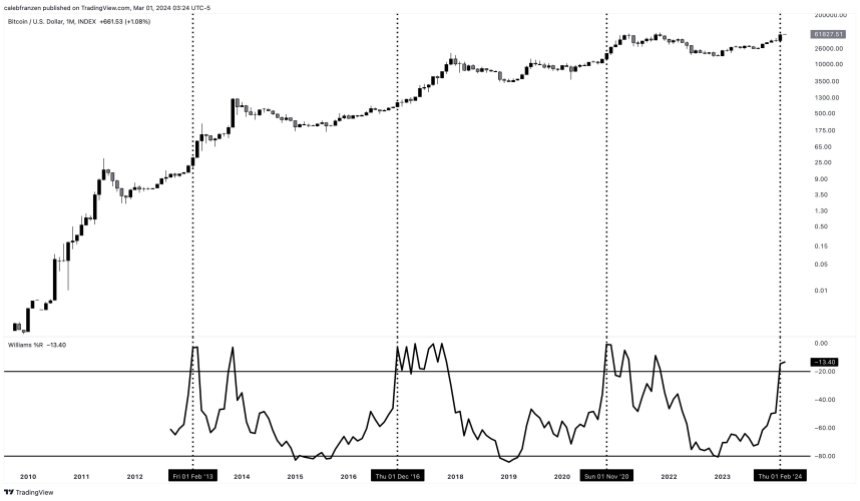
Additionally, Franzen notes the changing dynamics of the market, with increased institutional participation and the ease of retail onboarding through ETFs.
Franzen presents a compelling case for the bullish nature of overbought signals, urging market participants to view them as momentum indicators rather than signals to fade. Previous instances of overbought signals have resulted in significant Bitcoin price appreciation:
- February 2013: +3,900% in 9 months
- December 2016: +1,900% in 12 months
- November 2020: +260% in 12 months
While acknowledging diminishing returns in each cycle, Franzen highlights the unprecedented level of institutional participation and the ease of retail access through ETFs.
Even if Bitcoin were to match the +260% gain from the November 2020 signal, it would reach a price of 0,000, surpassing Franzen’s minimum cycle target of 5,000.
Ultimately, Franzen notes that bull markets are typically characterized by a rising ETHBTC ratio and a falling BTC.D (Bitcoin dominance). While these characteristics have yet to manifest fully, Franzen suggests that a multi-quarter rally in the broader cryptocurrency market may be on the horizon.
Featured image from Shutterstock, chart from TradingView.com
Bitcoin Technical Analysis: BTC’s Bullish Rise Continues Amidst Market Optimism
 Over the past hour, as bitcoin’s value swings from ,150 to ,545 on March 1, 2024, the cryptocurrency market is experiencing a pronounced upward trend. With a trading volume of .41 billion over 24 hours and a market cap touching .21 trillion, bitcoin’s dominance in the market is clear. Technical indicators, including oscillators and moving […]
Bitcoin News
Amidst a Surge in Spot Bitcoin ETF Reserves, Kraken Institutional Enters the Market
 The crypto exchange based in San Francisco, Kraken, has unveiled its latest offering, Kraken Institutional, a digital currency suite designed expressly for high-net-worth firms and institutional investors. Deep Liquidity and Low-Latency Trading: Kraken Institutional’s Promise to Elite Clients This new crypto service, Kraken Institutional, introduced by Tim Ogilvie, the global head of the business division, […]
Bitcoin News
Apecoin Climbs To 6-Month High Amidst Whales’ Strategic Moves
Apecoin (APE) is experiencing a rollercoaster ride in 2024. After plummeting to an all-time low of .01 in October 2023, the Bored Ape Yacht Club governance token has experienced a dramatic turnaround, buoyed by strategic whale buying and a recent partnership with the Arbitrum network.
However, with a 13% pullback in the past two days and lingering profit-taking concerns, questions remain about whether the bulls can defend key support levels and push the price back towards its former glory.
At the time of writing, APE was flashing green, trading at .73, which is a 0.6% and 7.5% increase in the 24-hour and weekly timeframes, data from Coingecko shows.
Riding The Arbitrum Wave
The turning point came on February 16th, when the Apecoin DAO voted to launch ApeChain, a dedicated blockchain, on the Arbitrum network. This partnership, aimed at tackling scalability issues and fostering ecosystem growth, sparked a 21% surge in APE price, pushing it to a six-month high of .90.
Whales Hold Firm, Retail Cashes Out
On-chain data paints a fascinating picture of contrasting investor behavior. While retail investors and swing traders were quick to lock in profits after the rally, “whales” – those holding at least 10 million APE tokens – have displayed unwavering confidence.
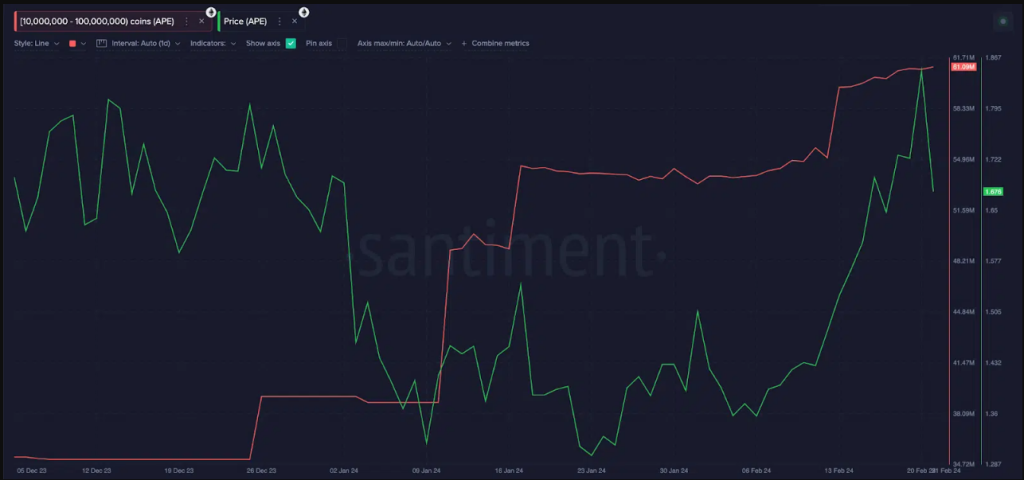
Since January 1st, these large investors have acquired an additional 22 million APE tokens, representing a staggering million investment and bringing their total holdings to 61 million APE. This unwavering conviction suggests long-term optimism in the project’s potential.
Can The Bulls Hold The Line?
Despite the bullish whale activity, a recent pullback has cast a shadow on the optimistic outlook. The price dipped 13% in the past two days, testing the crucial .50 support level. A breach of this support could trigger further decline towards . However, a large buying cluster at .50, representing 9,630 investors who purchased APE at that price, could act as a significant barrier to a deeper fall.
Eyes On , But Hurdles Remain
Technical analysis and market sentiment suggest a potential early rebound towards in the coming weeks. However, this hinges on two key factors: defending the .50 support and overcoming further profit-taking waves. Additionally, broader positive developments in the NFT sector could provide tailwinds for APE price.
Looking Beyond The Immediate
Congratulations to @apecoin DAO on its decision to develop ApeChain utilizing the Arbitrum tech stack!
With $APE serving as both the gas and governance token for ApeChain, Arbitrum Orbit’s customizability empowers @ApeCoin DAO with true ownership and control over this…
— Offchain Labs (@OffchainLabs) February 15, 2024
While the Arbitrum partnership and whale support are encouraging, several hurdles remain. The broader macroeconomic climate, still grappling with inflation and interest rate concerns, could impact investor sentiment across the cryptocurrency market. Moreover, the success of ApeChain itself remains to be seen, and any unforeseen challenges could dampen enthusiasm.
With a potential mark tantalizingly close, Apecoin faces a critical juncture. Whether the bulls can overcome the immediate hurdles and propel the token to new heights, or if profit-taking and broader market headwinds prevail, remains to be seen.
Featured image from Pexels, chart from TradingView
Bitcoin’s Price Soars Past $48K, Nears $1 Trillion Market Cap Amidst Bullish Momentum
 On Saturday, Feb. 10, 2024, bitcoin’s price soared beyond the K mark, reaching heights unseen since prior to Dec. 28, 2021. On Sunday, the leading digital currency maintained its robust momentum, consistently staying above the newly established price level. Over the last 24 hours, the crypto asset’s value has risen by over 2.6%, and it […]
Bitcoin News
Dragon Year Awakening — Bitcoin Proponents Eye Bull Market Surge Amidst Zodiac Predictions
 As we usher in the Year of the Dragon this coming weekend on Feb. 10, 2024, per the Chinese zodiac, a significant swath of cryptocurrency enthusiasts are optimistic that bitcoin is on the cusp of a substantial bull market. This optimism is rooted in the Dragon year’s traditional association with prosperity, formidable strength, and dominion. […]
Bitcoin News
Bitcoin Technical Analysis: BTC Resilience Maintains Amidst a Balanced Crypto Market

Bitcoin’s price continues to demonstrate resilience in the face of market fluctuations, settling at ,902 to ,091 within the last hour, with a modest uptick of 0.4% in the last 24 hours. This week’s growth of 0.7%, coupled with a 6.8% increase over the past two weeks, highlights the ongoing range-bound dynamics within the crypto market.
Bitcoin
Bitcoin (BTC) continues to exhibit a pattern of consolidation with subdued activity over the last week. BTC’s consolidation phase is marginally upward trending, as its price endeavors to surpass ,500, signaling a consolidation above the 50-day moving average. Concurrently, a closer examination through moving averages and oscillators offers a detailed perspective.
The technical oscillators present a mixed sentiment, with the relative strength index (RSI) at 53 indicating a neutral and balanced market. However, the momentum oscillator suggests bearish action, contrasting with the moving average convergence/divergence (MACD) level’s bullish signal, highlighting the market’s current indecision and the complexity of predicting short-term movements.
The moving averages (MAs) paint a predominantly positive picture, with the majority of time frames signaling bullish sentiment, particularly the exponential moving average (EMA) over various time frames. This suggests underlying strength in the market at certain resistance levels, despite recent price fluctuations.
The daily chart offers a broader perspective, showcasing a consolidation phase with foundational support at approximately ,505 and heavy resistance near the ,048 peak that occurred on Jan. 11. This phase indicates a market in search of direction, with potential for either a bullish breakout or bearish downturn based on upcoming market dynamics.
The 4-hour chart reveals increased volatility within the consolidation range, suggesting a tug-of-war between BTC’s buyers and sellers. The presence of significant volume on the downturns could indicate a leaning towards selling pressure, though the market remains in a state of flux and consolidation.
In the shortest time frame, a slight downtrend is observable, with the price making lower highs. This micro-view underscores the immediate challenges bitcoin (BTC) faces in breaking through the short-term resistance levels, specifically above the ,500 range.
Bull Verdict:
Given the steady upward trend in bitcoin’s price over the past weeks, combined with strong market capitalization and bullish signals from moving averages, the outlook remains optimistic. The resilience in price and investor confidence suggests potential for further BTC gains. Continued monitoring of market sentiment and economic indicators will be key, but the current trajectory favors a bullish perspective for bitcoin’s near future.
Bear Verdict:
Despite some positive indicators, the mixed signals from technical oscillators and the presence of volatility in shorter time frames caution against overly optimistic projections. The potential for downward pressure, highlighted by bearish signals and immediate challenges in breaking through resistance levels, suggests a downturn may not be far off. Traders should prepare for possible corrections, particularly if broader crypto market sentiment shifts or if key support levels fail to hold.
Register your email here to get weekly price analysis updates sent to your inbox:
What do you think about bitcoin’s market action on Wednesday? Share your thoughts and opinions about this subject in the comments section below.
Bitcoin Technical Analysis: BTC’s Price Resilience Holds Steady Amidst Market Fluctuations

On Friday, the price of bitcoin fluctuated within a daily span from ,937 to ,347, with its market value reaching 6 billion. The trading activity for the day tallied up to .35 billion, showcasing a spike in investor involvement and market liquidity, which tends to diminish as the weekend approaches.
Bitcoin
The current sentiment towards bitcoin (BTC) is remarkably balanced, with a sentiment score of 54. This equilibrium reflects a cautious optimism among investors, straddling the line between bullish and bearish expectations according to technical analysis. This mood is underscored by recent variations in the Crypto Fear and Greed Index (CFGI), which has oscillated sharply, lately hitting levels that signify “greed” and then back to “neutral.”

The relative strength index (RSI) holds at a neutral point of 54, mirroring the sentiment portrayed by other market oscillators like the Stochastic and commodity channel index (CCI), which signal mixed feelings among market participants. Interestingly, the awesome oscillator hints at a bullish outlook, whereas the momentum Indicator suggests bearish tendencies, highlighting the market’s polarized sentiment.
Moving averages (MAs) across different time frames consistently suggest bullish prospects, with both simple and exponential moving averages (SMA and EMA) ascending from the 10-day through to the 200-day marker. This pattern indicates solid support for bitcoin’s current valuation, despite the day’s price swings. The daily chart accentuates a notable price dip following the approval of spot bitcoin exchange-traded funds (ETFs), succeeded by a large downturn and a subsequent effort to rebound.
Heavy resistance has been identified near ,000, with prices currently fluctuating between ,000 and ,800, signaling a tentative recovery phase absent of definitive signs of a trend reversal. The hourly chart shows reduced volatility with a slight upward trajectory, whereas the 4-hour chart offers a more consolidated perspective, displaying a mild upward trend. These resistance levels present potential short-term trading strategies hinging on breakout or reversal patterns.
Bull Verdict:
The analysis of bitcoin’s performance on Feb. 2, 2024, underlines resilience amidst market volatility. The observed price recovery, coupled with decent trading volume, highlights investor confidence and continued liquidity in the market. With MAs across all periods signaling a bullish trend and the awesome oscillator pointing towards a bull signal, BTC demonstrates a solid foundation for price growth. The neutral stance from the RSI, tempered by positive momentum in the hourly and 4-hour charts, suggests an underlying strength in bitcoin’s market position.
Bear Verdict:
Despite bitcoin’s show of resilience on Feb. 2, 2024, several indicators hint at an underlying market caution. The significant price drop highlighted in the daily chart, followed by a hesitant recovery, suggests vulnerability to more sell-offs and the absence of a definitive bullish reversal. Mixed signals from oscillators, particularly the contrasting sell signal from the momentum indicator, reflect investor uncertainty and a divided market sentiment. The neutral RSI, coupled with resistance levels that capped the day’s gains, underscores the challenges ahead for BTC.
Register your email here to get weekly price analysis updates sent to your inbox:
What do you think about bitcoin’s market action on Friday? Share your thoughts and opinions about this subject in the comments section below.