 The Ethereum-based memecoin Pepe (PEPE) experienced a significant price surge of 40% since Monday to a new all-time high, fueled by the speculation that the U.S. SEC might approve spot ether exchange-traded funds (ETFs). Crypto traders and analysts, observing the movement between ether’s price rise and PEPE’s surge, speculate further growth for PEPE, reflecting the […]
Bitcoin News
XRP Wallets Holding At Least 1 Million Coins Nears All-Time High As Sentiment Improves
With the crypto market on the rise once again, XRP has seen positive headwinds and this has triggered an improvement in sentiment among investors. This positive recovery has seen more crypto investors move to acquire the altcoin, pushing a very important holder cohort toward new all-time high levels.
Wallets Holding More Than 1 Million XRP Nears ATH
Over the last year, there has been a lot of selling among XRP investors as the price continued to struggle. This poor performance continued despite Ripple securing multiple partial victories against the United States Securities and Exchange Commission (SEC), prompting investors to jump ship.
One XRP holder cohort that witnessed a lot of selling is the addresses holding at least 1 million XRP tokens. At current prices, it would mean that these wallets are holding at least 0,000 on the lower end of the cohort, making this the cohort that includes the dolphins and whales.
The number of addresses holding at least 1 million tokens had hit its all-time high back in June 2023. But with the price falling, these large holders began to sell, and at one point, the number of wallets sat around 50 wallets below its all-time high of 2,014.
However, with the crypto market moving toward another bull market, expectations are that the price of XRP will follow the rest of the market, prompting large investors to return. Data from Santiment, an on-chain data aggregation platform, shows that over the course of 2024, the number of wallets holding 1 million tokens or more rose steadily and by April, this figure is now sitting at 2,013, one wallet away from reaching its previous all-time high, and two wallets away from setting a new record.
Why Are Large Investors Returning?
One reason why large investors are returning to XRP could be that the indicators are finally turning bullish for the altcoin. There was also an opportunity for these investors to buy the tokens for cheap when the market crashed and altcoins like XRP suffered almost 40% losses.
Related Reading: 3 Major Metrics To Watch Out For That Can Impact Ethereum Prices
Popular crypto analyst TonyTheBull took to X (formerly Twitter) to reveal the significance of this price crash. According to the analyst, it was the final capitulation shakeout for the altcoin. Comparing it to a similar shakeout in 2017 shows that after this, XRP could go on a massive rally.
No, this was the final capitulation shakeout in $XRP https://t.co/Z0uQ2GhS7v pic.twitter.com/qfWC6H8DNv
— Tony “The Bull” Severino, CMT (@tonythebullBTC) April 23, 2024
The large investors could be expecting this rally as well, hence, why they have been buying up large amounts of coins. If the 2017 rally is anything to go by, then the XRP price could quickly barrel through , printing significant returns for investors.
Toncoin Defies Market Turmoil, Surges 25% To Tally All-Time High – Details
Toncoin (TON) has defied recent market turbulence, reaching a new milestone with its price surging to an all-time high of .0. This nearly 25% increase has propelled Toncoin to become the eighth largest cryptocurrency by market cap, surpassing Dogecoin (DOGE) with a market cap of nearly billion.
Toncoin: Powered By Strategic Partnership
Toncoin’s recent momentum can be attributed in part to its partnership with HashKey, which has bolstered investor confidence. Since March, Toncoin has sustained considerable momentum, witnessing a surge of approximately 35% in the past week and a remarkable 136% increase over the past month.
Technical Indicators Signal Potential Growth
Technical analysis indicates a bullish trajectory for Toncoin, with its price following an ascending channel pattern. Despite brief downward movements, strong buying activity near the support line suggests resilience among investors.
Analysts predict a potential breakthrough of the .50 resistance line, potentially paving the way for a rally towards . Both moving averages are trending upwards, and the Relative Strength Index (RSI) remains positive, signaling favorable conditions for buyers.
Toncoin has had a significant and rapid increase in value since the beginning of the year. The year-to-date (YTD) growth of this entity stands at 205%, surpassing the growth of Bitcoin (BTC) which is recorded at 57%.
Catalysts Behind TON’s Growth
There are numerous driving forces behind Toncoin’s explosive growth. Its distinct technology aids in the scalability of decentralized services constructed upon it, and its tight relationship with Telegram serves as an additional catalyst for its expansion.
All told, the Toncoin ecosystem is home to a large number of aspirational users who have contributed to the development of a tight-knit community that powers and encourages network innovations.
Telegram’s Influence Adds Momentum
The influence of messaging app Telegram has also contributed to Toncoin’s momentum. Rumors of Telegram’s impending IPO and plans to integrate Toncoin into its platform have heightened investor optimism.
Telegram’s CEO, Pavel Durov, recently disclosed the company’s receipt of offers totaling billion, further fueling excitement. Additionally, Telegram’s decision to introduce advertisements within its channels, with rewards distributed in Toncoin, underscores the platform’s commitment to cryptocurrency integration.
Toncoin’s surge represents a significant development in the cryptocurrency landscape. As the cryptocurrency continues to challenge established players and forge strategic partnerships, investors are reminded of the inherent volatility in the market.
Even though Toncoin’s present path looks good, it is still important to be careful with risks. As people keep an eye on what’s going on, Toncoin’s path to continued growth stays a central issue in the world of digital assets, which is always changing.
Featured image from Pexels, chart from TradingView
SUI Slips After Hitting All-Time High: TVL Tumbles 12% – Token Price In The Gutter?
The burgeoning world of Decentralized Finance (DeFi) has witnessed a rollercoaster ride for newcomer Sui, a Layer 1 blockchain designed to scale DeFi applications. After a stellar start to 2024, Sui’s Total Value Locked (TVL) – a metric reflecting the total value of crypto assets deposited in its DeFi protocols – surged to a record 4 million in late March. However, this celebratory moment proved fleeting, as the platform has since experienced a downward trend.
SUI TVL Takes A Tumble
Despite the recent decline, Sui’s TVL currently sits at a healthy 4 million, according to DeFiLlama. This translates to a 12% drop from its peak, showcasing a correction following its initial surge. However, it’s important to note that Sui remains in a positive light compared to some established players.
Silver Linings For Sui
While the recent dip might raise concerns, Sui boasts a more optimistic outlook when considering a broader timeframe. Compared to its New Year’s Day value, the current TVL represents a significant 25.5% increase.
This upward trajectory extends further back, with a staggering 68% growth since the beginning of the year. This impressive background performance fuels optimism for Sui’s potential to regain its momentum, potentially propelling it towards a coveted spot amongst the top 10 DeFi chains.
SUI Token Mirrors Market Trends
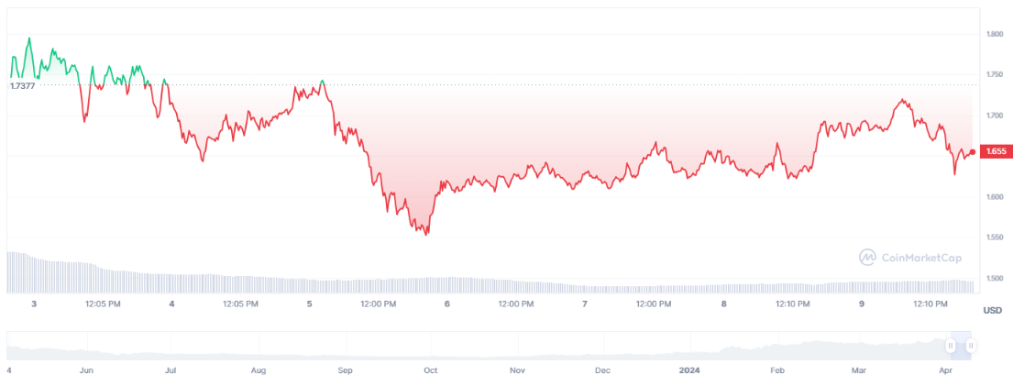
The price of Sui’s native token (SUI) reflects a similar pattern to its TVL. Currently trading at .65, SUI has shed nearly 30% of its value compared to its all-time high of .20 reached in late March. Despite the recent slump, SUI has managed a modest 2% daily increase. However, zooming out reveals a 11% loss over the past week.
Can Sui Recover its DeFi Mojo?
Regaining the lost TVL will be a key test for Sui’s development team. Identifying the reasons behind the user exodus is essential. Were there any security concerns or technical glitches that caused users to pull their funds? Transparency and addressing these issues head-on will be critical for rebuilding user confidence.
Related Reading: Filecoin Bull Run On The Horizon? Analyst Sees 250% Surge
Building A Thriving DEX Ecosystem Is Vital
Meanwhile, a vibrant DEX ecosystem is another pillar for Sui’s future. Decentralized Exchanges allow users to trade cryptocurrencies directly with each other, without the need for a centralized intermediary.
Fostering a healthy DEX landscape will attract more users and liquidity to the Sui blockchain, ultimately boosting its TVL. Enticing established DEX protocols to migrate to Sui or supporting the development of native DEX solutions could be effective strategies.
Featured image from Pixabay, chart from TradingView
W Token’s Rollercoaster Day: From $1.25 Low to $1.66 All-Time High
 Following Ethena’s ENA airdrop, the community has shifted its focus on Wormhole’s airdrop W, which has been listed on various centralized exchange platforms and coin market cap aggregators. The new token known as W has seen an extremely volatile day with the price tapping an all-time high at .66 per coin. Wormhole’s New Airdrop W […]
Bitcoin News
Brace For Market Impact: Ethereum Open Interest Has Reached A New All-Time High
Ethereum has, for the most part, established a foothold above the ,500 price level throughout the week as investors continue to anticipate a return to the ,000 mark. Interestingly, the optimism has seen the open interest of Ethereum surging to new highs. The surge in open interest, although a bullish sentiment indicator, can also serve as a bearish signal of an impending change in market trend.
Ultimately, this metric added to the current dynamics of the Ethereum ecosystem, including regulatory uncertainty and scalability concerns hinting at a complicated price trajectory for the price of Ethereum.
Ethereum Open Interest Reaches New High
Open interest is an efficient method for tracking the total number of open positions in a particular contract. Recent market dynamics and institutional investor interest have seen the total open interest in Ethereum futures surging above records set in the 2021 bull market phase.
According to data from Coinglass, the open interest on Ethereum futures, which has been on a surge since February 5, recently set a new high of .11 billion on March 15. This wasn’t particularly surprising, as a strong buying momentum from the bulls in the prior days saw the price of Ethereum surging past the ,000 mark for the first time in two years.
However, Ethereum has since reversed from the ,000 price level and is currently trading below ,600. On the other hand, the total open interest on Ethereum contracts has maintained around its all-time high level, which allowed it to cross over .10 billion again on March 28. The open interest weighted average also went up to 0.0462%, indicating an increase in the demand for leveraged ETH long positions.
The majority (.55 billion) in the Ethereum futures market were registered on cryptocurrency exchange Binance. Bybit and OKX came in second and third, with .39 billion and .94 billion respectively. Interestingly, CME’s Ether futures also surged to .3 billion. At the time of writing, the CME’s Ether futures now sit at .31 billion, reiterating the committed bullishness among institutional investors.
What’s Next For ETH?
Ethereum has been trading flat since the beginning of the week and is currently on a 0.78% gain in the past seven days. All eyes are now on reports of the SEC looking into Ethereum’s security status, the industry awaits an official ruling similar to the one that was handed down in the XRP case that will finally provide clarity to the regulatory landscape.
At the same time, investors continue to await the SEC’s decision regarding the applications of Spot Ethereum exchange-traded fund (ETF) in the US. According to a Bloomberg senior analyst, the likelihood of approval is only 25%.
Breaking Records: Mantle (MNT) Soars 40% In One Day To New All-Time Highs, Next Target Revealed
Layer 2 (L2) blockchain Mantle (MNT) has demonstrated remarkable performance, surpassing most of the top 100 cryptocurrencies in the market. The token has surged by 40% in the past 24 hours, reaching a new all-time high (ATH) of .49.
Mantle Network’s Layer 2 Solution
Mantle Network operates as an Ethereum Virtual Machine (EVM)-compatible L2 scaling solution to provide a deeper understanding of the protocol. It leverages Optimistic rollups to enable fast and cost-effective transactions.
The unique aspect of Mantle lies in its modular design, which combines Optimistic rollups with a separate data availability layer. Unlike traditional blockchains, Mantle’s approach involves handling the four key blockchain functions on different layers.
Mantle’s transaction execution function occurs on its EVM-compatible execution settlement layer. Blocks are generated on the L2 execution layer by Mantle’s sequencer, which then submits state root data to the Ethereum mainnet.
This architecture significantly reduces transaction costs compared to the base layer and improves network efficiency by separating the layers. Additionally, the implementation of Optimistic rollups minimizes the overall load on nodes.
MNT Surges As Staking Launches
One of the potential catalysts behind the recent surge in MNT can be attributed to the introduction of MNT staking, as highlighted by crypto researcher Alex Wacy.
According to Wacy, the Mantle Rewards Station plays a key role in this staking initiative, offering rewards to MNT stakers from the Mantle Ecosystem. By participating in staking, users contribute to the network’s security and operations while also being incentivized through these rewards.
The staking process begins with the Ethena event, where users receive mShards tokens. These tokens have value within the Mantle decentralized finance (DeFi) ecosystem, allowing users to perform various decentralized finance activities within the network. These activities may include trading, investing, or interacting with various DeFi protocols and applications built on top of Mantle.
In particular, mShards can be traded within the Mantle decentralized application (dApp) ecosystem, allowing users to take advantage of potential market growth options. The ability to trade these tokens increases liquidity and fosters an active ecosystem within Mantle.
In addition, the researcher notes that mShard token holders will soon be able to redeem for ENA, another token associated with the Mantle Ecosystem. This redemption process adds utility and value to mShards, further increasing their appeal to token holders.
The issuance of Ethena shards for Epoch 2 will end on April 1, indicating a limited-time opportunity for users to acquire these shards through staking, which may have further increased interest in the blockchain ahead of the deadline from investors looking to capitalize on this opportunity.
Bullish Prospects
Examining the figures, MNT has experienced a surge in trading volume, reaching 7,118,249 in the past 24 hours, signifying a substantial 141.40% increase compared to the previous day.
The market capitalization of the MNT token stands at ,157,261,742, propelling it to the 33rd position on CoinGecko’s rankings. Over the past 7 days, Mantle (MNT) has outperformed the global cryptocurrency market, which has seen a 2.30% increase, and similar cryptocurrencies within the Ethereum ecosystem have risen by 12.70%.
The MNT token has retraced to the .27 level, marking a 2% decline in price over the past hour. Despite the temporary setback, the token’s strong momentum suggests potential trading risks and opportunities. It is worth noting that the next identified support line for the token is at the .080 level.
If this support level fails to hold, the token’s price could drop further, potentially reaching the mark. The next significant resistance level would be at .94.
However, if the bullish momentum continues throughout the week, the token may target the .60 and .68 levels before potentially surging towards the mark.
Featured image from Shutterstock, chart from TradingView.com
Bitcoin “Liquid Inventory Ratio” Hits All-Time Low, What It Means
On-chain data shows the Bitcoin “Liquid Inventory Ratio” has dropped to an all-time low. Here’s what this could mean for the asset.
Bitcoin Sell Side Liquidity Is Low Relative To Demand Right Now
In a post on X, CryptoQuant founder and CEO Ki Young Ju discussed the recent trend in the Liquid Inventory Ratio for Bitcoin. The Liquid Inventory Ratio is an on-chain indicator that tells us about how the total sell-side liquidity inventory of the asset compares against its demand.
The sell-side liquidity inventory of the asset is gauged using four factors: the total exchange reserve, miner holdings, OTC desk holdings, and US government-seized BTC.
Out of these, the exchange reserve (that is, the total amount sitting in the wallets of centralized exchanges) is the largest potential source of sell-side liquidity.
The chart on the right below shows how the sell-side liquidity inventory of the coin has changed over the last few years:
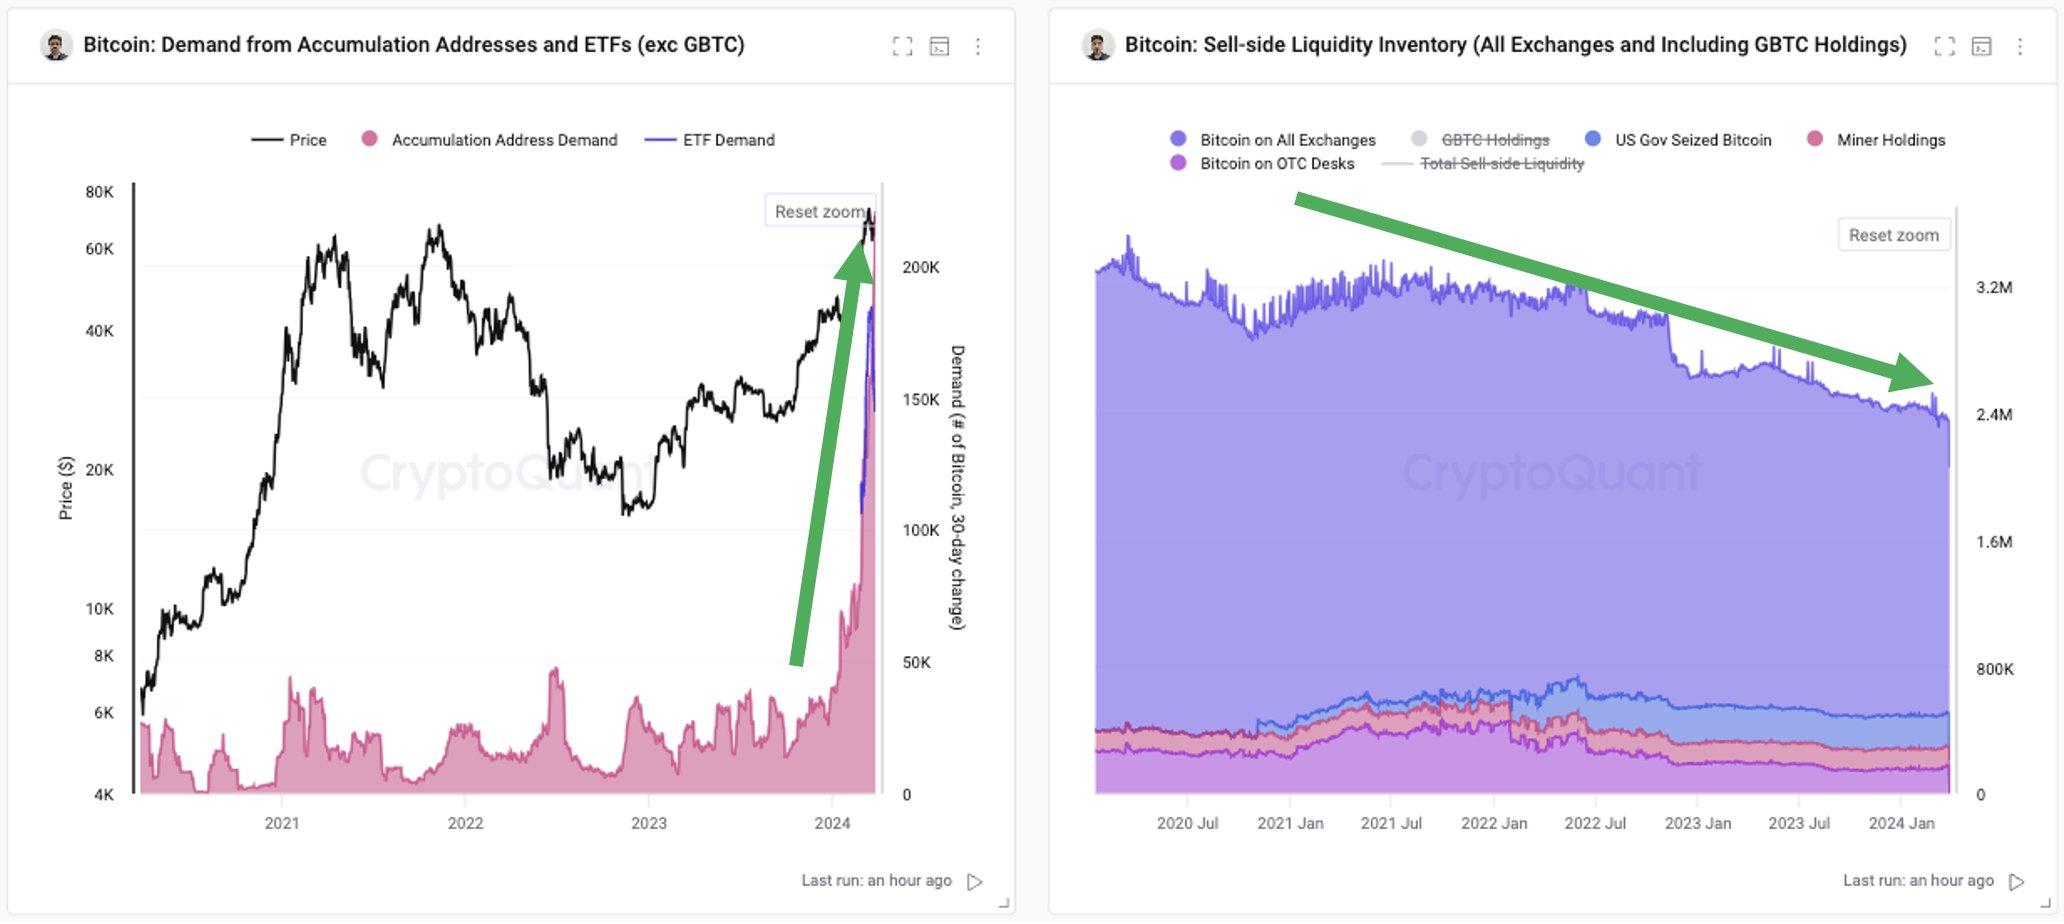
From the graph, it’s visible that the sell-side liquidity of the cryptocurrency has been heading down for a while now. This decline is mostly driven by the depletion of exchange reserves, as investors have been continuously pushing towards self-custody, possibly preferring to hold onto their Bitcoin for extended periods.
The chart on the left displays the trend in the total demand for the asset. Here, the demand is measured using the 30-day balance changes of “accumulation addresses.”
The accumulation addresses are those that have a history of only buying BTC and no history of selling. Exchanges and miner entities are excluded from this cohort, of course, as they count under the sell-side liquidity instead, regardless of whether they satisfy the condition for accumulation addresses or not.
Clearly, the demand for Bitcoin has exploded recently as new players like exchange-traded funds (ETFs) have entered into the arena. All this BTC is potentially going out of circulation and being locked into the wallets known for hosting a one-way traffic.
Given these two developments in the sell-side liquidity inventory and demand, it’s not surprising to see that the Liquid Inventory Ratio, which measures the ratio between the two, has plunged recently.
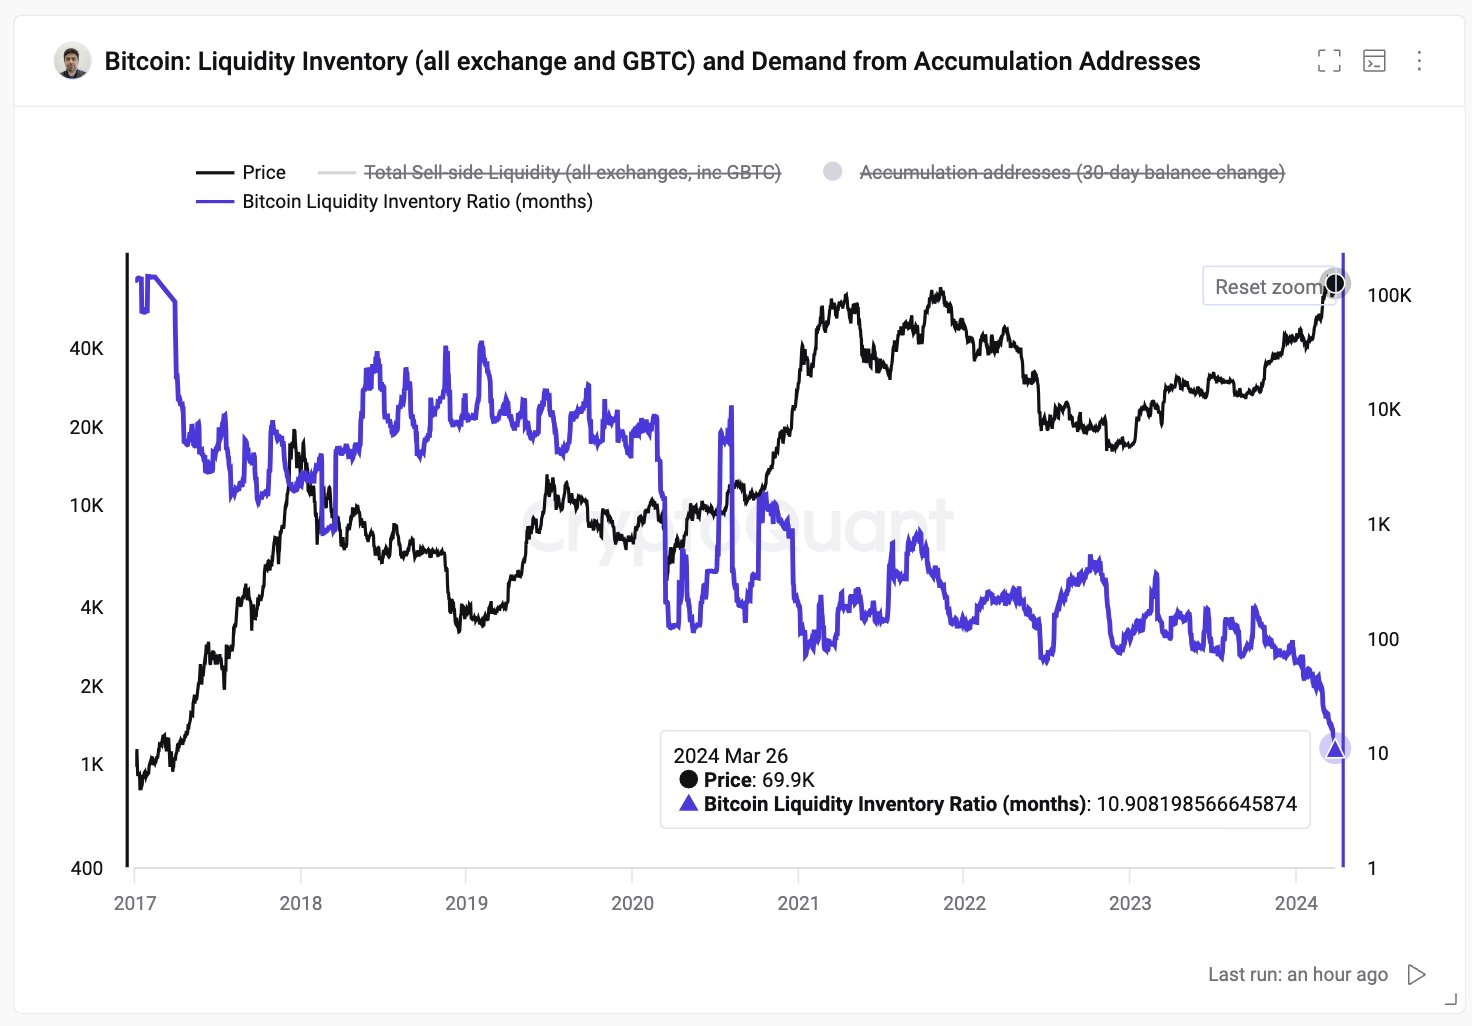
Following the latest decline in the indicator, its value has, in fact, dropped to a new all-time low. This means that the sell-side liquidity has never been this low when compared to the demand for Bitcoin.
Given this trend, it will be interesting to see how the BTC rally plays out from here, as the supply available to buy is only continuing to tighten.
BTC Price
Bitcoin had seen some drawdown earlier, but bullish winds have seemingly returned for the coin as its price has now recovered back above ,200.
Aptos (APT) Surges 94% And Approaches All-Time Highs: Will It Break The $20 Barrier?
Layer 1 (L1) blockchain platform Aptos has experienced a significant surge in key metrics, accompanied by a 12% price rally of its native token APT within the past 24 hours. On Tuesday, the token’s price approached its all-time high (ATH) level of ,92, reaching above .
APT Eyes Milestone
Despite the recent price correction across the broader cryptocurrency market, Aptos’ APT token has been on an impressive uptrend since early March. Over the past 30 days, the token has surged by more than 94%, showcasing its strong performance.
Aptos has also gained recognition in crypto, climbing to the 23rd position among the largest cryptocurrencies by market capitalization. Currently valued at .3 billion, the token has experienced a substantial increase from the billion recorded at the beginning of the month.
The trading volume of Aptos (APT) has seen a significant surge, reaching 2,531,437 in the last 24 hours, a notable 90.70% increase from the previous day, according to CoinGecko data.
Analyzing the daily APT/USD chart, no significant resistance levels are observed, indicating that reaching the milestone may be within reach, which would mark a new all-time high for the token.
The sustainability of the bullish momentum and the ability of investors to hold on to their gains will play a key role in determining the coin’s future performance. Nevertheless, a possible retest of the next support level at .36 cannot be ruled out in the event of profit-taking and selling pressure.
If the .36 support level fails to hold, the next significant support level for APT is at .31. However, it is important to note that APT’s bullish structure remains intact as long as the .14 support level remains unbroken, suggesting that the bulls currently have the upper hand as long as a sharp 30% decline does not occur.
Aptos Attracts 11 Million Tokenholders In 30 Days
Coupled with the increase in the price of its native token, Aptos has seen significant growth in key metrics over the past 30 days. According to Token Terminal data, token holders have grown significantly, increasing by 3.4% to 11.79 million individuals over the past 30 days.
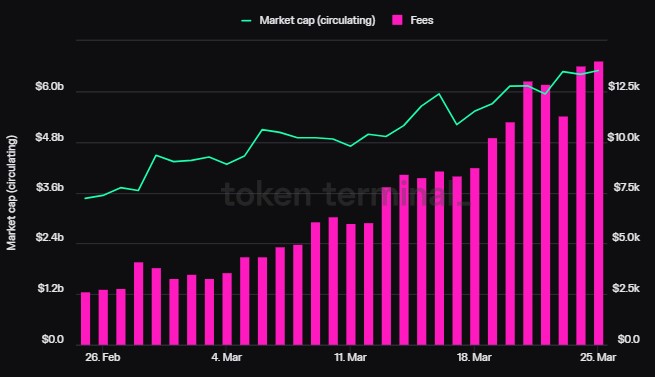
In terms of fees generated, Aptos has seen a notable uptick. Over the past 30 days, fees generated were 9.16 thousand, representing a growth rate of 87.8%. Annualized fees reached .54 million, a slight increase of 0.2%.
In a longer time frame, the Aptos token’s trading volume has experienced significant expansion, reaching .82 billion over the past 30 days, indicating a significant increase of 178.2%.
Featured image from Shutterstock, chart from TradingView.com
Bitcoin ‘Real Pump’ Nears New All-Time Highs, Analyst Says
Bitcoin, the ever-enigmatic digital currency, has analysts locked in a heated debate about its 2024 price trajectory. Will it soar to new heights, fueled by institutional adoption and mainstream acceptance, or will it face a reality check and revisit recent lows?
Bullish Vs. Bearish Perspectives On Bitcoin
The optimists, led by the prominent crypto analyst Cryptoyoddha, paint a picture of a bullish future. They point to a meticulously tracked historical chart showcasing the cyclical price movements of Bitcoin.
Each cycle, Cryptoyoddha argues, follows a similar pattern: a period of accumulation followed by a parabolic surge. This analysis paves the way for the highly anticipated “Cycle IV,” which could propel Bitcoin beyond its current all-time high of ,750 and potentially reach a staggering 0,000 or even higher.
The real pump will start after the halving next month. pic.twitter.com/eV5FWkzkxX
— Yoddha (@CryptoYoddha) March 23, 2024
But what’s driving this bullish sentiment? Cryptoyoddha cites several factors: a surge in institutional investment, a shift towards clearer regulations for cryptocurrencies, and a growing public embrace of digital assets. These trends, coupled with the historical pattern of each cycle surpassing the previous one, paint a compelling picture for Bitcoin bulls.
However, not everyone is buying into the euphoria. Michaël van de Poppe, a renowned cryptocurrency trader, injects a dose of caution with his technical analysis. Studying charts that map Bitcoin’s price movements, van de Poppe detects a potentially bearish pattern following the recent price dip.
I wouldn’t be surprised if #Bitcoin eventually takes the liquidity below the lows.
Consolidation, low volatility. pic.twitter.com/CincO9DFjD
— Michaël van de Poppe (@CryptoMichNL) March 23, 2024
He interprets the ongoing period of consolidation – where the price fluctuates within a narrow range – as a potential precursor to a further price drop. This drop, he suggests, could see Bitcoin revisit and even break below its recent lows.
Van de Poppe’s analysis focuses on the presence of “support” and “resistance” levels on his charts. These levels represent price points where historical buying and selling activity has been concentrated. If Bitcoin falls below a key support level, it could trigger a wave of panic selling, pushing the price further down.
Volatility And Uncertainty
The contrasting viewpoints highlight the inherent volatility of the cryptocurrency market. Bitcoin’s price is constantly influenced by a complex web of factors, including unforeseen regulatory decisions, security breaches, and broader economic trends. While historical cycles can offer valuable insights, they are not crystal balls that guarantee future performance.
Investors also need to be wary of placing blind faith in technical analysis. The market is not a purely mechanical system, and unpredictable events can disrupt even the most meticulously drawn charts.
Despite the differing predictions, both analysts acknowledge the likelihood of significant price movement in the coming months. Cryptoyoddha’s bullish outlook hinges on a fundamental shift in the cryptocurrency landscape, while van de Poppe’s technical analysis suggests a potential short-term price correction.
Ultimately, the fate of Bitcoin’s price in 2024 remains a mystery. The upcoming Bitcoin halving in April – an event that cuts the number of new Bitcoins entering circulation and has historically coincided with price increases – adds another layer of intrigue.
Featured image from Pexels, chart from TradingView