 The Opentensor Foundation, the development team behind the Bittensor chain, has tackled a recent security breach affecting the network, impacting several community members. The foundation insisted that prompt actions were implemented to mitigate the attack and prevent future incidents. Malicious Package on PyPi Triggers Security Breach on Bittensor Chain On July 2, at 7:41 p.m. […]
Bitcoin News
Bullish Reversal For Bitcoin? Retail Investors Flood Back As New Addresses Reach 4-Month Peak
Recently, the price of Bitcoin (BTC) has entered a consolidation phase, fluctuating between ,000 and ,000 after a brief drop to ,000 on June 24. While retail investors have shown renewed interest alongside institutional counterparts, the market faces a mix of bullish signs and potential headwinds.
Retail Investors Return To Bitcoin
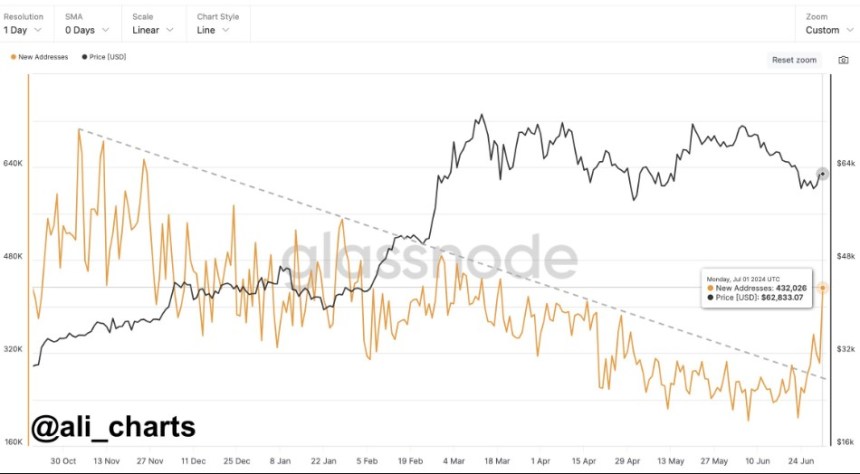
In a recent social media post, crypto analyst Ali Martinez highlights the resurgence of retail investors, as evidenced by a four-month high in new BTC addresses reaching 432,026, adding to the sentiment that investors are betting on a significant price increase for BTC in the coming months, despite recent price volatility.
In a separate post analyzing BTC’s recent price action, Martinez also suggested that the largest cryptocurrency on the market is currently confined within a parallel channel, with a potential rebound to ,200 or ,800 if the lower bound at ,500 holds.
In particular, Martinez cites the critical resistance areas of ,795 and ,700 as key targets if BTC breaks above them.
However, not all news is positive for the Bitcoin market. In the past 72 hours, BTC miners have sold over 2,300 BTC worth approximately 5 million. This selling pressure adds to the US and German governments’ ongoing sell-off of confiscated BTC.
Mining Industry Under Pressure
The mining industry faces challenges due to lower network fees and reduced block rewards resulting from the Halving event in April.
Kaiko Research notes that average network fees have decreased from to , a significant drop from around in January. The halving saw block rewards reduce from 6.25 BTC to 3.125 BTC, impacting miner revenue.
This revenue squeeze has put pressure on miners, eroding profitability while fixed expenses such as energy, wages, and rent remain constant. The decline in network fees has further contributed to the reduction in revenue.
Historically, Bitcoin price rallies following Halving events have helped miners compensate for the drop in rewards. However, the price of Bitcoin has remained relatively unchanged since the April 19 software update.
In April, fees briefly surged to nearly 0 due to the increased minting of non-fungible tokens (NFTs) on the BTC blockchain. Although this temporarily relieved miners, fees have since returned to average levels.
According to Bloomberg, Marathon Digital, one of the largest Bitcoin miners, sold 390 BTC in May and plans to sell more tokens to manage its finances.
Kaiko Research warns that the risk of forced selling by miners may persist in the coming months. As a result, the industry is expected to witness consolidation as miners seek to “consolidate assets” and “increase efficiency.”
Notable examples include miner Riot Blockchain’s “hostile takeover attempt” of Bitfarms Ltd. and CleanSpark Inc.’s recent agreement to acquire Griid Infrastructure Inc. for 5 million in an all-stock transaction.
At the time of writing, BTC is still consolidating within its range at ,880, down 2% in the 24-hour time frame, wiping out all gains in the past 30 days, as losses in this time frame amount to 9%.
Featured image from DALL-E, chart from TradingView.com
Bitcoin Remains Bullish As New BTC Addresses Surge To New 2-Month Highs
June was much rougher for Bitcoin than many expected at the beginning of the month. This is because the price of Bitcoin virtually declined throughout the month, leaving many investors, especially short-term holders, disappointed.
However, despite the price decline, on-chain data suggests that Bitcoin adoption is growing. New data shows the number of new Bitcoin addresses being created has surged to the highest level in two months. This growth suggests the long-term prospects for Bitcoin remain strong.
New BTC Addresses Surge To 2-Month High
Despite the price slump, the network is exhibiting a promising trend that signals future growth for the world’s largest cryptocurrency. According to Glassnode chart data initially shared on social media platform X by crypto analyst Ali Martinez, new BTC wallet addresses have risen steadily over the past week to reach 352,124, their highest level since April.
Interestingly, the chart shows that the recent uptick in new addresses contrasts with a larger decrease in the creation of new addresses since November 2023. This new increase points to an influx of new users entering the crypto space. As more people adopt Bitcoin, demand will inevitably grow, which is a catalyst for price surges down the line.
Furthermore, Martinez suggested that the uptick in new addresses is from retail investors making a comeback. While institutional investors often drive major market moves, retail interest is crucial for Bitcoin’s mainstream adoption.
Retail #Bitcoin investors are making a comeback! The number of new $BTC addresses on the network surged to 352,124, marking the highest level since April. pic.twitter.com/GFOHnsokz0
— Ali (@ali_charts) June 29, 2024
A major part of the increase in new addresses can be attributed to recent adoption in the Brazilian market. Nubank, Brazil’s biggest neobank, recently announced plans to integrate Bitcoin’s lightning network into its services. As the largest fintech bank in Latin America, this integration could potentially expose a significant portion of its 100 million customers to the digital asset.
What’s Next For Bitcoin?
At the time of writing, Bitcoin was trading at ,446. The leading digital asset has lost over 10% of its market cap in a 30-day time frame and the bulls are struggling to break above ,000. This downtrend could be attributed to a selloff by miners and many long-term holders. Specifically, around 40,000 BTC were sold by long-term holders in June.
Bear markets are temporary. Bull runs will return. It’s just a matter of when, not if. With the second half of the year now approaching, time can only tell how the price of Bitcoin unfolds. Of course, new wallet addresses don’t directly impact price, but they are a leading indicator of growing Bitcoin adoption.
This adoption and demand, coupled with a recent decrease in the number of new Bitcoins entering the market, points to an increase in the price of Bitcoin in July.
Featured image from CNBC, chart from TradingView
Ethereum (ETH) Records Surge In Active Addresses – Incoming Price Rebound?
Ethereum (ETH) is currently down by 0.75% as its price continues a range-bound movement seen all week. However, in its monthly timeframe, the most prominent altcoin displays a concerning performance with a reported loss of 6.40% according to data from CoinMarketCap.
However, popular crypto analyst Ali Martinez has picked up a notable development on the Ethereum network which could spell good fortunes for price action in the coming days.
Ethereum Active Addresses Soar To 3-Month High At 617,170
In an X post on June 22, Martinez reported a significant spike in the active addresses on the Ethereum blockchain. Using data from blockchain analytics company Santiment, the crypto analyst noted there were 617,170 active Ethereum users on June 21, marking the highest value for this metric in the past three months.
#Ethereum just saw its largest spike in active $ETH addresses in three months, reaching a total of 617,170 active #ETH addresses. pic.twitter.com/CSqBOnQhEr
— Ali (@ali_charts) June 22, 2024
This development has sparked much speculation in the Ethereum community as a rise in active addresses often signifies an increase in network activity which is quite important following Ethereum’s overall negative performance in the last month.
In theory, this is a positive omen for ETH’s price as higher activity corresponds with a rise in user transactions thus driving higher demand for the cryptocurrency and ultimately producing a price rebound. Many Ethereum enthusiasts would likely hope that this turns out to be the case when the altcoin breaks out of its current condition between ,400 and 3,600.
ETH Propped For Major Rebound
In other news, another crypto analyst Michaël Van De Poppe has also added to Ethereum’s chances of staging market recovery. Using the ETH/BTC price chart, van De Poppe stated that as long as ETH trades above the 0.05 price mark, the token’s downtrend is set to undergo a reversal soon.
Currently, ETH trades around ,504.42 with a 1.56% decline in the past week. Notably, the token’s daily volume is down by a staggering 52.93%, presently valued at .50 billion.
If the bulls are able to mount massive pressure forcing an upward breakout, ETH may return to the ,000 last seen in March. However, if the bears retain market control, Ethereum could fall as low as 00, representing a potential 14% decline from its current price.
It’s worth stating that all predictions are merely speculations and offer no guarantee. Investors are admonished to conduct proper research before buying any asset.
ETH trading at ,511 on the daily chart | Source: ETHUSDT chart on Tradingview.comFeatured image from, chart from Tradingview
Metamask Updates Privacy Policy, Explains When It May Process Users’ IP Addresses
 Metamask, the popular Ethereum wallet, has updated its privacy policy. The update provides users with greater transparency and control over their personal data, specifically concerning IP address processing. According to the new policy, Metamask may temporarily process a user’s IP address only when required for certain services, depending on the user’s Metamask settings. This is […]
Bitcoin News
Mt Gox Moves 141,686 BTC to Three Addresses, Consolidates 142,846 BCH
 Based on onchain metrics, the Mt Gox funds, once consolidated into a single address holding over .6 billion in bitcoin, have now been distributed to three separate addresses as of Tuesday morning. Mt Gox Funds Redistribution An examination of the onchain transfers from the Mt Gox bitcoin cache reveals that the funds have been allocated […]
Bitcoin News
Ripple CTO Addresses Curious Price Link Between XRP And XLM
In an exchange on X, Ripple‘s Chief Technology Officer (CTO), David Schwartz, also known as JoelKatz, responded to queries about the strikingly similar price movements of XRP and Stellar (XLM). This discussion has brought to light not just the intertwined market dynamics of these two major cryptocurrencies but also the complex factors influencing their valuation.
Curious Correlation Between XRP And XLM
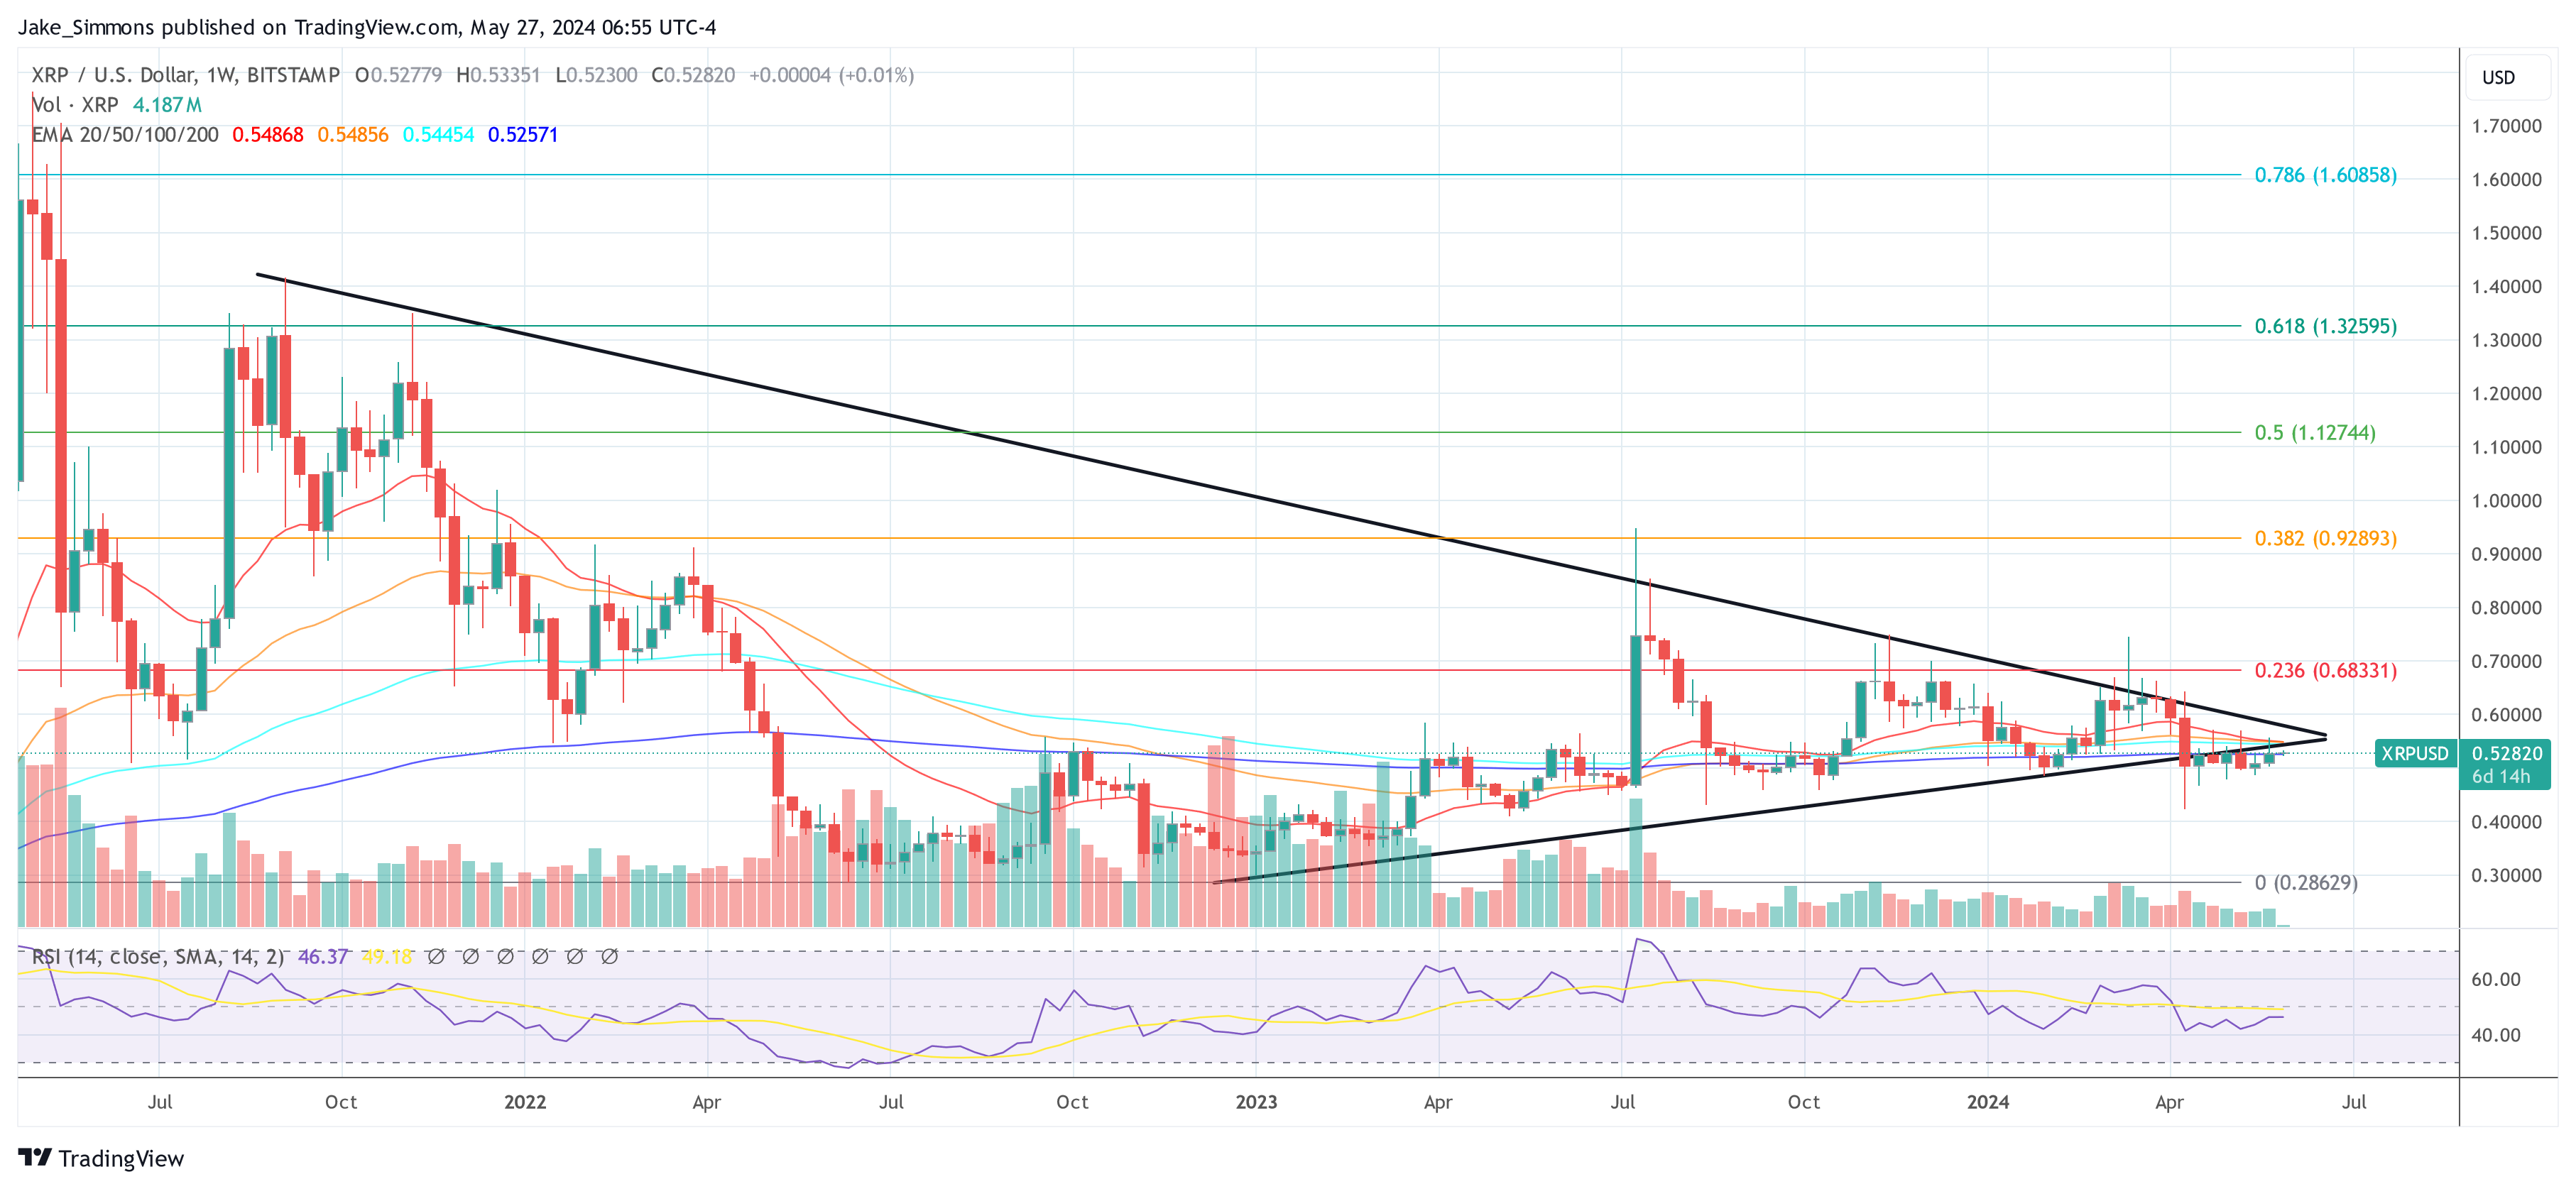
Schwartz candidly addressed a post by Good Morning Crypto, who highlighted a long-term price chart comparison between XRP and XLM since 2014, questioning the “unnatural price symmetry” and the potential for both to “breakout together during this bull run.” Schwartz replied, “I genuinely don’t know. The thing that I think is most likely is that both prices are driven primarily by factors completely outside their ecosystems.”
However, Schwartz also acknowledged conflicting evidence to his theory. When pressed for specifics regarding the unusual correlation, he pointed to the significant event of Stellar burning half of their token supply, which surprisingly did not impact their price or disrupt the price correlation pattern with XRP. “The one bit that’s the most convincing to me is that Stellar burned half their supply and there wasn’t so much as a blip on their price chart or any real deviation from XRP’s price correlation,” Schwartz explained.
This dialogue underscores a broader narrative within the cryptocurrency sector, where XRP and XLM share not only a founder in Jed McCaleb but also similar technological frameworks aimed at streamlining cross-border payments. Despite these overlaps, the absence of a price impact post-Stellar’s token burn has been a particularly puzzling aspect for analysts and the crypto community alike.
Both XRP and XLM have historically mirrored each other’s price movements, potentially due to overlapping use cases, investor behaviors, and market perceptions. As financial tools facilitating quick, cross-border transactions with minimal fees, both have attracted similar investor bases looking for alternatives to traditional banking hurdles.
Market sentiment plays a significant role. News impacting one of the cryptos can quickly spill over to the other due to their perceived substitutability. Additionally, regulatory shifts in one can inadvertently sway investor sentiment towards the other.
Popular pro-XRP lawyer Bill Morgan commented on this, “I don’t know what causes it but it shows how useless Ripple burning the escrow would be. Stellar burned XLM and Ripple did not burn XRP and it had no impact on the symmetry. Same for the lawsuit. No impact overall. Stellar was not sued. Factors external to either blockchain and not specific to either Ripple or Stellar must be the explanation.”
The ongoing debate includes speculation about whether XRP and XLM will jointly make significant gains in an anticipated bull run. Historical price patterns suggest a high level of correlation, but as Schwartz indicates, external factors such as global market conditions and macroeconomic factors are likely at play.
At press time, XRP price stood at .5282.
Bitcoin Bulls Are Strong: Over 450,000 Addresses Bought 273,000 BTC At This Level
Bitcoin is cooling off after an impressive 25% spike from May 2024 lows. Even with this cool-off, some analysts are upbeat, predicting the coin will extend gains in future sessions.
Bitcoin Finds Strong Support Between ,180 and ,600
In a post on X, one analyst believes Bitcoin has strong support at around ,180 and ,600. The analyst explained that on-chain data shows that over 450,000 addresses collectively bought over 273,000 BTC at this price range.
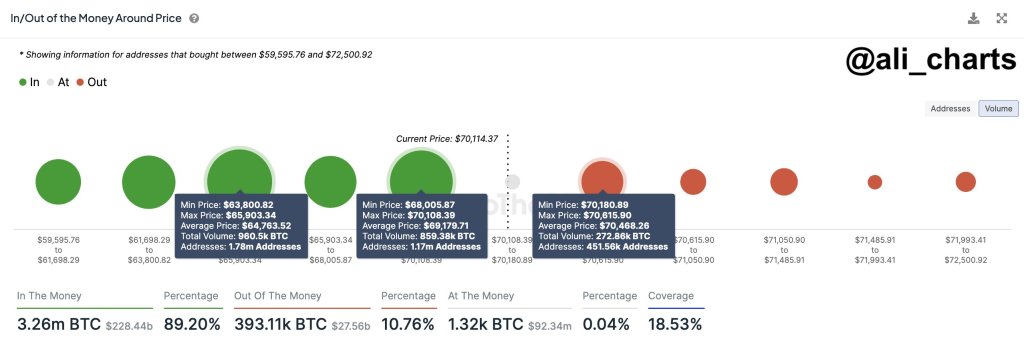
For this reason, the concentration of BTC holdings in this zone means the coin has strong support. If the level is to be broken, then sellers would need to make an even larger effort to break through this line, with a higher amount of BTC hitting the sell side of the equation.
On-chain analytics firm Glassnode notes that the Bitcoin market is cooling after intense selling pressure. After the strong uptick that saw the coin roar to as high as ,800 in March 2024, prices plunged to as low as ,500 this month. Prices have since recovered, but bulls have yet to break above all-time highs.
While capital inflows remain moderate, Glassnode adds, volatility has decreased noticeably. Still, whether this volatility will shoot higher once ,000 is broken remains to be seen.
BTC Retraces: Will Bulls Break ,000?
All eyes are on whether BTC bulls will shake off the current correction. In a post on X, another analyst said holders shouldn’t be worried because of this pullback and the failure of bulls to confirm the May 20 leg up.
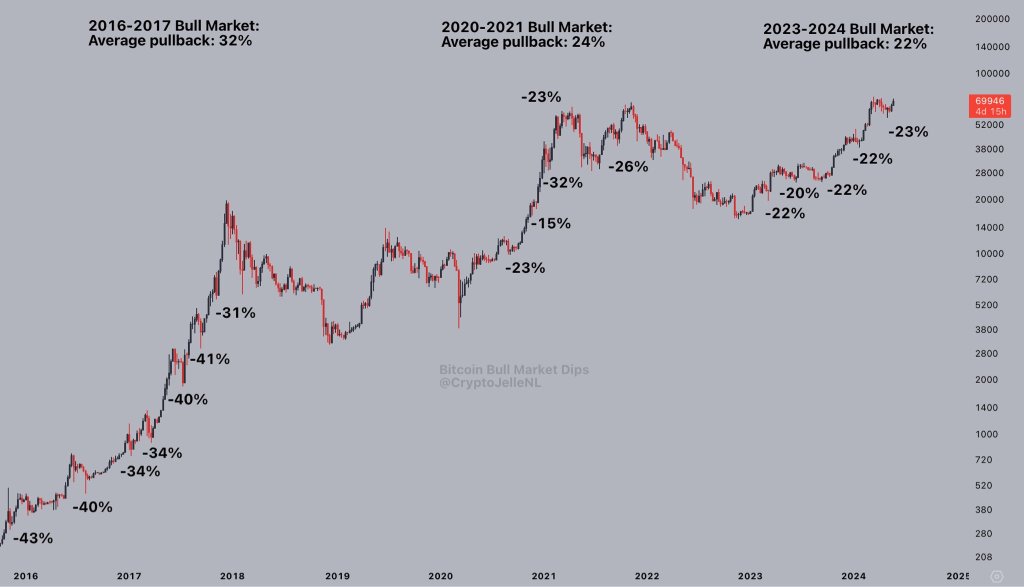
Instead, the analyst is confident, saying pullbacks are a natural part of any bull market. The recent 23% correction, the analyst added, is an example.
What’s important is that every retracement has been from a higher position. Therefore, the next local bottom will likely be higher than the previous one, potentially reaching around ,000.
Thus far, BTC has a strong resistance of ,000. The bulls didn’t push through this line, even with more serious attempts in early April.
As a result, this reaction level remains important from a technical perspective. Any breakout for now would increase the probability of BTC prices floating to retest ,800 or break higher.
In the days ahead, inflows to spot Bitcoin exchange-traded funds (ETFs) coupled with improving sentiment might spark more demand. In that likelihood, BTC bulls will find the momentum to confirm the May 20 bar and break above the local resistance.
Juno Addresses Banking Service Disruption — ‘This Is Outside Our Control’
 Juno Finance acknowledges the disruption in banking services and is collaborating with its brokerage and banking service providers, Synapse and Evolve Bank & Trust, to restore full service as soon as possible. Juno is a financial platform that integrates checking and savings accounts with cryptocurrency trading. “Currently, Evolve Bank & Trust has frozen all card […]
Bitcoin News
Record-Breaking Q1 For Polkadot: Daily Active Addresses Hit 514,000 As DOT Price Surges 7%
According to a Messari report, the Polkadot (DOT) blockchain protocol made significant progress in the first quarter (Q1) of the year in terms of market capitalization, revenue, and Cross-Consensus Message Format (XCM) activity, as well as a record increase in daily active addresses.
DOT’s Market Cap Surges 16% QoQ
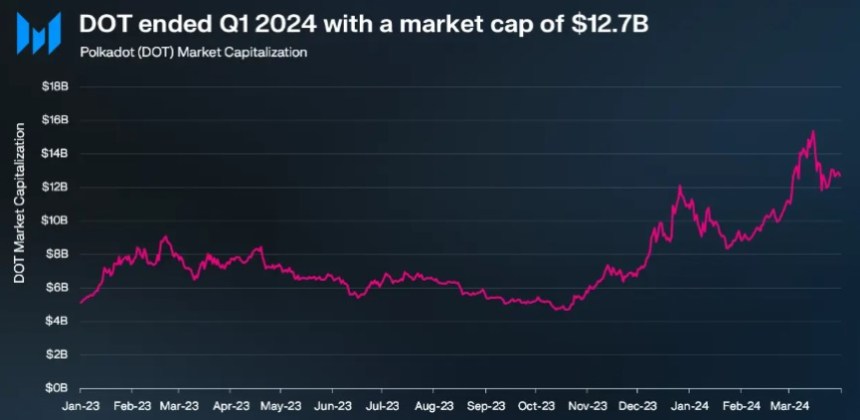
During Q4 2023, Polkadot’s market capitalization experienced a notable 111% quarter-on-quarter (QoQ) increase, reaching .4 billion. Building on this momentum, Q1 2024 witnessed a further 16% QoQ rise, elevating the circulating market cap to .7 billion.
Despite these gains, DOT’s market capitalization remains 80% below its all-time high of .5 billion, set on November 8, 2021.
In Q4 2023, Polkadot’s revenue also skyrocketed by 2,880% QoQ, amounting to .8 million. Per the report, this surge was primarily attributed to an exponential increase in extrinsics, driven by the Polkadot Inscriptions.
However, revenue metrics for Q1 2024 declined significantly on a QoQ basis, with revenue in USD dropping by 91% to 1,000 and revenue in DOT decreasing by 92% to 28,800. It is worth noting that Polkadot’s revenue tends to be relatively lower compared to its competitors due to the network’s structural design.
Polkadot’s XCM activity continued to show growth in Q1 2024. Daily XCM transfers surged by 89% QoQ to reach 2,700, while non-asset transfer use cases, known as “XCM other,” witnessed a 214% QoQ increase, averaging 185 daily transfers.
The total number of daily XCM messages grew 94% QoQ to 2,800, demonstrating the network’s dynamic ecosystem. In addition, the number of active XCM channels grew 13% QoQ to a total of 230.
Polkadot’s Parachain Network Soars To New Heights
Q1 2024 marked a significant kick-off to the year for Polkadot’s parachains, with active addresses reaching an all-time high of 514,000, representing a substantial 48% QoQ growth.
Moonbeam emerged as the leading parachain with 217,000 monthly active addresses, a solid 110% QoQ increase. Nodle followed closely with 54,000 monthly active addresses, doubling from the previous quarter.
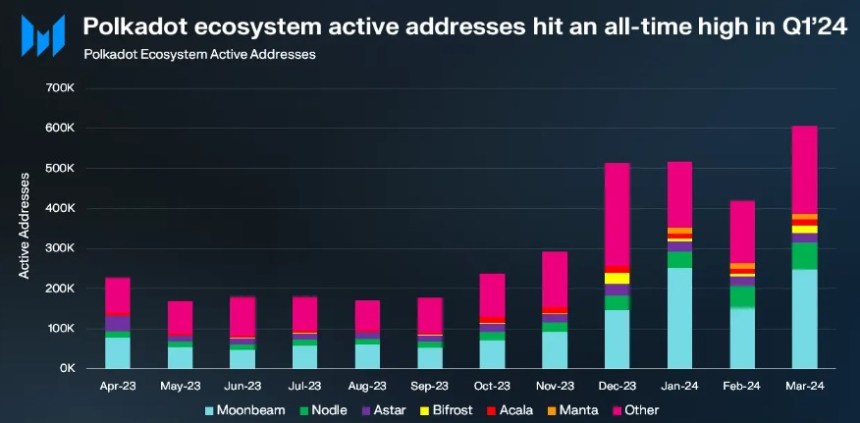
Astar on the other hand, experienced a modest 8% QoQ growth to reach 26,000 active addresses, while Bifrost Finance grew slightly by 2% QoQ to 10,000 addresses. However, Acala experienced a decline, with monthly active addresses falling to 13,000, down 16% QoQ.
Notably, the Manta Network stood out among parachains in Q1 2024, with a significant surge in daily active addresses, reaching 15,000. According to Messari, this increase was fueled by the successful launch of the MANTA token TGE and subsequent listing on Binance, propelling Manta’s Total Value Locked (TVL) to over 0 million.
Polkadot Price Sees Upside Potential Ahead
In terms of price action, Polkadot’s native token DOT has regained bullish momentum following a sharp drop to the .8 price mark after reaching a yearly high of on March 14.
Currently, DOT has regained the .25 level, up 7% over the past week. However, DOT’s trading volume decreased slightly by 4.7% compared to the previous trading session, amounting to 0 million over the past 24 hours, according to CoinGecko data.
If the bullish momentum persists, Polkadot faces its first resistance at the .4 zone, which serves as the last threshold before a potential retest of the resistance wall.
On the other hand, the .4 support floor has proven to be successful after being tested for two consecutive days this week, highlighting its significance as a key level to watch for the token’s upward movement prospects.
Featured image from Shuttestock, chart from TradingView.com