Key Highlights
- ADA price declined heavily and broke the .0320 and .0300 support levels against the US Dollar (tethered).
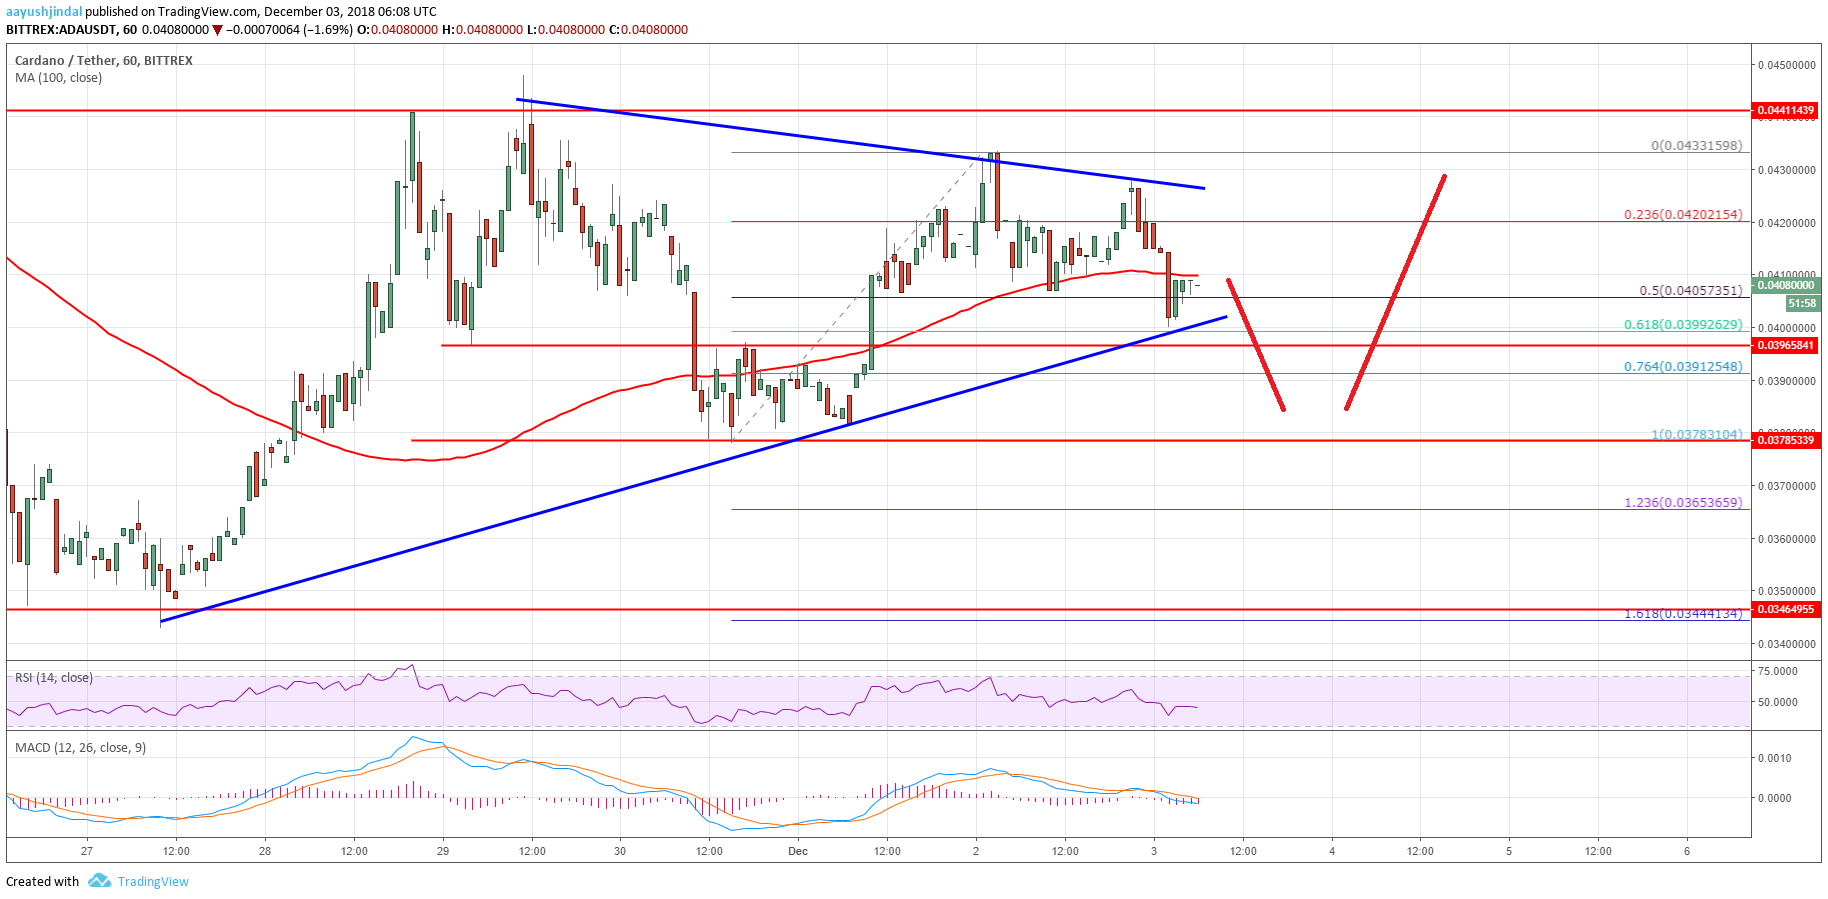
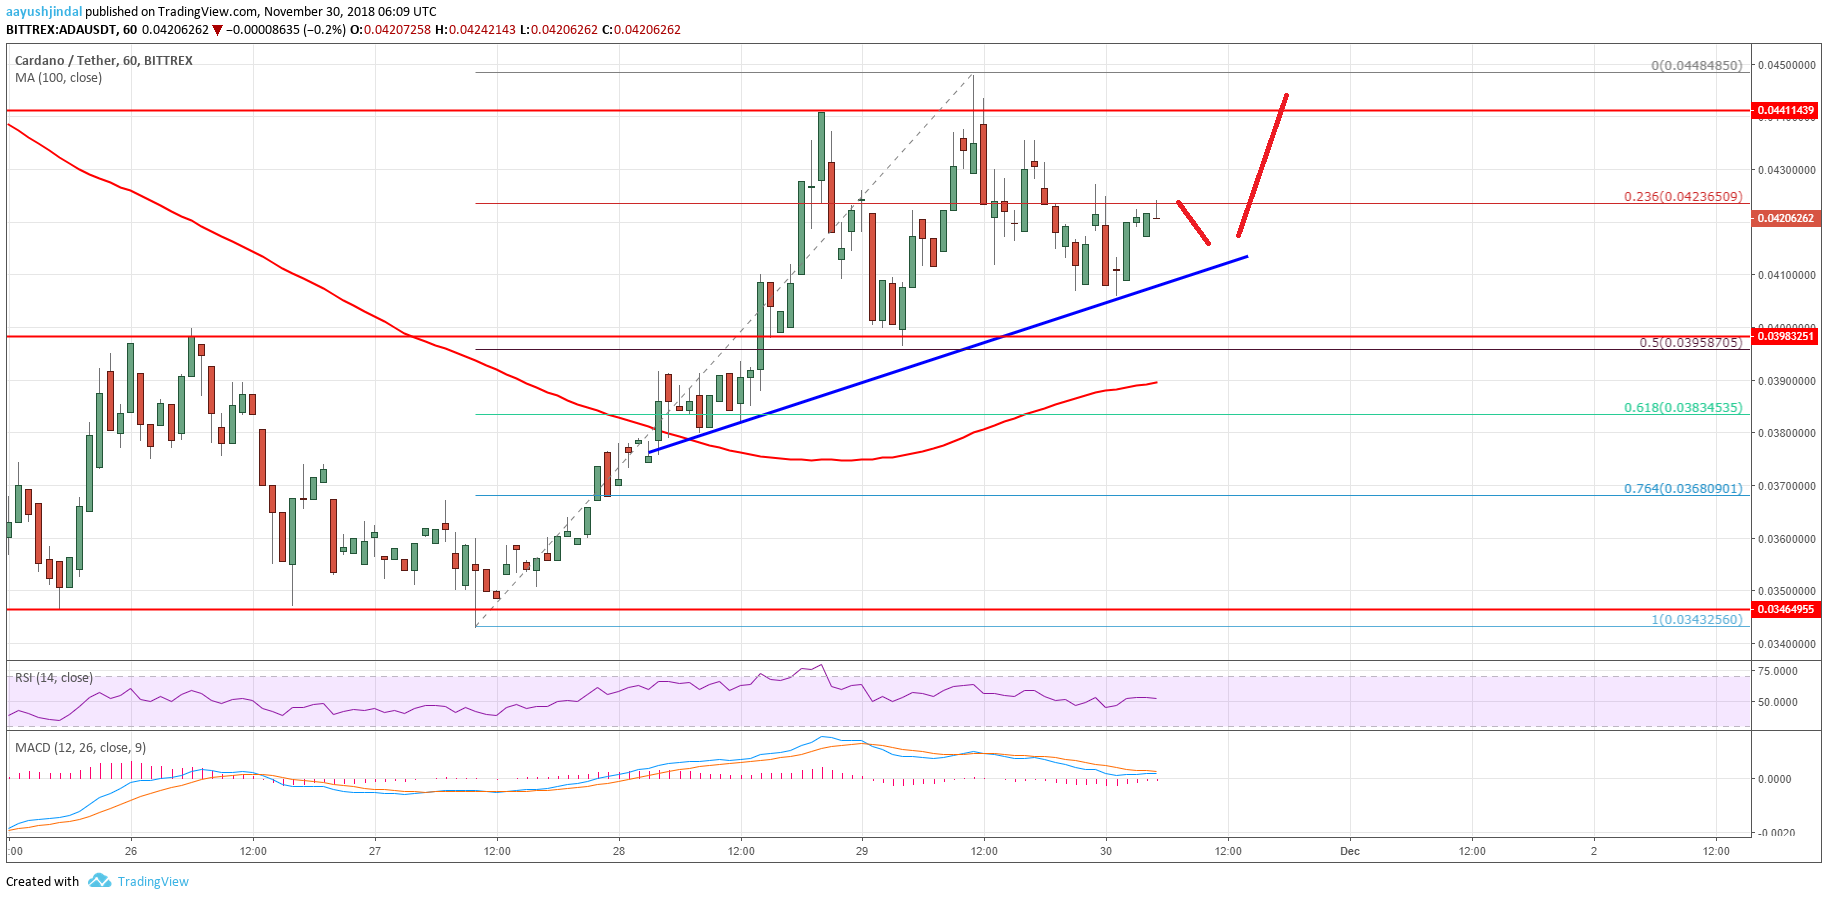
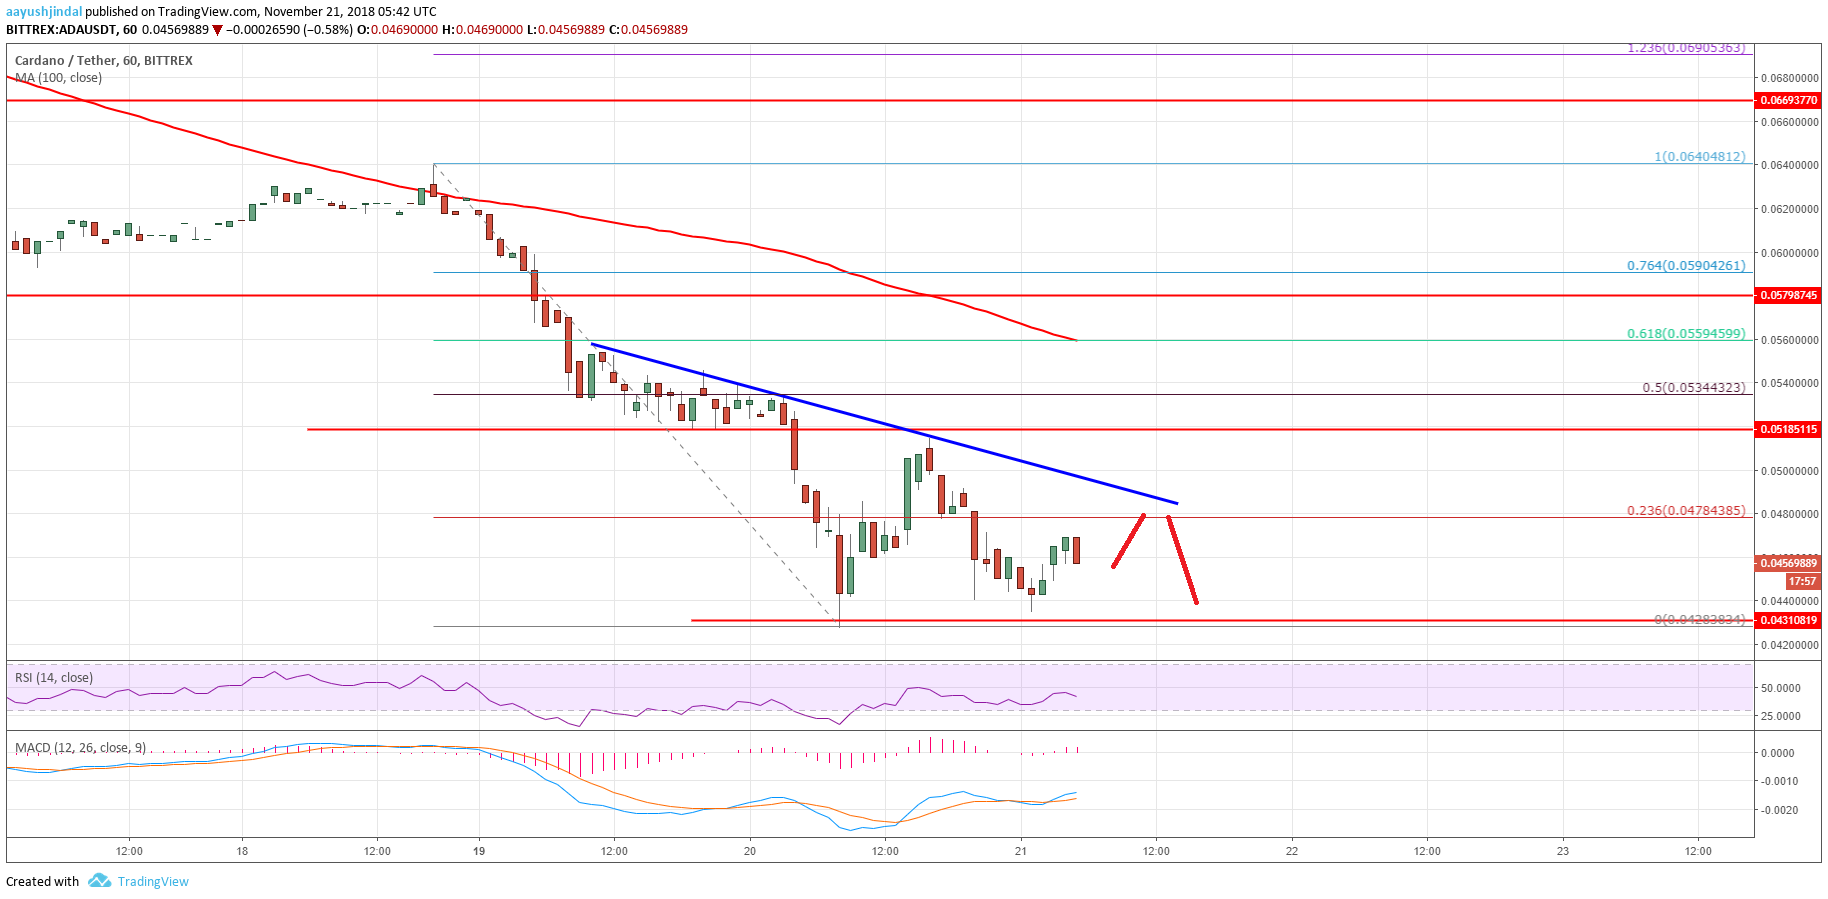
- There are two bearish trend lines formed with resistance at .0320 and .0350 on the hourly chart of the ADA/USD pair (data feed via Bittrex).
- The pair could correct higher in the short term, but upsides remain capped near .0320 and .0310.
Cardano price is under heavy selling pressure against the US Dollar and Bitcoin. ADA/USD may continue to decline and it could test the .0260 support.
Cardano Price Analysis
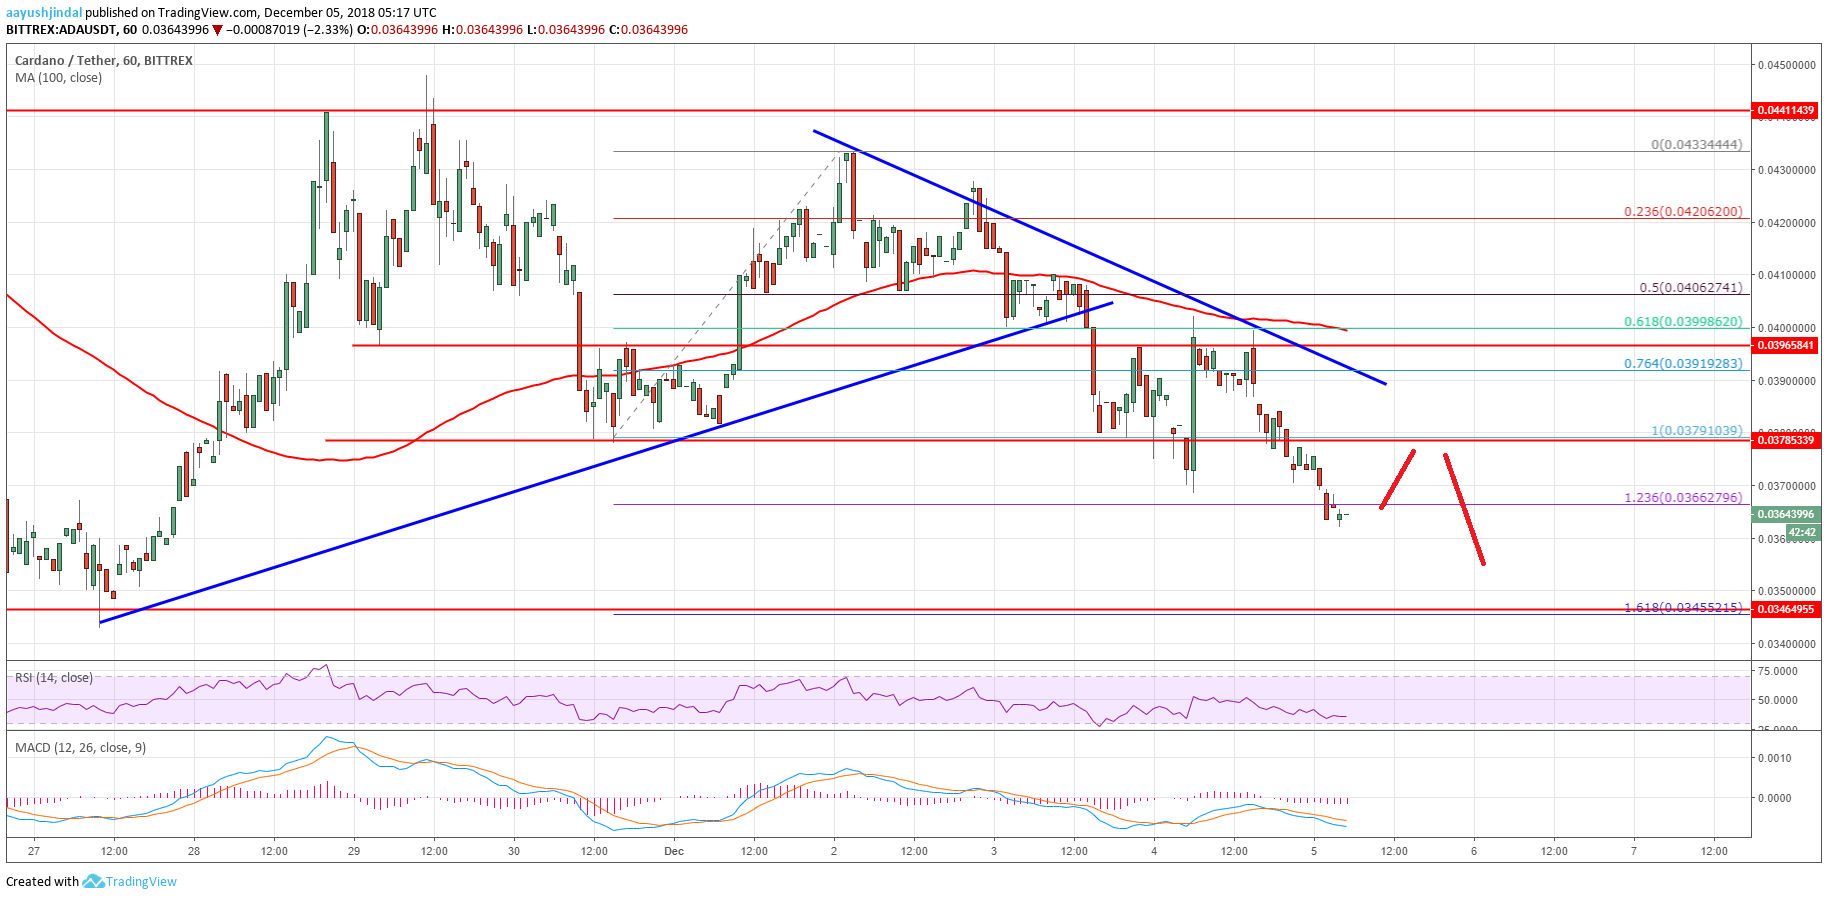
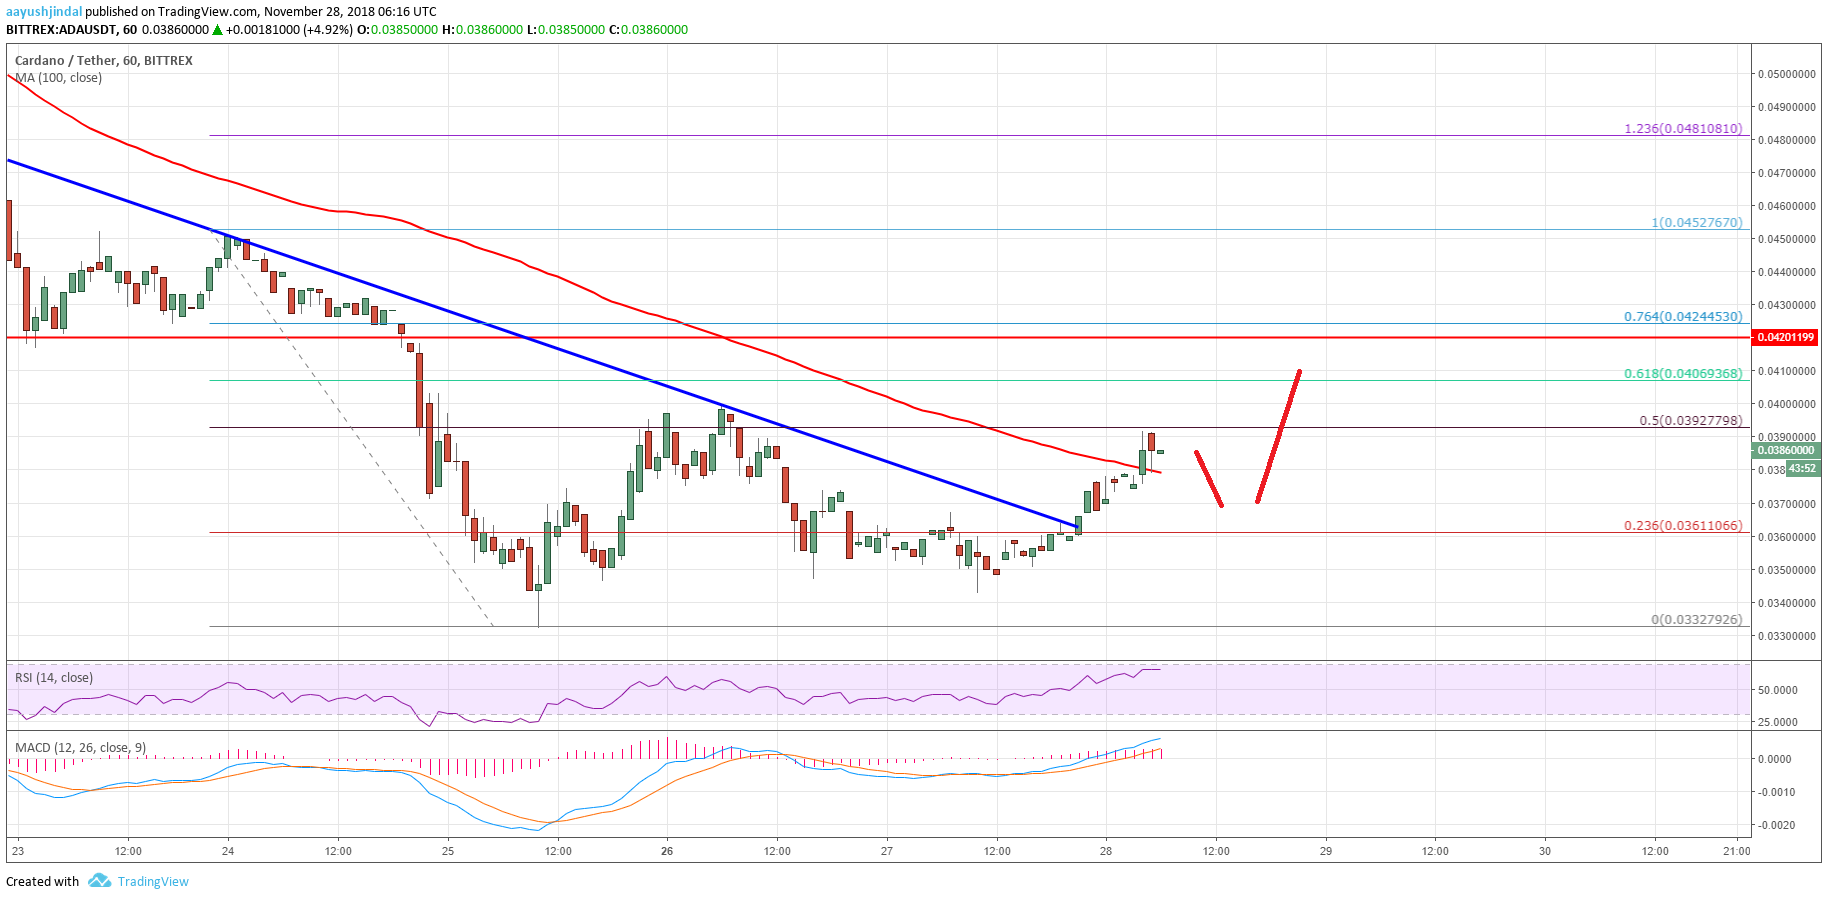
There were continuous declines from the .0360 swing high in cardano price against the US Dollar. The ADA/USD pair declined heavily and broke the .0320 and .0300 support levels. There was even a close below .0300 and the price is now well below the 100 hourly simple moving average. A new multi month low was formed at .0288 and the price is currently placed heavily in the bearish zone.
An initial resistance is near the 23.6% Fibonacci retracement level of the recent decline from the .0355 high to .0288 low. However, the main resistance is near the .03200 level. It coincides with the 50% Fibonacci retracement level of the recent decline from the .0355 high to .0288 low. Moreover, there are two bearish trend lines formed with resistance at .0320 and .0350 on the hourly chart of the ADA/USD pair. Therefore, if the price corrects higher from the current levels, it could face sellers near the .0320 or .0350 level. On the downside, the recent low at .0288 is a short term support. If there are more losses, the price may test the .0260 level.
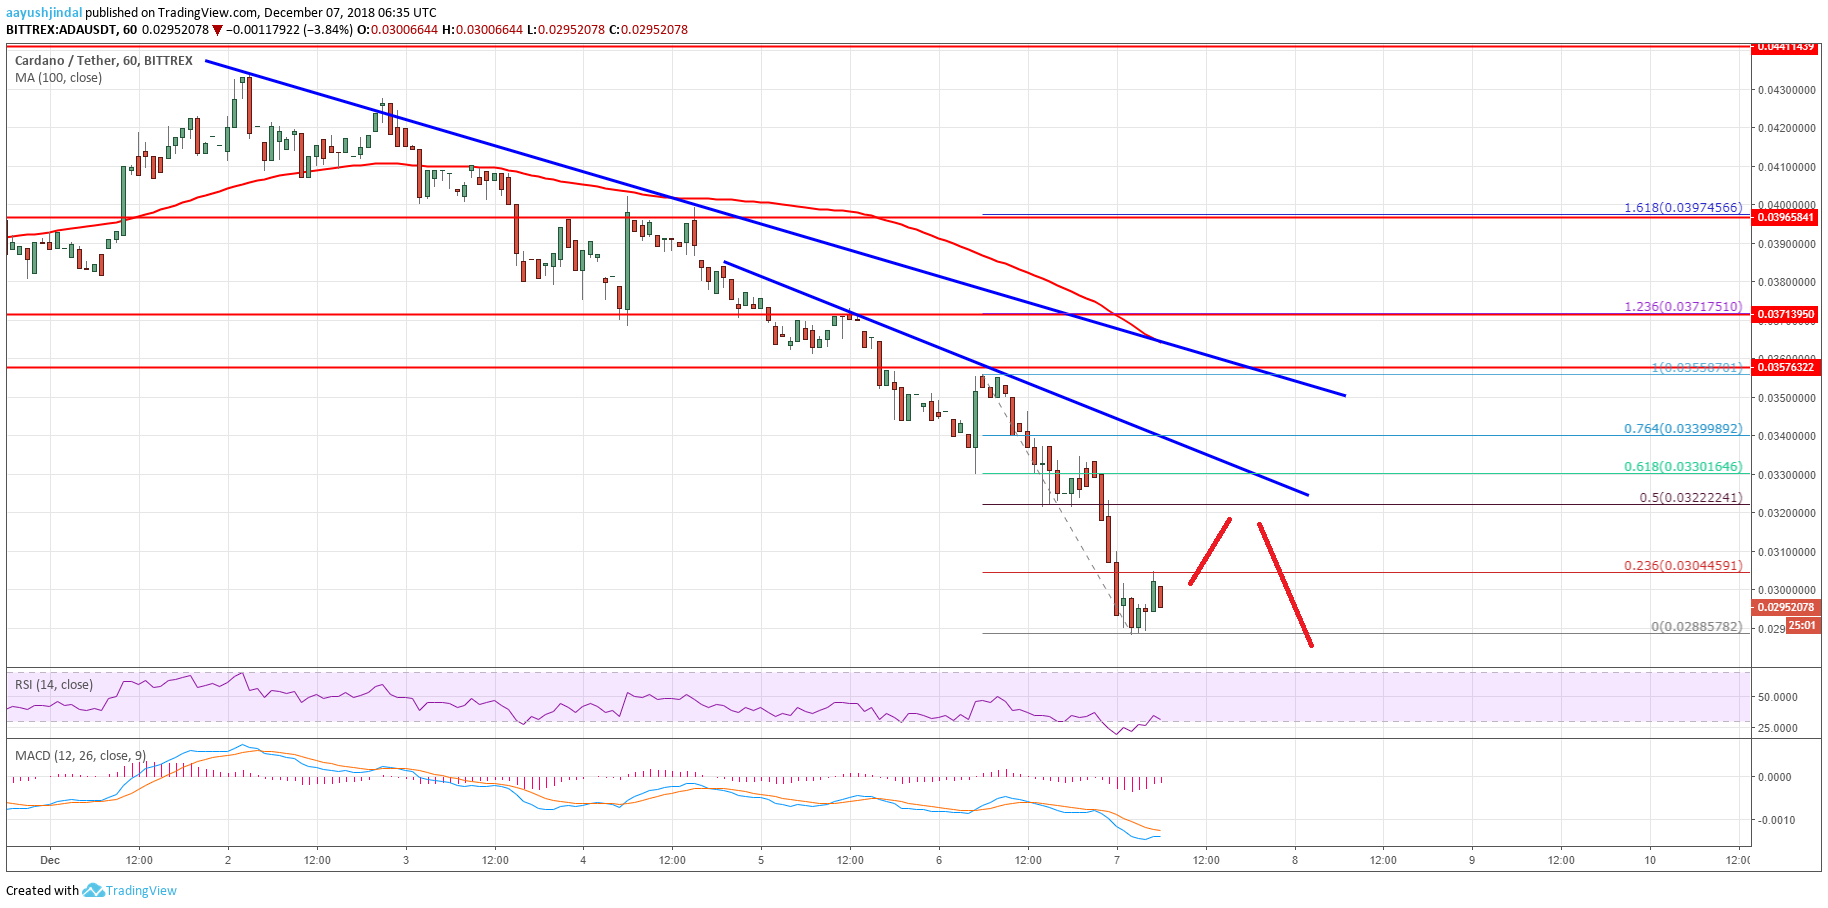
The chart indicates that ADA price is clearly in a major downtrend below .0350. Only a daily close above .0320 and .0350 may push the price back in a positive zone.
Hourly MACD – The MACD for ADA/USD is still in the bearish zone.
Hourly RSI – The RSI for ADA/USD is placed well below the 30 level.
Major Support Level – .0288
Major Resistance Level – .0350
The post Cardano Price Analysis: ADA/USD Decline Below .030 Looks Real appeared first on NewsBTC.