 Despite a brief dip below ,000 on June 23, bitcoin has demonstrated formidable resilience by closing above this pivotal level for 118 days in 2024. According to QCP Capital, the cryptocurrency continues to hold strong against various market pressures, including substantial governmental sell-offs. QCP Capital Foresees Bitcoin Holding K Line, Despite Recent Market Pressures In […]
Bitcoin News
TON Price Remains Resilient Above $6.7, Can It Hold Ahead Of Crypto Winter?
Despite the broader cryptocurrency market experiencing fluctuations and challenges, TON (The Open Network) has demonstrated remarkable resilience. Holding steady in the face of varying market sentiments, TON’s price stability has attracted attention from investors and analysts alike.
This resilience raises a critical question, can TON maintain its strength and continue to thrive as the market potentially enters a tougher phase, often referred to as the crypto winter?
TON’s price was trading at around .56 and was up by 4.03% with a market capitalization of over billion and a trading volume of over 2 million as of the time of writing. There has been a 24-hour increase of 3.84% and 14.75% in TON’s market capitalization and trading volume respectively.
This article examines the price action of TON in detail to assess if the market of the crypto asset will continue to be optimistic or whether further gains are likely before a decline.
Analyzing TON’s Performance Amidst Crypto Fluctuations
On the 4-hour chart, the price of TON is actively bullish, and an upward move toward the .7 resistance level is being attempted. This followed after the price failed to break below the bullish trend line. It should also be noted here that the asset is actively trading above the 100-day Simple Moving Average (SMA) which suggests that TON might extend its upward trajectory.
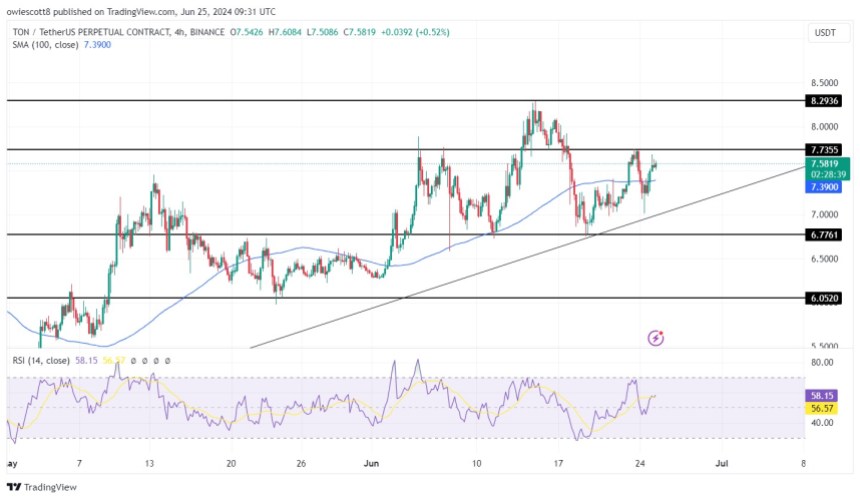
With the signal line of the Relative Strength Index (RSI) trending above 50% after an unsuccessfully attempted drop below it, the indicator confirmed the above claim that the digital asset might extend its upward movement.
An analysis of TON’s current price action on the 1-day chart reveals that the bulls are still very active in the market as the price experiences a strong rejection after attempting a drop toward the bullish trend line. It can therefore be said that TON is actively bullish and may extend its bullishness.
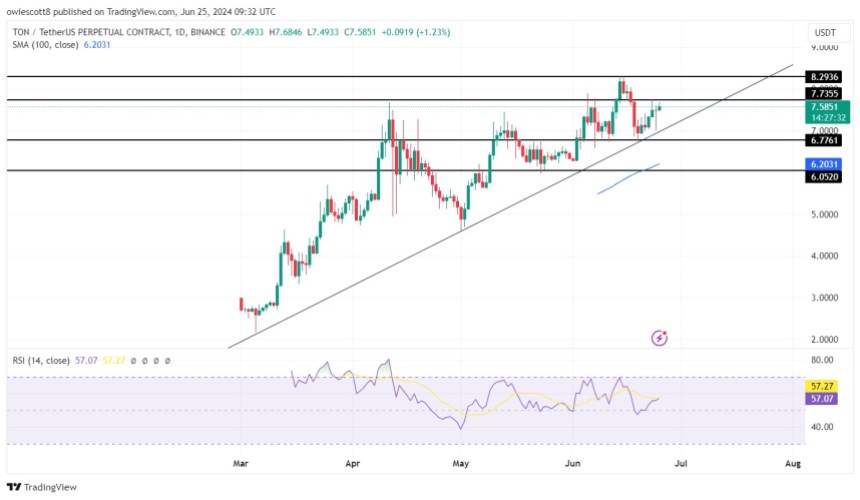
Adding to this, is the 1-day RSI indicator signaling more positive movements for TON’s price as the signal line after a drop to the 50% level, is beginning to rise above it again.
Can TON Withstand The Crypto Winter?
Exploring the prospects and strategies of TON for enduring future market downturns, it was revealed that if the crypto asset continues to move upward and break above the .7 resistance level. It may move higher to test the .2 resistance level and probably move on to create a new all-time high if the price breaches this level.
However, if it fails to break above the .7 resistance level, it will begin to move downward toward the .7 support level. Should the price breach this support level, it may move further to test the .05 support level and possibly other lower levels.
Tron’s USDT Triumphs: Daily Volume Climbs Above $53 Billion, Dwarfing Visa
USDT, Tether’s digital token pegged to traditional currencies, is leading a quiet revolution in the world of finance. In a landmark development, USDT has surpassed Visa’s average daily transaction volume on the Tron blockchain, underscoring its position as the undisputed leader in the stablecoin space. This surge signifies a growing confidence in stablecoins and their potential to disrupt the financial landscape.
USDT Flexes Muscles
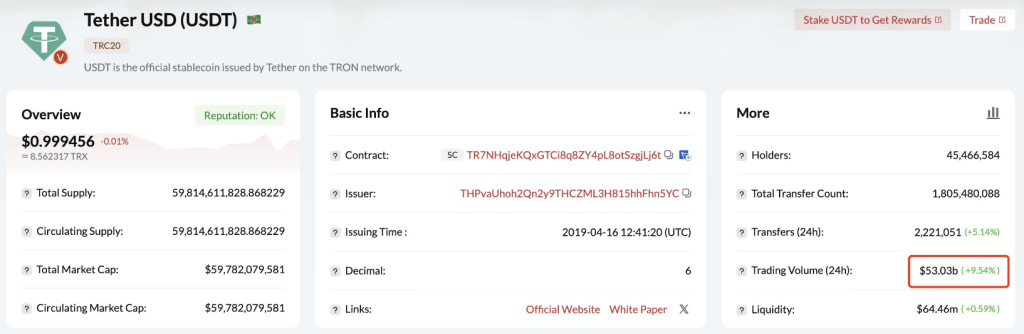
USDT’s dominance is evident. Available on multiple blockchains, it has seen its market cap explode since its inception in 2014. But the recent milestone on Tron, a blockchain known for its lower transaction fees, is particularly noteworthy. Lookonchain data reveals USDT transactions on Tron hitting a staggering billion in a single day, exceeding Visa’s daily average of billion. This 20% lead underscores the increasing adoption of stablecoins for everyday transactions.
The 24-hour trading volume of $USDT on #TronNetwork is B, exceeding Visa’s average daily trading volume.
Visa’s trading volume in Q1 2024 was .78T and the average daily trading volume was B. pic.twitter.com/jolGKIUcxE
— Lookonchain (@lookonchain) June 21, 2024
Why The Rise Of Stablecoins?
So, what’s driving this surge? Unlike traditional cryptocurrencies known for their wild price swings, stablecoins offer a haven of stability. They are typically pegged to fiat currencies like the US dollar, meaning their value remains relatively constant. This stability makes them ideal for everyday transactions, eliminating the fear of sudden price drops that plague traditional cryptocurrencies. Additionally, stablecoins leverage the power of blockchain technology, enabling faster, cheaper, and more transparent transactions compared to conventional systems.
Regulation On The Horizon
As stablecoins gain traction, governments are scrambling to establish regulatory frameworks. The Lummis-Gillibrand Payment Stablecoin Act in the US and similar initiatives in the UK highlight a global concern for ensuring user protection and financial stability in the face of this innovation. While these regulations are crucial for responsible growth, navigating the ever-changing political climate adds another layer of complexity. For instance, the UK’s crypto policy remains uncertain with a looming general election.
The Future Of Finance
Despite the challenges, the momentum behind stablecoins seems unstoppable. Their ability to bridge the gap between traditional finance and the crypto world offers undeniable advantages. While daily transaction volume can be volatile, and concerns like rising transaction fees on Tron need to be addressed, the overall trend is clear.
Stablecoins are here to stay, and their impact on the global financial system is likely to be profound. As regulations take shape and the technology matures, stablecoins have the potential to revolutionize the way we conduct everyday transactions, ushering in a new era of financial inclusion and efficiency.
Featured image from Pexels, chart from TradingView
Shiba Inu To The Moon: Analyst Predicts A Run Above $0.00015 If This Happens
Shiba Inu has received another bullish prediction from a crypto analyst, highlighting the expectations that the meme coin is far from done. This time around, a crypto analyst has predicted a notable surge in the SHIB price, with the expectation that it will reach a new all-time high by the time the rally is complete.
Shiba Inu Poised For New All-Time Highs
In an analysis posted on X (formerly Twitter), crypto analyst Javon Marks has shared a rather bullish expectation for the Shiba Inu price. Marks, who has been quite vocal about his support for the coin, continued into the new week, predicting a new all-time high for the meme coin.
The crypto analyst reveals that the Shiba Inu price had been trading inside of a small Bull Flag pattern. However, the meme coin has been able to break out of this bull flag pattern and could see a rally as a result of this development. As the crypto analyst explains, “this breakout may be enough to spark another major wave up in an already massive uphill run!”
The major reason why this breakout is important is where the price could end up as a result. For one, the crypto analyst sees the price reaching its current all-time high above .000081 for a start. Then, if the rally were to continue from here, Marks expects SHIB to rise as high as .00015.
The initial target would constitute an over 300% increase in price. However, the “larger breakout” which the analyst expects is on the horizon, is more important, bringing an over 800% increase in price if it comes to pass. “A break above .000081 and SHIB may just be set for another +90% move to .0001553,” Marks said.
Being Bullish On SHIB
The latest Shiba Inu analysis from crypto analyst Javon Marks is only the latest in a long line of bullish predictions that he has made for Shiba Inu. Marks’ thread goes as far back as September 2023, and since that time, the SHIB price has risen more than 200%.
Despite the notable price increases since the first analysis was posted, the crypto analyst believes that the meme coin is far from done. The previous analyses also reiterates this point, expecting a continuation of the rally until its breaks out to .000081.
Presently, the Shiba Inu price is still struggling against bearish crypto market headwinds after the Bitcoin price crashed to ,000. It is down 9.42% in the last day alone, and struggling against 18.16% losses on the weekly chart as well.
Solana (SOL) Maintains Bullish Trajectory Above 100-Day SMA, Rally Looms?
Solana (SOL) has shown remarkable market resilience by holding onto its position above the 100-day Simple Moving Average (SMA) in spite of notable market turbulence. SOL has seen a lot of volatility in the last several months, but it has found firm support at this pivotal moving average, indicating a persistent positive mood.
The ability of Solana to hold above the 100-day SMA shows that buying enthusiasm outweighs any downward pressure, providing a good basis for future upward momentum thereby attracting the attention of traders and investors.
As of the time of writing, SOL’s price was down by -0.56%, trading at about 2. Its market capitalization was over billion, and its 24-hour trading volume was over .9 billion. Both market capitalization and the trading volume are down by -24% and -22.39% respectively.
Technical Analysis Of Solana
This analysis was carried out using both the 4-hour and daily timeframe with the help of the 100-day SMA and the Relative Strength Index (RSI) indicators.
Solana is currently moving in a consolidation manner, building up momentum above the 100-day simple moving average in the 4-hour chart. Judging from the price movement, it can be suggested that SOL might move upward.

The 4-hour relative strength index is also actively positive as the RSI line is seen trending above the 50% level. From this RSI formation, it can be suggested that SOL will move down a bit closer to the SMA before making a good move in the upward direction.
SOL on the 1-day chart also looks bullish as it attempts to move upward after rejection at the 0 support level. Thus at this point, It can be suggested that the price of SOL can still potentially move upward.

Finally, we can see that the daily RSI is highly bullish because it rejected a downward move at the 50% level and started to rise again, indicating that the crypto asset is bullish and that the price could make a run for it.
SOL’s Potential Price Movements
As of right now, Solana is moving upward toward the 8 resistance level. If SOL’s price breaks this level, it will continue to move upward to test the 5 resistance level and probably move on to create a new high if it breaks above this 5 level.
However, if it is unable to overcome this resistance level, it will start to decline in the direction of the 0 support level. Should it break below this support level it will continue to move down to test the 0 support level. Furthermore, SOL may witness a deeper correction to test the 8 support level on the chart if it breaks the above support level.
Is Polkadot Preparing For A 100% Surge And Spike Above $20?
Polkadot, the interoperable blockchain, remains one of the largest and most popular networks in the top 20. At press time, DOT, the platform’s native currency, is 14th, ahead of Tron and the NEAR Protocol.
However, despite recent gains, it is still down 87% from all-time highs, undeniably facing a brutal market correction.
Even with this bearish sentiment, a wave of optimism is building around DOT’s future. Taking to X, one analyst thinks not only will the coin shake off weakness but will surge, rallying to over in the coming months.
This confidence, the analyst said, will be primarily because of crucial developments in the broader Polkadot ecosystem.
Eyes On Polkadot 2.0, Better On-Chain Governance
Of the many, the analyst thinks the upcoming Polkadot 2.0 upgrade will be a game-changer. Already, Polkadot is interoperable and scalable. However, once the new upgrade comes into play, the platform’s developers expect the network to be more interoperable, scalable, and with better governance.
Specifically, to address scalability, they will eliminate the Parachain slot auction and introduce the concept of coretime. This feature will give developers more flexibility.
Instead of bidding and locking resources in the auction, they must purchase block space dynamically as needed. This will improve resource allocation, leading to more accessibility and efficiency.
Additionally, Polkadot developers are introducing the OpenGov system for more decentralized governance. The objective here will be to give all DOT holders a voice in decision-making, which is crucial in decentralized networks.
JAM Upgrade Proposal Passed, Will DOT Bulls Break ?
The network is also preparing for more changes. The community recently approved the Join-Accumulate Machine (JAM) chain.
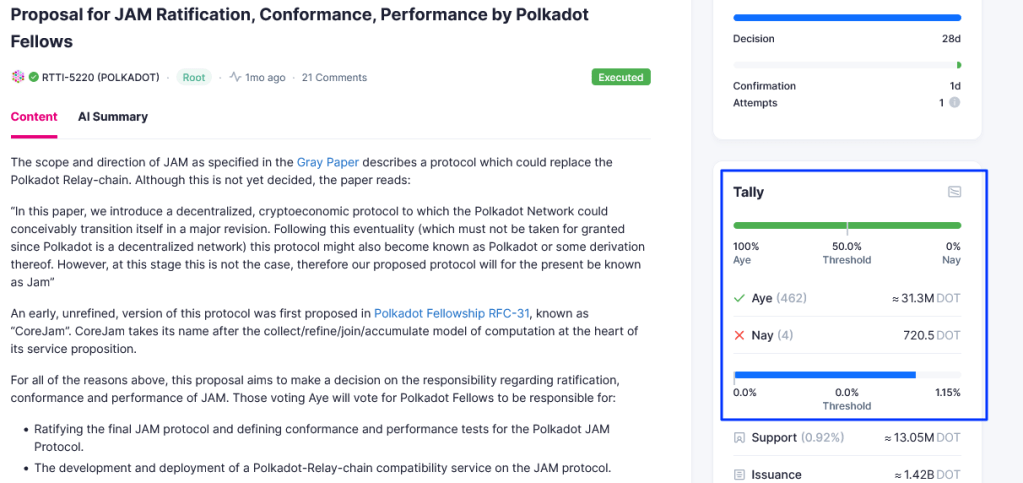
The proposal, which was unanimously passed by the community, paves the way for developers to build services similar to Ethereum smart contracts directly on the Polkadot Relay Chain. Gavin Wood, the former Ethereum developer who introduced the proposal, said this would make the network more accessible.
Beyond network-related upgrades, the analyst also said that more DOT’s are being locked, which is a huge boost. Usually, with staking, coins are taken out of circulation, increasing scarcity. If more activity and the demand for DOT increases, it would positively impact the price, helping lift it from the current ranges.
As of June 3, over 1.4 billion DOT were in circulation. By the fourth week of May, over 820 million DOT had been staked. Looking at the price chart, if the coin breaks above , the incentive to stake and early rewards plus capital gains will increase.
Ethereum Hovering Above $3,700 As Mega Whales Accumulate: $4,900 Incoming?
At spot rates, Ethereum prices have been edging lower, recently even retesting the immediate support at ,700. Even though the coin is still hovering around this level, optimism is high that it will spike higher in the coming days.
Ethereum Whales Are Now Accumulating
Cementing this outlook, one analyst, citing on-chain events, notes that a bullish narrative may be unfolding. Pointing to the sharp increase in Ethereum addresses controlling over 10,000 ETH, the analyst is now convinced that investors are through with their distribution and are not accumulating, expecting more price gains.
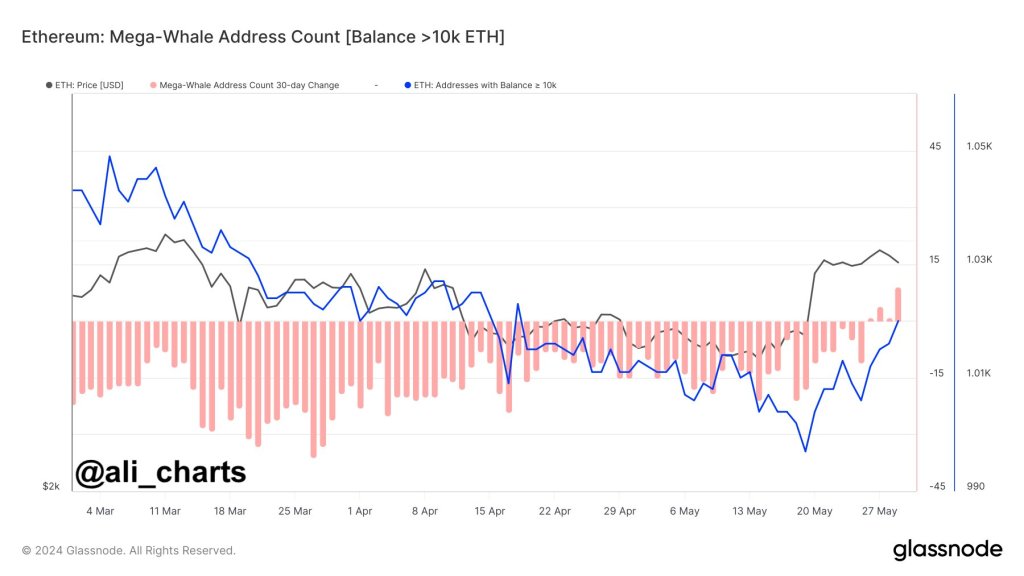
Glassnode data cited shows that the number of addresses controlling over 10,000 ETH has been on the uptrend since May 20. Notably, on this day, prices shot strongly, breaking above ,300 and ,700.
The uptick boosted sentiment, possibly explaining why whales are now accumulating and not opting to liquidate, accepting to be shaken off from their position following the recent correction from ,900.
When writing, ETH is changing hands at around ,700, up nearly 20% from May 2024 lows. From the daily chart, the coin is still within a bullish breakout formation after clearing two crucial resistances (now support) at ,300 and ,700.
Therefore, despite the retracement from ,900, the uptrend remains. The coin, reading from the candlestick arrangement in the daily chart, will likely ease above ,100 as buyers set their eyes on ,900 or 2021 highs.
It is highly that these whales are institutions, most of whom are optimistic about what lies ahead and positioning themselves for the leg up. The sharp expansion in whale count means institutions are increasingly confident in the vast Ethereum ecosystem.
Continuous Development And Spot ETH ETF Hopes
One reason for this positive outlook is the continuous development in the Ethereum network. After the successful activation of Dencun in March, platform developers are now focusing on the upcoming Pectra upgrade.
This hard fork is expected to further enhance the network, making transaction processing more efficient and cost-effective. These continuous developments are positioning the network as the preferred host for decentralized finance (DeFi) and meme coin activities.
Beyond platform-related factors, the United States Securities and Exchange Commission (SEC) recently approved the listing of all spot Ethereum exchange-traded funds (ETFs).
The agency is yet to clarify its position on the status of ETH. However, this will change with the approval of all S-1 registration forms for spot ETFs. Analysts believe the second most valuable coin would have received the much-needed clarity if these forms are given the go-ahead.
XRP Price Steadies Above Support: Gearing Up for a Breakout?
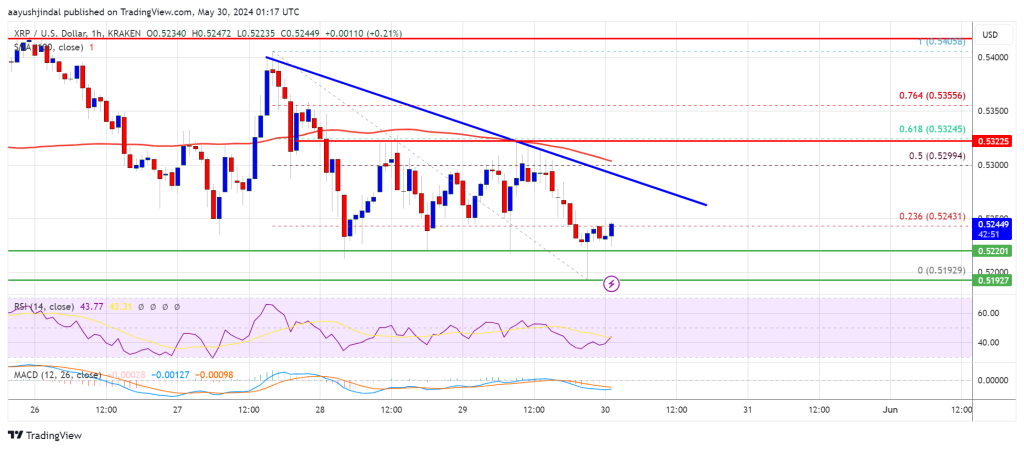
XRP price is holding the key support at .5220. The bulls could aim for a fresh increase unless there is a close below the .5220 support.
- XRP is struggling to start a fresh increase above the .5350 resistance zone.
- The price is now trading below .5320 and the 100-hourly Simple Moving Average.
- There is a key bearish trend line forming with resistance near .5280 on the hourly chart of the XRP/USD pair (data source from Kraken).
- The pair could start a fresh increase unless the bears push the price below .5220.
XRP Price Holds Support
XRP price again saw a bearish move and retested the .5220 support zone like Bitcoin and Ethereum. There was also a spike below the .5220 support zone, but the bulls were active.
A low was formed at .5192 and the price is back above .5220. The price is now trading near the 23.6% Fib retracement level of the downward wave from the .5405 swing high to the .5192 low. It is now trading below .5320 and the 100-hourly Simple Moving Average.
On the upside, the price is facing resistance near the .5280 level. There is also a key bearish trend line forming with resistance near .5280 on the hourly chart of the XRP/USD pair.
The first key resistance is near .5300 or the 61.8% Fib retracement level of the downward wave from the .5405 swing high to the .5192 low. A close above the .5300 resistance zone could send the price higher. The next key resistance is near .540.
If there is a close above the .540 resistance level, there could be a steady increase toward the .5450 resistance. Any more gains might send the price toward the .5650 resistance.
More Downsides?
If XRP fails to clear the .5280 resistance zone, it could continue to move down. Initial support on the downside is near the .5220 level.
The next major support is at .5120. If there is a downside break and a close below the .5120 level, the price might accelerate lower. In the stated case, the price could decline and retest the .50 support in the near term.
Technical Indicators
Hourly MACD – The MACD for XRP/USD is now losing pace in the bearish zone.
Hourly RSI (Relative Strength Index) – The RSI for XRP/USD is now below the 50 level.
Major Support Levels – .5220 and .5120.
Major Resistance Levels – .5280 and .5300.
Bullish Breakout: WIF Starts New Rally Above 100-Day Moving Average, What Next?
The recent upward movement has led the price of WIF to continue its rally above the 100-day Simple Moving Average (SMA). This movement comes after it fails to break below the .03 support level.
With a current market capitalization of .9 billion and a 24-hour trading volume of over .5 billion, WIF has been dominating the meme world alongside other meme coins like PEPE and DOGE since the start of this recent move.
As of the time of writing, the price of WIF was up by 21%, trading around .97 above the 100-day moving average in the last 24 hours.
WIF On The 4-hour Chart
From the 4-hour timeframe chart, it can observed that the price of WIF is actively trading above the 100-day moving average, suggesting that the WIF is on a bullish trend and could continue to move upward.

Also, looking at the 4-hour MACD indicator, it can be observed that the MACD histograms are trending above the MACD zero line with good momentum. The MACD line and the MACD signal line are also seen moving above the MACD zero line with a good spread from each other. Given the significance of this MACD pattern, it is possible that WIF’s price will continue to rise and the market is still overwhelmingly positive.
On the 1-day time frame, WIF is actively bullish as the price has previously dropped two bullish candlesticks leading to its continuous upward movement today.

Furthermore, the 1-Day MACD indicator is giving a bullish sign as the MACD histograms are seen trending above the MACD zero line with good momentum and both the MACD line and the MACD signal line have crossed above the zero line with a good spread between them. From the MACD formation, it can be suggested that WIF’s price might move upward even further.
Future Actions
Currently, there are two resistance levels of .34 and .86 ahead of price. Should the price continue to move upward and break above the .34 level, it might move further to test the .86 resistance level. Also, if it breaks this level, it might trigger a rally to create a new high.
However, if the price fails to break through at any of these resistance levels, it might start a downward correction toward the .25 support level. A break below this level might cause a deeper correction to test the .78 support level.
Standard Chartered Analyst Says Bitcoin Is Set For A New ATH Above $73,700, You Won’t Believe The Timeline
Analysts from leading international cross-border bank, Standard Chartered have made a bold prediction that Bitcoin could witness a significant rise to new all-time highs above ,700. This projection, slightly higher than the cryptocurrency’s previous peak, comes with an unexpected and wholly ambitious timeline.
Bitcoin Poised To Reach New All-Time Highs
Geoff Kendrick, Head of EM FX Research, West and Crypto Research, Standard Chartered, has made a bullish prediction for Bitcoin, the world’s largest cryptocurrency. In an email to TheBlock, Kendrick stated that Bitcoin is poised to break out of its previous all-time high on March 14, 2024, to witness a massive surge to approximately ,798.
The analyst has projected a rather grandiose timeline for this bullish rally, expecting Bitcoin to hit the forecasted price target by the weekend. Kendrick attributed this potential price increase to the recent inflows into Spot Bitcoin ETFs.
Earlier on May 21, data from Farside investors indicated that Spot Bitcoin ETFs had recorded their best inflow week in the last two months. The digital asset saw over 5.7 million in inflows, with BlackRock’s Bitcoin Trust ETF (IBIT), amassing the largest inflows of 0 million.
Cumulatively, Spot Bitcoin ETFs have recorded inflows of more than billion from its launch on January 11 to the present. This increased demand and influx of capital which had been a major contributor to Bitcoin’s previous rise to a new all-time high in March, could propel fresh surges for the cryptocurrency.
Kendrick has also disclosed that the possible approval of Ethereum Spot ETFs by the United States Securities and Exchange Commission (SEC) could have a significant impact on Bitcoin’s price dynamics. The analyst has doubled down on his previous price prediction which anticipates Bitcoin’s rise to 0,000 by the end of 2024 and a whopping 0,000 increase in 2025.
BTC Price Analysis
As of writing, the price of Bitcoin is trading at ,013, reflecting a slight decline of 1.39% in the last 24 hours, according to CoinMarketCap. The cryptocurrency has been on a steady bullish momentum over the past week, experiencing consistent price surges, which have led to a sharp increase of 12.86%.
Popular crypto analyst, Michael van de Poppe has reported that Bitcoin is up more than 20% since its previous lows of ,000 earlier this year. The approval of an Ethereum Spot ETF could see the cryptocurrency’s price potentially rising more, following previous patterns when the SEC’s approval of Spot Bitcoin ETFs triggered a major price spike for the pioneer cryptocurrency.
This sentiment for a bullish breakout is shared by crypto analyst Ali Martinez, who has asserted that Bitcoin is currently showing a strong potential for further gains, underscoring the cryptocurrency’s robust price potential and strong fundamentals.