 As of May 17, 2024, bitcoin’s price stands at ,303 with a market capitalization of .30 trillion and a 24-hour trading volume of .43 billion. Technical indicators from multiple time frames suggest a potential continuation of the bullish trend, albeit amidst notable market volatility. The convergence of moving averages and oscillators signals a strong upward […]
Bitcoin News
Bitcoin Price Approaches Breakout, Can BTC Pump Above $66K?
Bitcoin price recovered and climbed above the ,000 resistance zone. BTC is now facing hurdles near the ,500 and ,000 levels.
- Bitcoin is now struggling to gain pace for a move above the ,500 resistance zone.
- The price is trading above ,000 and the 100 hourly Simple moving average.
- There is a key contracting triangle forming with resistance at ,100 on the hourly chart of the BTC/USD pair (data feed from Kraken).
- The pair could start a fresh surge if it clears the ,500 resistance zone.
Bitcoin Price Starts Increase
Bitcoin price found support above ,000 and started a fresh increase. BTC climbed above the ,500 and ,500 resistance levels. The bulls even pushed the price above the ,000 level.
However, the bears seem to be active near the ,500 zone. The recent high was formed at ,598 and the price is now consolidating gains. There was a drop below the ,000 level, but the price is still above the 23.6% Fib retracement level of the upward move from the ,666 swing low to the ,598 low.
Bitcoin price is trading above ,000 and the 100 hourly Simple moving average. Immediate resistance is near the ,100 level. There is also a key contracting triangle forming with resistance at ,100 on the hourly chart of the BTC/USD pair.
The first major resistance could be ,500. The next resistance now sits at ,000. If there is a clear move above the ,000 resistance zone, the price could continue to move up. In the stated case, the price could rise toward ,500.
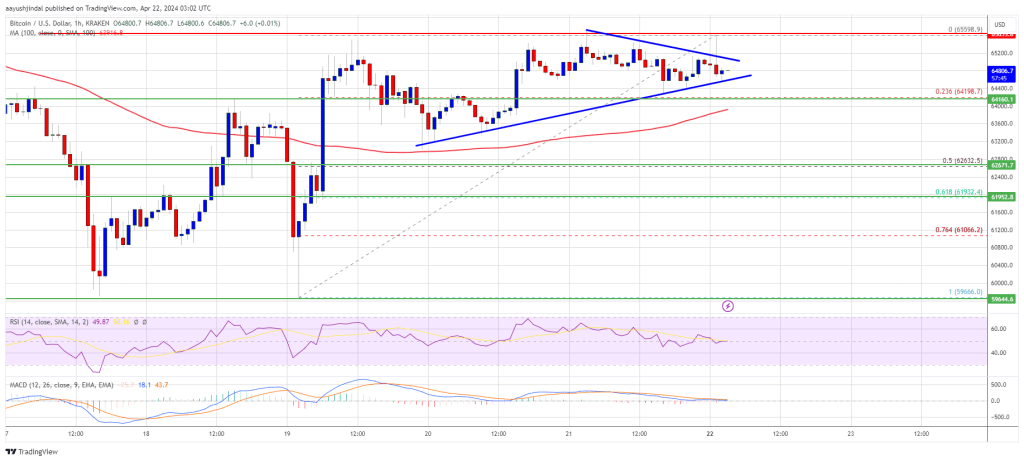
Source: BTCUSD on TradingView.com
The next major resistance is near the ,500 zone. Any more gains might send Bitcoin toward the ,000 resistance zone in the near term.
Downside Correction In BTC?
If Bitcoin fails to rise above the ,500 resistance zone, it could start a downside correction. Immediate support on the downside is near the ,500 level.
The first major support is ,000. If there is a close below ,000, the price could start to drop toward the 50% Fib retracement level of the upward move from the ,666 swing low to the ,598 low at ,500. Any more losses might send the price toward the ,200 support zone in the near term.
Technical indicators:
Hourly MACD – The MACD is now losing pace in the bullish zone.
Hourly RSI (Relative Strength Index) – The RSI for BTC/USD is now near the 50 level.
Major Support Levels – ,500, followed by ,000.
Major Resistance Levels – ,100, ,500, and ,000.
Bitcoin Price Dumped To $66K As Bears Gain Strength, $64K Next?
Bitcoin price started another decline from the ,000 resistance zone. BTC is down over 5% and there was a move below the ,500 support.
- Bitcoin price is gaining bearish momentum from the ,000 resistance zone.
- The price is trading below ,500 and the 100 hourly Simple moving average.
- There is a key bearish trend line forming with resistance near ,400 on the hourly chart of the BTC/USD pair (data feed from Kraken).
- The pair could extend its decline toward the ,000 support zone in the near term.
Bitcoin Price Turns Red
Bitcoin price struggled to settle above the ,000 resistance zone. BTC reacted to the downside after it broke the ,200 support zone. There was a sharp move below the ,500 level.
The price even declined below the ,000 level. Finally, it tested the ,000 with a bearish angle. A low was formed near ,992 and the price is now attempting a recovery wave. There was a move above the ,800 level.
The price moved above the 23.6% Fib retracement level of the downward move from the ,884 swing high to the ,992 low. However, Bitcoin is now trading below ,500 and the 100 hourly Simple moving average. There is also a key bearish trend line forming with resistance near ,400 on the hourly chart of the BTC/USD.
Immediate resistance is near the ,000 level. It is close to the 50% Fib retracement level of the downward move from the ,884 swing high to the ,992 low. The first major resistance could be ,500 and the trend line. If there is a clear move above the ,500 resistance zone, the price could start a fresh increase.
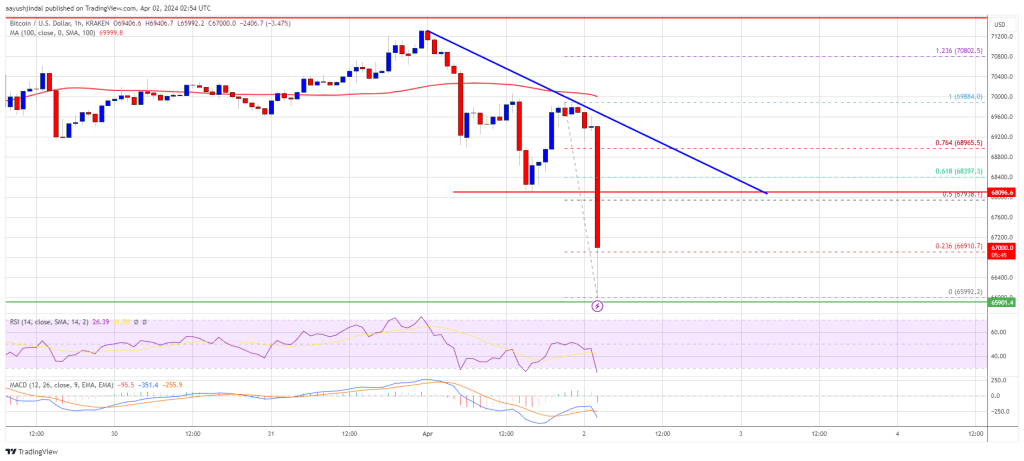
Source: BTCUSD on TradingView.com
In the stated case, the price could rise toward the ,000 resistance zone in the near term. The next major resistance is near the ,500 zone.
More Losses In BTC?
If Bitcoin fails to rise above the ,000 resistance zone, it could continue to move down. Immediate support on the downside is near the ,000 level.
The first major support is ,000. The next support sits at ,000. If there is a close below ,000, the price could start a drop toward the ,500 level. Any more losses might send the price toward the ,500 support zone in the near term.
Technical indicators:
Hourly MACD – The MACD is now gaining pace in the bearish zone.
Hourly RSI (Relative Strength Index) – The RSI for BTC/USD is now below the 50 level.
Major Support Levels – ,000, followed by ,000.
Major Resistance Levels – ,000, ,500, and ,000.
Bitcoin Eyes Fresh Rally, Why Close above $66k Is Important
Bitcoin price recovered losses and climbed above ,000 against the US Dollar. BTC must climb above the ,350 zone to start a fresh rally in the near term.
- Bitcoin started a fresh increase from the ,500 support zone.
- The price is now trading above ,000 and the 100 hourly simple moving average.
- There was a break above a key bearish trend line with resistance near ,000 on the hourly chart of the BTC/USD pair (data feed from Kraken).
- The pair could start a fresh increase if there is a clear close above ,000.
Bitcoin Price Faces Resistance
Bitcoin price remained well bid near the ,500 zone. As a result, BTC started a fresh increase above the ,000 resistance zone. There was a clear break above the ,000 resistance and the 100 hourly simple moving average.
Besides, there was a break above a key bearish trend line with resistance near ,000 on the hourly chart of the BTC/USD pair. The pair climbed above the 50% Fib retracement level of the main decline from the ,762 swing high to ,300 low.
On the upside, an immediate resistance is near the ,000 level. The first major resistance is near the ,400 level. It is close to the 61.8% Fib retracement level of the main decline from the ,762 swing high to ,300 low.
Source: BTCUSD on TradingView.com
A clear break above ,350 resistance may possibly call open the doors for a fresh increase. The next major resistance sits near the ,000 level, where the bears might take a stand. An intermediate resistance for the bulls may possibly be near the ,250 level.
Fresh Decline in BTC?
If bitcoin fails to clear the ,350 resistance zone, it could start a fresh downside correction. An immediate support on the downside is near the ,200 level.
The first major support is now forming near the ,000 level and the broken trend line. Any more losses could lead the price towards the ,500 level. The next major support is near the ,000 level, below which the price could even decline below the ,500 support zone.
Technical indicators:
Hourly MACD – The MACD is now losing pace in the bullish zone.
Hourly RSI (Relative Strength Index) – The RSI for BTC/USD is now well above the 50 level.
Major Support Levels – ,200, followed by ,000.
Major Resistance Levels – ,000, ,350 and ,000.