 Steno Research, an independent macroeconomics, geopolitical, and crypto research house, has predicted that the spot ether ETF, presumed to start trading in early July, will take ETH to ,500. Steno’s latest post on the subject forecasts that Ether ETFs will perform better than leading analysts have predicted, bringing up to billion in inflows this […]
Bitcoin News
Why Marathon Is Comfortable With Bitcoin Plunging, Says BEP Is $6,500
Marathon Digital Holdings’ (MARA) Fred Thiel said that Bitcoin price would need to drop 80% for the coin to stop being profitable for the company thus entering a challenging situation. Marathon is not worried about the past week’s dip.
During a Bloomberg QuickTake Stock interview, Fred Thiel, Las Vegas-based company’s chief executive officer of Marathon, expressed assurance for Bitcoin’s future and stated that Bitcoin mining is “obviously a very profitable business” and the company can “ride this market for quite a long time.”
Thiel expressed that, factoring operational mining costs (energy plus hosting), Bitcoin’s breakeven rate is roughly ,500, meaning that the digital coin would need to drop at least 80% for Marathon to face challenging difficulties, so the price of Bitcoin plunging under ,000 still translates into profits for them.
What’s not in that cost, if you would, is the depreciation in the miners that we buy. We depreciate our miners over five years, so the payback on that is less than a year at today’s margins. (…) We are a very small team from an operational overhead perspective, so that gets covered very quickly.
Thiel stated those costs are a very comfortable place for the company to be at and believes that Marathon is “one of the most efficient miners in the industry today” because of their agile model that focused on investing in “the miners that produce the maximum return”.
Related Reading | Marathon Digital Holdings Reported A 17% Spike In Bitcoin Mining
Are Miners Selling Their Bitcoin?
Amidst Bitcoin’s bumpy week, speculative comments on social media say that many miners have been selling their BTC the past few days. Bloomberg reporters asked Thiel about the company’s own decision after seeing that the coin dropped below 60k. Thiel responded that they are a long-term holder of Bitcoin and are not planning on selling.
We went into the market in January and bought 0 million of Bitcoin and investment has paid off very handsomely for us. We bought it at an average price of ,000. So Bitcoin where it is today has paid off very nicely. But we intend to be a long-term holder.
Bitcoin trading at ,156 in the daily chart | Source: BTCUSD on TradingView.com
Thiel shared the company is optimistic about Bitcoin’s future. They firmly believe that “as a limited supply asset” its value and popularity will keep on rising, and the daily headlines “about new use cases and more uses” backs that optimism.
He also called the U.S. “a very interesting center for Bitcoin mining” because of its excess of energy, opposed to Europe’s situation, and explained that “Some Bitcoin miners need to sell their Bitcoin holdings just to cover their operations”, not worried about the speculations.
Related Reading | Bitcoin Mining Raises Marathon Digital’s BTC Holds To 7M
What’s The Future Of Marathon’s 0M Offering
After Marathon’s debt increase of 0 million that aggregates to the previous 0 million offering size, Thiel shared the decision was taken in order to have “cash on the balance sheet” and stay in “a position of liquidity” so they can potentially take advantage of opportunities in the marketplace that could accelerate their growth, like buying more miners, miner companies that could grow their mining capacity, or invest on improving their mining operation’s energy efficiency.
He further stated that the company is not interested in using the bonds to buy Bitcoin in the open market because they produce it, “unless there are some pricing opportunities” like a ,000 drop, but they would still be carefully looking into the projections since they want to be “very good custodians” of their shareholders’ capital.
Marathon Digital Holdings, Inc. shares at ,46 in the daily chart | Source: MARA on TradingView.com
NewsBTC
Bitcoin is Forming a Bull Cross After Rallying to $6,500; Analysts Now Targeting $7,700
Following a brief selloff that led Bitcoin down to lows of ,800 overnight, the crypto has been able to post a strong and sustainable rebound that has since led it to climb towards ,500, with bulls currently attempting to reclaim its previous position within the upper-,000 region.
It now appears that bulls are in the process of attempting to form an EMA bull cross, which could bolster its price action in the hours ahead.
Furthermore, bulls are also attempting to surmount a key resistance level that was recently established, leading one analyst to note that a weekly close above this level could lead it to rally up towards ,700.
Bitcoin Sees Massive Rebound as Bulls Post Ardent Defense of ,800
At the time of writing, Bitcoin is trading up just under 10% at its current price of ,490, which marks a notable climb from daily lows of ,800 that were set overnight following the crypto’s break below ,000.
It now appears that the benchmark cryptocurrency is pushing up against key resistance at ,500, with a break above this level potentially opening the gates for significant near-term upside.
As for what could push BTC above this resistance, Big Cheds – a popular cryptocurrency analyst on Twitter – explained in a recent tweet that he believes it is flexing a “potential 8/34 EMA bull cross” on its 4-hour chart.
“Bitcoin 4 hour -Flexing a potential 8/34 EMA bull cross,” he noted while pointing to the chart seen below.
$BTC #Bitcoin 4 hour -Flexing a potential 8/34 EMA bull cross pic.twitter.com/J6nJldbVUe
— Big Cheds (@BigCheds) March 30, 2020
This formation could significantly bolster the crypto’s near-term price action if it is confirmed in the coming several hours.
BTC Pushes Past Key Resistance Level; Opening the Gates for a Move to ,700
As for how high a confirmed break of the current resistance that Bitcoin is facing could send it, one analyst is noting that he is eyeing a movement up towards ,700.
Teddy, another popular cryptocurrency analyst on Twitter, recently shared a chart showing two potential paths for the crypto, noting that it is currently in the process of taking the bullish route.
“Looks like BTC picked the green way,” he said while pointing to the below chart.
Looks like $BTC picked the green way pic.twitter.com/JZHUdaFII1
— Teddy (@TeddyCleps) March 30, 2020
The upside target seen on the chart he references exists at roughly ,700, which would mark a notable climb from where BTC is currently trading at.
Featured image from Shutterstock.
NewsBTC
Bitcoin Just Surged to $6,500 After Over 10% Weekend Crash
In the past 20 minutes, Bitcoin has traded above ,500, marking a rapid 12% gain from the ,800 bottom seen on Sunday evening (UTC).
Due to this move, the BitMEX funding rate on the Bitcoin (XBT) contract surged by 990%, according to data from Joe McCann, a cryptocurrency trader and AI/cloud specialist at Microsoft. According to him, this means “bulls [are] getting levered up here,” potentially setting the stage for a long squeeze in the future.
Analysts are currently divided over what this means for the cryptocurrency; just 24 hours ago, many were charting a move to the low-,000s, citing the fact that it slipped below a number of supports as if it was a hot knife going through butter.
According to prominent crypto trader Flood, who called the recent move from ,800 ,200, Bitcoin is likely to retest ,000 in the near future.
We shorted, now we long to 8k pic.twitter.com/zmYQm2psQZ
— Flood [BitMEX] (@ThinkingUSD) March 28, 2020
Featured Image from Shutterstock
NewsBTC
Here’s Why Bitcoin’s 15% Rally Could Fail Near The Key $6,500 Barrier
Bitcoin is up more than 15% and it broke the ,000 resistance against the US Dollar. However, BTC price is now facing a huge barrier near the ,400 and ,500 levels.
Bitcoin managed to rise above the ,800 and ,000 resistance levels against the US Dollar.
The price is up more than 15% and it is now approaching the key ,500 resistance.
There is a major bearish trend line forming with resistance near ,000 on the daily chart of the BTC/USD pair (data feed from Kraken).
The bulls are likely to fail near the key ,400 and ,500 resistance levels.
Bitcoin Price is Facing Huge Barrier
After a massive decline, bitcoin found support near the ,000 level. BTC price started a decent recovery above the ,500 and ,000 resistance levels. Later, it started consolidating in a range above the ,000 support.
Recently, it gained pace above the ,500 and ,800 resistance levels. The price even surpassed the 23.6% Fib retracement level of the last key decline from the ,203 high to ,919 low.
It is now trading nicely above the ,000 resistance level. However, there are a few key barriers near the ,400 and ,500 levels (the previous breakdown zone). The 50% Fib retracement level of the last key decline from the ,203 high to ,919 low is also near the ,550 level.
Bitcoin bulls are likely to face a strong selling interest near the ,400 and ,500 levels. If they succeed in gaining pace above the ,500 level, the price could recover further towards the ,000 resistance.
Bitcoin Price
There is also a major bearish trend line forming with resistance near ,000 on the daily chart of the BTC/USD pair. A close above ,000 is needed for a medium term trend change.
Just Another Correction?
The recent 15% could be just another correction in bitcoin. If it fails to gain strength above the ,500 resistance, there are chances of a fresh decline.
An initial support is near the ,000 level (the recent breakout zone). The main support is now near the ,500 level, below which the bears are likely to aim a test of the ,000 support.
Overall, the price is reaching a huge barrier near ,500 and it could either continue towards ,000 or start a fresh decline towards ,000.
Technical indicators:
Daily MACD – The MACD is likely to move into the bullish zone.
Daily RSI (Relative Strength Index) – The RSI for BTC/USD is now recovering towards the 40 level.
Major Support Levels – ,000 followed by ,500.
Major Resistance Levels – ,400, ,500 and ,000.
NewsBTC
Bitcoin Price is Poised to Return to $6,500 Lows; Analysts Explain Why
This week has been quite a tumultuous one for the Bitcoin market. As of the time of writing this, the cryptocurrency is effectively flat on the week, posting a slight loss of 1%. But this statistic hides the truth: this week has seen BTC undergo two 10% swings, one to the downside, then another to the upside, all within the span of a few days.
Related Reading: Bitcoin Exchange Outflow Spikes to 6M in 1 Day: Is Accumulation Starting?
Bitcoin’s latest bout of volatility has made the cryptocurrency put in a new six-month low at ,400, plunging to that price point early Wednesday as bulls failed to step in. While BTC is now trading at ,200, having recovered 10% as aforementioned, analysts are sure that a retest of these lows is an inevitability.
Here’s more on why.
Why BTC May Soon Retest ,500
Cantering Clark, a prominent cryptocurrency trader, recently remarked that the current price action is rather reminiscent of the infamous 42% “China pump” that brought BTC to ,500. Indeed, as Clark depicted below, the two moves were of very similar structure, with there being a strong dump to precede a strong recovery to historical resistance levels, to then stop rallying there.
All I see is a weaker version of what we had before, because we likely have shorts that have been sitting in better positioning from earlier PA.
i.e. Squeeze was less crowded = Less fuel
Commence a series of head-fakes, and slow drift back down to the low.$BTC pic.twitter.com/Xpshz3Igbs
— Cantering Clark (@CanteringClark) December 20, 2019
Noting this similarity, the analyst concluded that there is a good likelihood that there will be a “series of head-fakes,” then a “slow drift back down to the lows” of ,400-,500 in the coming weeks.
It isn’t only Cantering Clark who believes that a move to return to these lows is possible. Crypto analyst Mac noted in the wake of this spike upwards that the Money Flow Index has started to taper off as BTC failed to surmount a key horizontal resistance at ,400, BitMEX contract funding has reset in favor of bears, and the Open Interest indicator has hit a local bottom, implying that shorts may soon start rebuilding positions.
$BTC – Already showing big weakness
> MFI LTF is done
> x2 weekly + stops raided
> Funding already reset
> OI local bottom and been increasing last -1%Ssssshort pic.twitter.com/UqrSnnmOvL
— Mac
(@MacnBTC) December 19, 2019

Related Reading: Bitcoin at 0k? Analysts Weigh in on Draper’s “Bizarro” Call
Is Bitcoin’s Uptrend Intact?
While the short-term outlook may look harrowing once again, many assert that 2020 will still be a great year for the cryptocurrency market.
TokenDaily recently released a report titled “THE 2020 CRYPTO CRYSTAL BALL,” in which the firm published predictions from industry executives about the upcoming year for the cryptocurrency market. Many of those mentioned remarked that they expect for the 2020 halving to have a resoundingly positive effect on the Bitcoin market. The Winklevoss Twins of Gemini, for instance, said:
“The bitcoin halvening should already be priced in but isn’t (it never has been) and it therefore will catalyze a large bull run (as it always does).”
That’s not all. Thomas Thornton, a hedge fund services specialist and market analyst, recently revealed that Bitcoin’s chart with the TD Sequential Combo indicator suggests that a “buy 13” candle was just printed.
13 candles, the TD Sequential suggests, are indicative of impending price reversals; they’re also pertinent here as these same candles were registered by the TD Sequential when Bitcoin hit ,000 in December 2017 and when BTC cratered to ,150 on December 14th last year.
The historical importance of 13 candles in terms of Bitcoin’s long-term price trends implies that BTC has finally bottomed and, as such, is ready to see a strong bullish reversal from here.
Related Reading: Any Chance Of Ethereum Outperforming BTC Dies With A Break of Current Levels
Featured Image from Shutterstock
The post Bitcoin Price is Poised to Return to ,500 Lows; Analysts Explain Why appeared first on NewsBTC.
Bitcoin Just Dropped Below $6,500: Why It’s Risking a Big Fall to $5,000
- Bitcoin has closed below its long-term support as it dropped to ,430 on BitMEX.
- The breakdown brings the cryptocurrency’s 200-weekly moving average in view as the next pullback target.
- The said MA in December 2018 had capped the asset’s downtrend from flourishing.
- As of now, it sits near the lower-,000 levels.
Bitcoin risks plunging to its eight-month low after closing below a crucial support level earlier last week and dropping to the ,400s.
The benchmark cryptocurrency invalidated its 50-weekly moving average support for the first time since May 2018. The historical level confirmed bitcoin’s long-term bullish bias in periods when the price was trending above it.
Conversely, it alarmed traders about imminent bearish corrections when the price slipped below it.
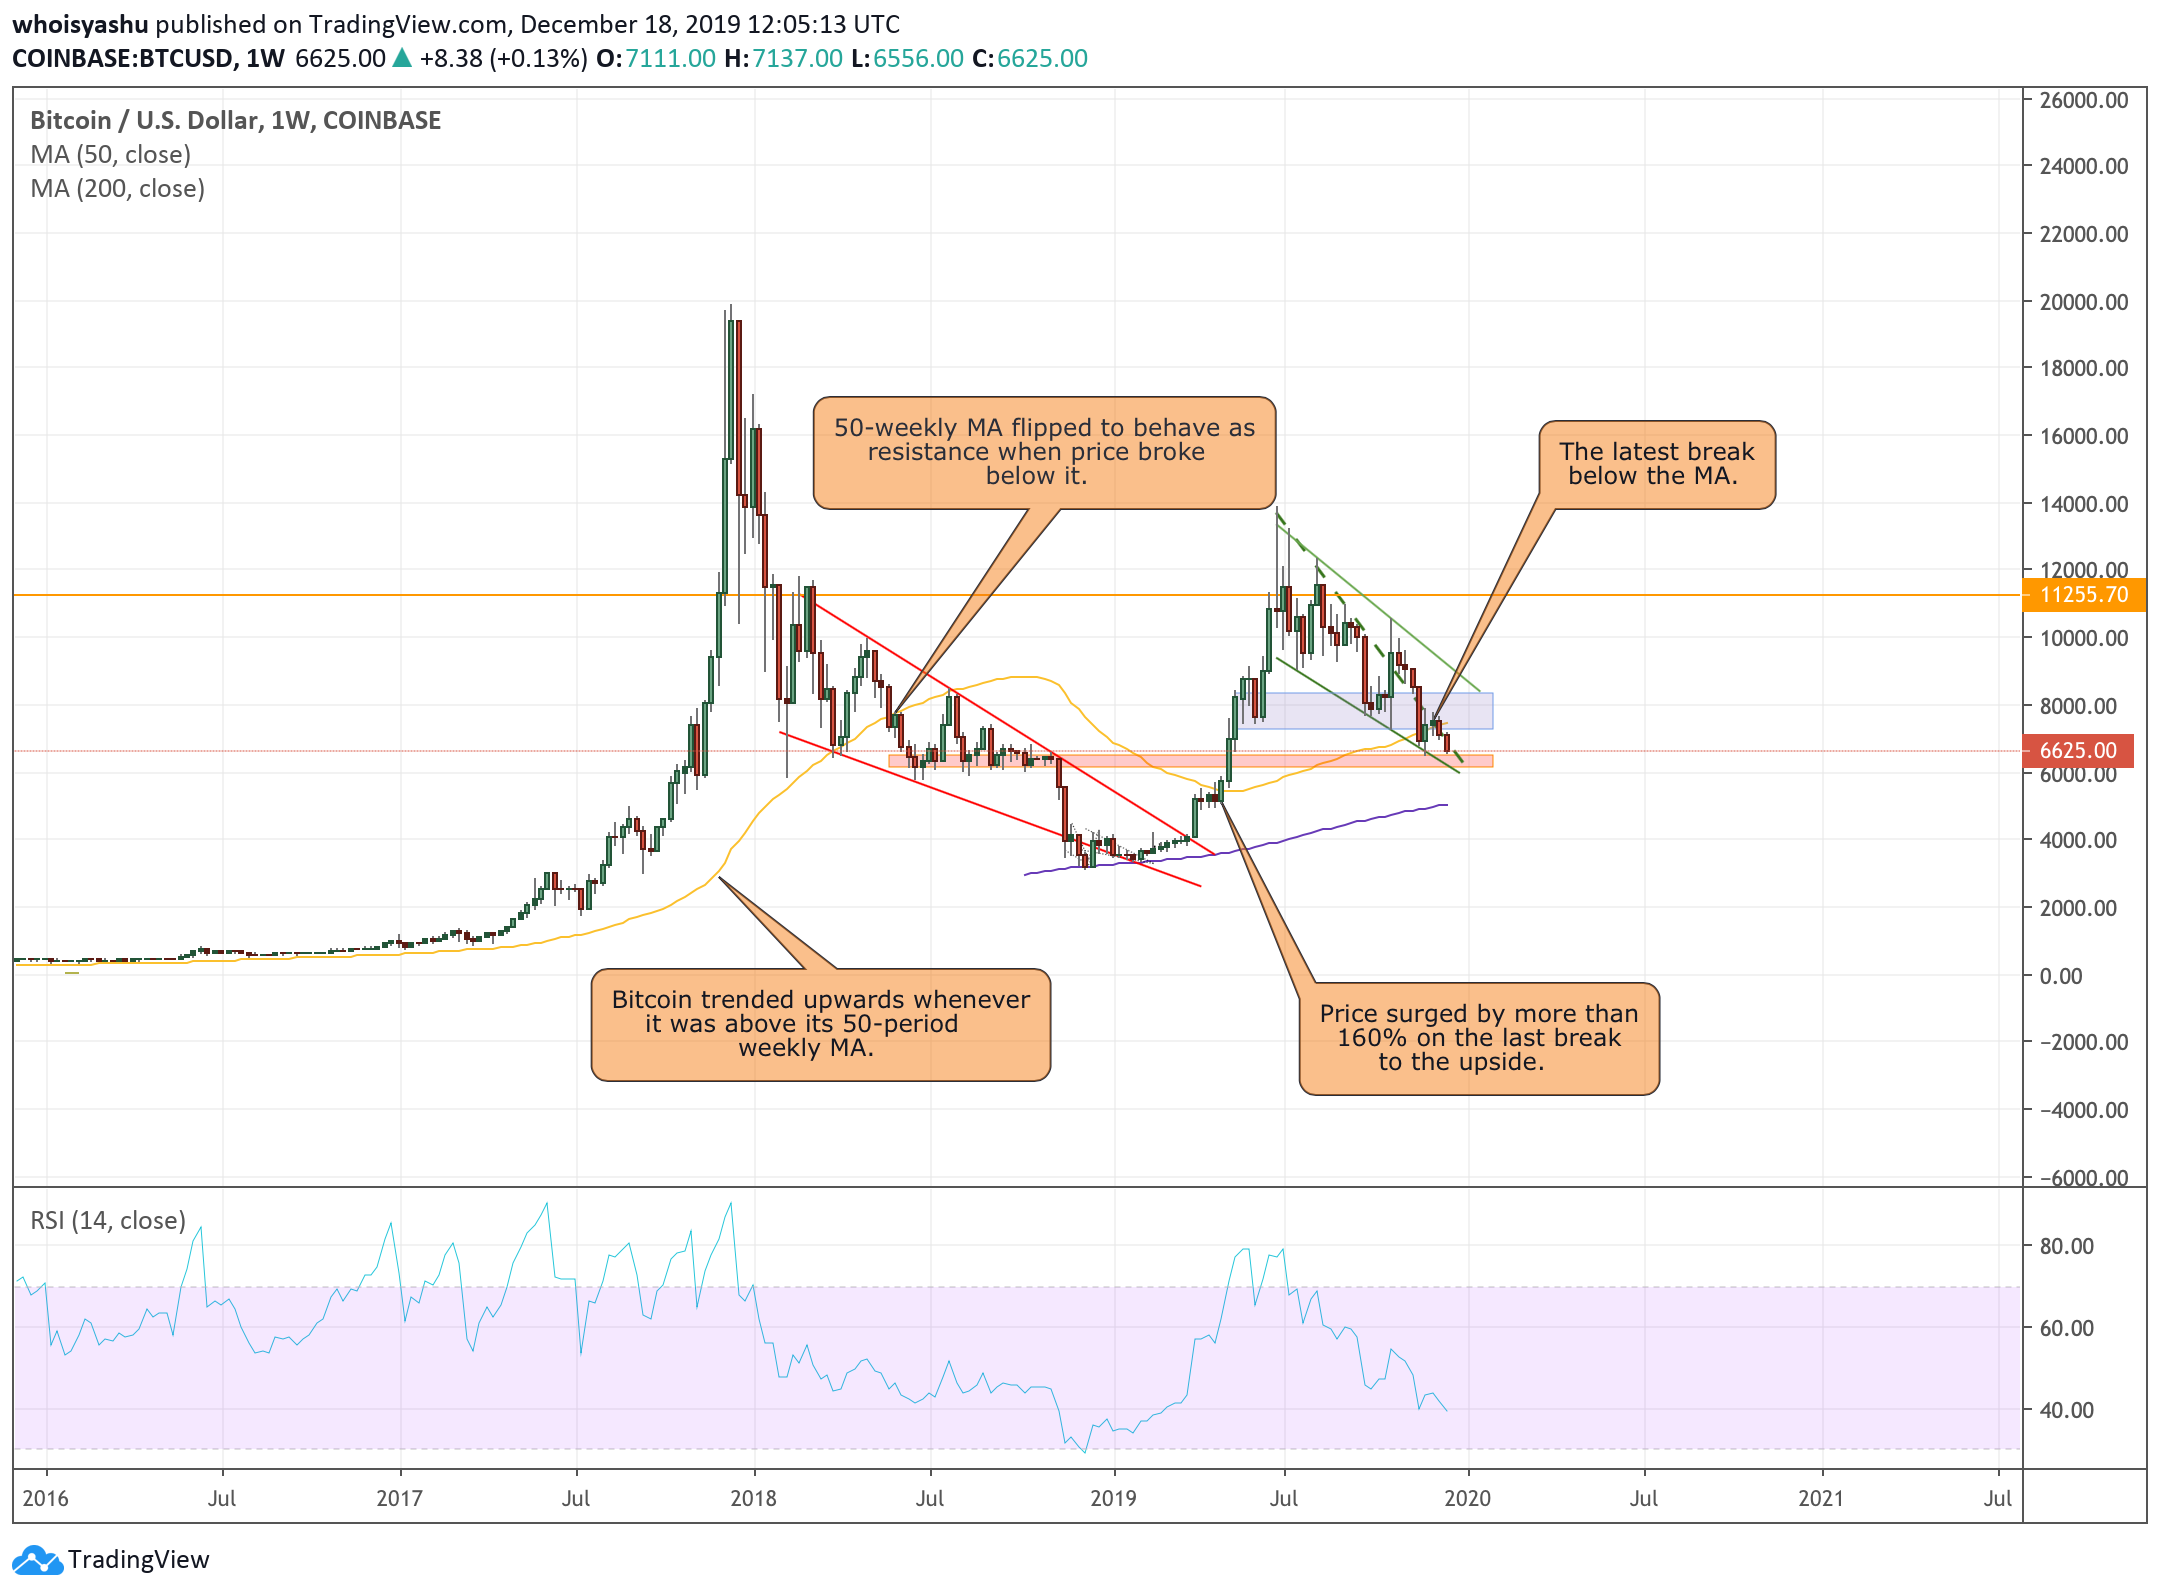
The role of 50-period MA in bitcoin’s recent price behaviors | Source: TradingView.com, Coinbase
The last time bitcoin closed below the 50-weekly MA had resulted in a price drop of approx 61.39 percent. On the other hand, when the cryptocurrency broke above the MA, it rallied by as much as 161.79 percent to the upside (data from Coinbase).
Bearish Bells
With bitcoin dropping below the 50-weekly MA, the sentiment for an extended downside move is increasing in the long-term.
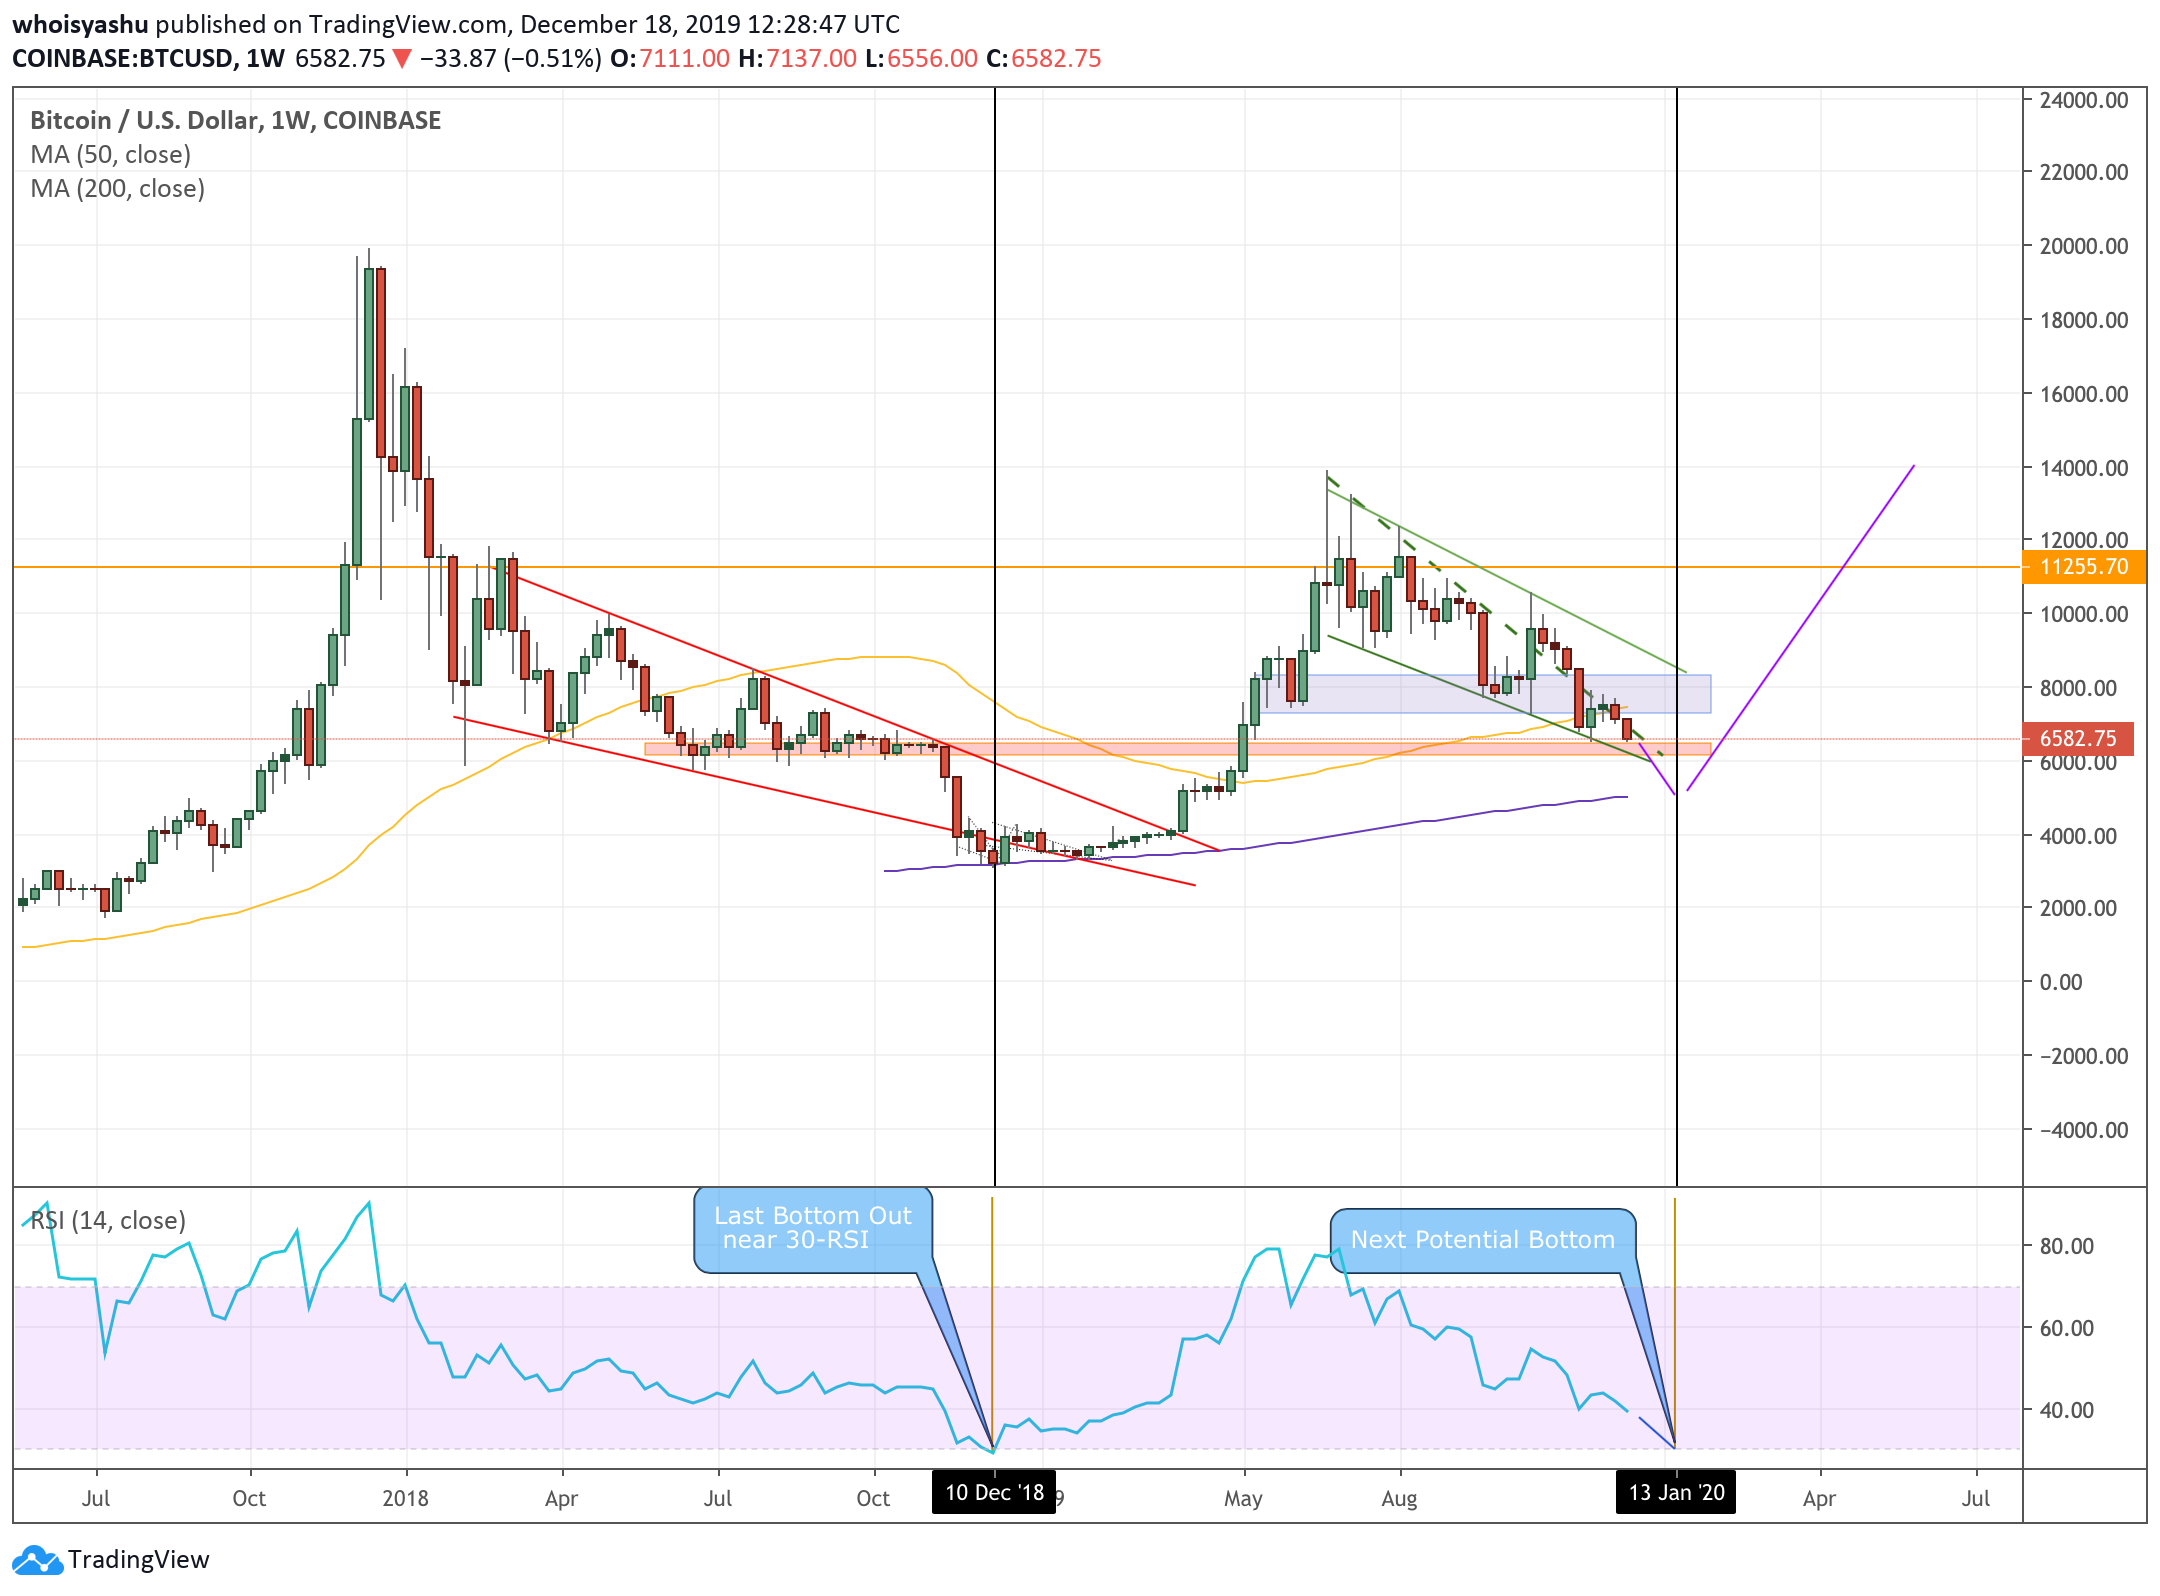
The latest breakdown has brought the cryptocurrency’s 200-weekly moving average in view as the next potential downside target. It is largely because of the level’s historical significance while capping bitcoin’s wild bearish move from flourishing in December 2018.
The 200-weekly MA assisted the cryptocurrency in bottoming out near ,120 last year. After that, its price surged by as much as 343.24 percent – towards a ,868.44 top. So it appears, the MA could again behave as support to bitcoin’s ongoing downside attempts.

The next potential bottom for bitcoin | Source: TradingView.com, Coinbase
As of the time of this writing, the 200-weekly MA sits near ,026.38.
Bitcoin will soon be oversold
The weekly Relative Strength Index (RSI), which evaluates bitcoin’s overbought or oversold conditions based on certain numerical readings, appears in line with the possibility of an extended breakdown.
The current RSI reading is 40, which shows bitcoin is only ten points away from becoming an oversold asset. The journey from 40 to 30 coincides with the cryptocurrency’s move from the current price to that of the 200-weekly MA.
The weekly RSI readings also hint a potential bottom formation | Source: TradingView.com
The RSI downtrend also indicates a potential reversal near 30 based on historical behaviors. That further validates 200-weekly MA as the level that could serve as bottom to bitcoin’s current downtrend.
[Disclaimer: Cryptocurrency trading involves ample risk of loss and is not suitable for every investor. All trading strategies are used at your own risk.]
The post Bitcoin Just Dropped Below ,500: Why It’s Risking a Big Fall to ,000 appeared first on NewsBTC.
Why Bitcoin’s Plunge to $6,500 Might Have Been the Bottom
Bitcoin has had a crazy past 12 months. Since bottoming at ,150 on December 15th, 2018, the cryptocurrency has bounced back. Hard. By June, a coin was trading for ,000 a piece, up hundreds of percent since the year started.
Related Reading: Why There Remains a Case For a ,200 Bitcoin (BTC) in 2020
Now though, Bitcoin is trading for ,200 — a far cry from the five-digit price point we all saw earlier this year. The purported reasons for the fall are all over the map: some say it was the PlusToken scam, others say BTC just underwent an “echo bubble,” rallying and collapsing in quick succession as if it was trading in a condensed market cycle.
Whatever the case, investors are waiting for the cryptocurrency to show signs of bottoming, so the next market cycle can begin. While some say that the bottom is far below current prices — as low as ,100, or maybe even lower — a few analysts have claimed that there is a high likelihood ,500 was it for bears. Here’s more on why.
Bitcoin Fractal Suggests Bottom in At ,500
Just last month, Bitcoin fell as low as ,500 in a massive sell-off. Analysts say that this price action, coupled with the action preceding this move, may satisfy a fractal of the December 2018 bottom, meaning that the pain for the cryptocurrency market may be ending.
Popular trader Jonny Moe recently noted that the price action seen from December 2018 to now is structurally very similar to the entire 2016-2018 market cycle, with there being a parabolic run-up, a descending triangle consolidation, a breakdown of that triangle into capitulation, a then a five-wave bottoming process.
*takes a deep hit of the hopium*
Who's with me???$BTC pic.twitter.com/qjl7C7tsdN
— Jonny Moe (@JonnyMoeTrades) December 11, 2019
This isn’t the only time such sentiment has been proposed over the past few days. Per previous reports from NewsBTC, Cantering Clark recently observed an “uncanny resemblance” between the BTC price action seen over the last few days and the December 2018 accumulation phase.
There is an uncanny resemblance between these two charts.
It would make sense that after the first major move up, that the first major correction and following accumulation period would have a fractal resemblance to the larger original.
The purpose is still the same.$BTC pic.twitter.com/eRQA9PRJSZ
— Cantering Clark (@CanteringClark) December 9, 2019
The fractals suggest that the pain ended when Bitcoin hit ,500, and that a new parabolic phase may begin to form next year.
Even Bloomberg agrees with the ,500 was the bottom sentiment.
Bloomberg recently wrote that with Bitcoin’s price stabilizing “above its support level of the initial [CME futures] gap created on May 10,” there’s potential that a bottom was marked in the ,500 range, which the cryptocurrency breached late last month shortly after tumbling under ,000 after hitting ,500 in the now-infamous “China pump.”
Related Reading: Crypto Tidbits: Deutsche Bank Gives Nod to Bitcoin, EOS to Host Social Media, France Digital Currency
Fundamentals Agree
The fundamentals seemingly agree with the bullish sentiment.
Mike McGlone, an analyst at the firm, said that it is “only a matter of time” before the cryptocurrency breaches through resistance, the most notable of which being the horizontal and psychological resistance at ,000.
McGlone backed this optimistic quip by looking to a potential rally in gold, which he claims would boost the Bitcoin bull narrative, as such a rally would be caused by macroeconomic turmoil, something analysts say is beneficial for alternative assets as a whole. He also looked to growing levels of adoption in the cryptocurrency space coupled with the idea that the impending halving will act as a negative supply shock for Bitcoin’s market economics.
Related Reading: Last Weekly Golden Cross Led Bitcoin to Rally 75% Rapidly; Will the Same Happen Now?
Featured Image from Shutterstock
The post Why Bitcoin’s Plunge to ,500 Might Have Been the Bottom appeared first on NewsBTC.
Analyst: Bitcoin Could Dump to $6,500 to Maintain Price Parabola
As the Bitcoin consolidation continues, traders and analysts are scouring the charts again looking for the next direction. In the short term most are of mixed opinion but one analyst has predicted a big fall before any upward price momentum is resumed.
Bitcoin Biding Its Time
For more than two months now BTC has been range bound between mid-,000s and low ,000s. The channel appears to be tightening with very little movement over the past week, but this has happened before. Price action is not linear and the asset is still highly volatile which means a larger swing could occur before any confirmed trend direction takes place.
Trader and analyst ‘dave the wave’ has maintained that in order to stick to its growth curve, Bitcoin will need to fall back first.
“Some are wondering why BTC can’t do sideways for a significant period of time [across to the growth curve at this level]. Problem is BTC is volatile and doesn’t do sideways for long. This parabola and correction has always been about chewing up time for it to meet the curve imo”
Some are wondering why BTC can't do sideways for a significant period of time [across to the growth curve at this level]. Problem is BTC is volatile and doesn't do sideways for long. This parabola and correction has always been about chewing up time for it to meet the curve imo pic.twitter.com/c3qBiu853F
— dave the wave (@davthewave) September 9, 2019
A move back to that curve would send prices back to the mid-,000 price range. Coincidentally this was the most traded price for BTC during 2018. A move of this magnitude would mark a correction of over 50% and put Bitcoin back into bear market territory.
The time frame also lines up with the halving event in May 2020 which is likely to be bullish. What does appear evident from the chart is a fractal pattern of a descending triangle which, as we so painfully saw last year, dumped massively upon conclusion.
Descending Triangle
As legendary investor, Peter Brandt, pointed out though, the chart pattern is not complete until it has fully played out.
“In full disclosure, I must inform you that I am long BTC as a position trader. Yet, as a swing trader I must respect classical charting principles. This descending triangle is NOT a descending triangle until it is completed.”
At the time of writing the consolidation is continuing with BTC falling back over the past few hours to around ,300 during the morning’s Asian trading session. The weekend high of ,600 could not be held as the trading range tightened. A fall back below five figures is looking imminent again but the overall pattern on longer time frames is still sideways until a major breakout occurs.
The conclusion of the descending triangle this week could provide that momentum.
Image from Shutterstock
The post Analyst: Bitcoin Could Dump to ,500 to Maintain Price Parabola appeared first on NewsBTC.
Bitcoin (BTC) Price Could Test $6,500 Before Strong Correction
- There were heavy gains in bitcoin price above the ,500 pivot and resistance level against the US Dollar.
- The price rallied above the ,700 and ,800 resistance before there was a minor downside correction.
- There is a key connecting bullish trend line in place with support at ,610 on the 4-hours chart of the BTC/USD pair (data feed from Kraken).
- The pair is currently in a strong uptrend and it could trade towards the main ,500 resistance level.
Bitcoin price gained significantly above the ,600 level against the US Dollar. BTC is likely to break the ,000 and ,250 levels before it could start a substantial downside correction.
Bitcoin Price Weekly Analysis (BTC)
This past week, there was a significant upward move in bitcoin price above the ,380 and ,400 resistances against the US Dollar. The BTC/USD pair broke the ,500 pivot and resistance level to move into a bullish zone. The bulls gained traction, resulting in a push above the ,600 and ,700 resistance levels. There was a clear break above the 76.4% Fib retracement level of the major drop from the ,645 high to ,929 swing low. The price settled well above the ,600 level and the 100 simple moving average (4-hours).
Finally, the price broke the ,700 level and the last swing high. A new 2019 high was formed near ,838 before the price started a downside correction. It seems like the price faced a strong resistance near the ,820-5,840 zone. It represents the 1.236 Fib extension level of the major drop from the ,645 high to ,929 swing low. The price corrected below the ,700 level, but dips remain well supported (as discussed yesterday). As a result, there was a strong comeback and the price surged back above ,700 and ,750.
The price is still trading below the last swing high and resistance near ,820-5,840. A convincing break above the ,820-5,840 zone is likely to set the pace for more upsides above ,000. The price could even break the ,250 level and trade towards the main hurdles at ,400 and ,500. It won’t be easy for the bulls to clear the ,500 level since it is a major pivot zone and previous support area. Therefore, there are high chances of a major downside correction if the price test ,400 or ,500.
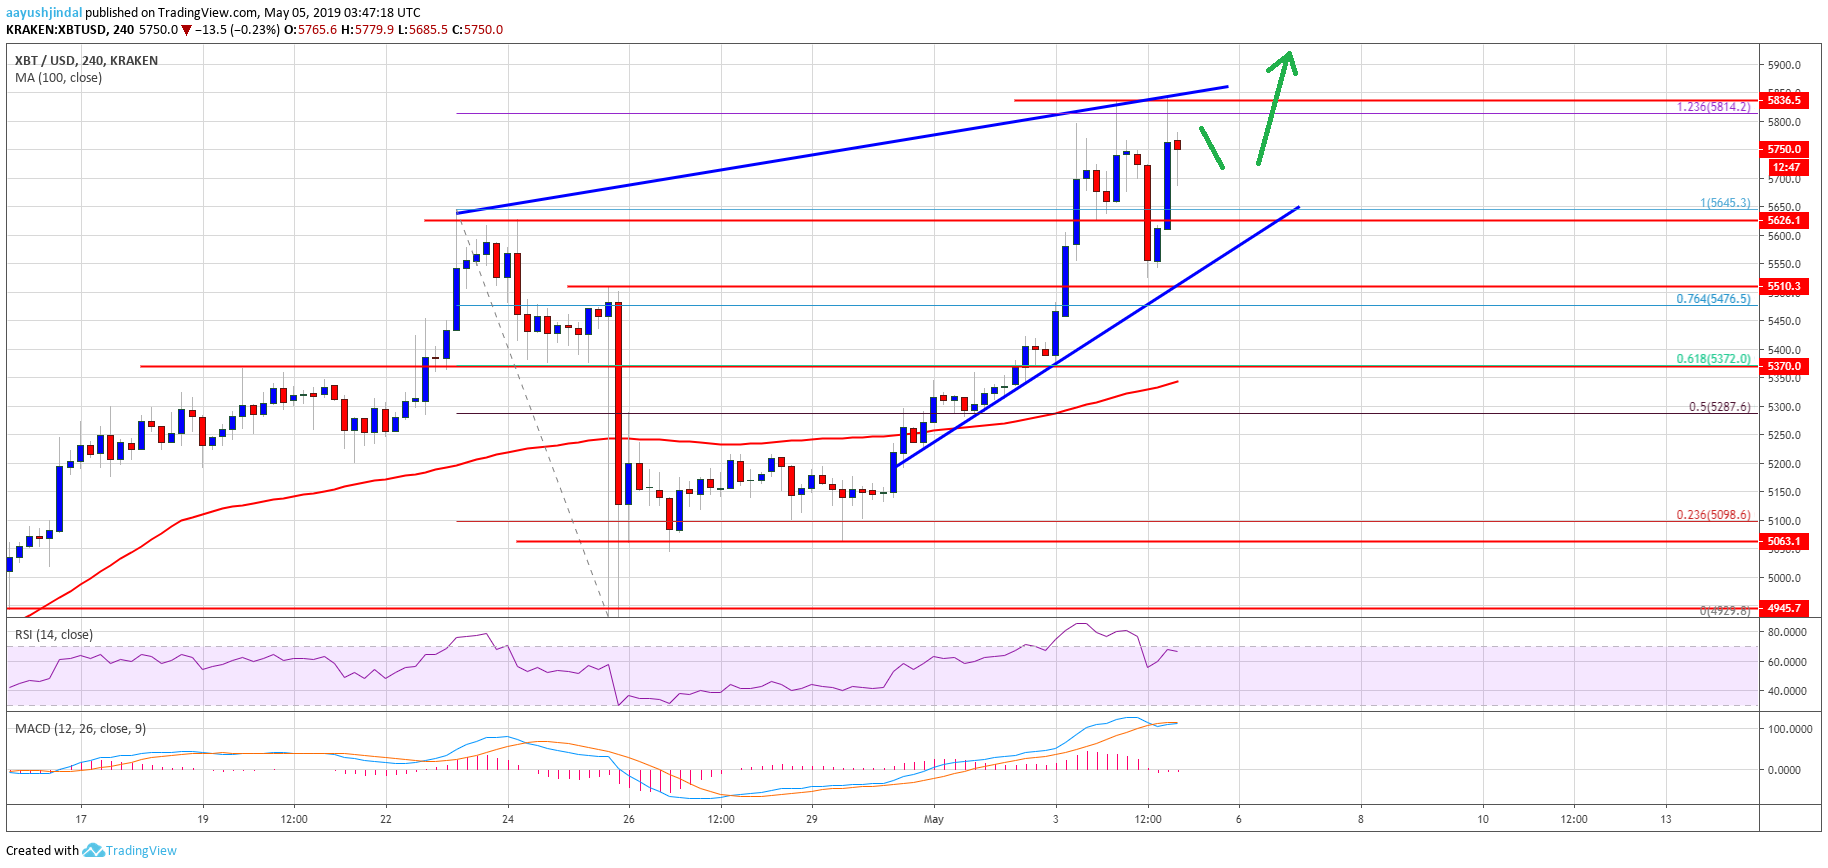
Looking at the chart, bitcoin price is clearly placed in a strong uptrend above ,600. There is also a key connecting bullish trend line in place with support at ,610 on the same chart. Therefore, dips could still be contained and the price could rally above ,000.
Technical indicators
4 hours MACD – The MACD for BTC/USD is about to move back in the bullish zone.
4 hours RSI (Relative Strength Index) – The RSI for BTC/USD is placed well above the 50 and 60 levels.
Major Support Level – ,600
Major Resistance Level – ,850
The post Bitcoin (BTC) Price Could Test ,500 Before Strong Correction appeared first on NewsBTC.