 As bitcoin weaves through its dynamic trading patterns, its valuation on Feb. 16, 2024, reveals pronounced bullish indicators. Floating within a 24-hour trading window of ,364 to ,884, the digital currency’s market worth firmly grips the .02 trillion mark. Bitcoin The volume of bitcoin’s global trades is cruising at .86 billion, showcasing a medium-to-high engagement […]
Bitcoin News
TA: Bitcoin Starts Corrective Decrease, $53K Holds The Key
Bitcoin started a downside correction from the ,700 zone against the US Dollar. BTC is correcting lower, but dips remain supported near ,000 and ,200.
- Bitcoin started a downside correction from well above the ,500 level.
- The price is now trading above ,000 and the 100 hourly simple moving average.
- There was a break below a key bullish trend line with support near ,100 on the hourly chart of the BTC/USD pair (data feed from Kraken).
- The pair could correct lower, but the bulls are likely to remain active near ,000.
Bitcoin Price Corrects Lower
Bitcoin price remained in a positive zone above the ,000 resistance. BTC even broke the ,000 resistance level and settled above the 100 hourly simple moving average.
However, the price failed to continue higher above the ,700 zone. A high was formed near ,770 before there was a downside correction. The price corrected lower below the ,200 support level. The price even traded below the 23.6% Fib retracement level of the upward wave from the ,365 swing low to ,777 high.
There was also a break below a key bullish trend line with support near ,100 on the hourly chart of the BTC/USD pair. An immediate support on the downside is near the ,500 level.
Source: BTCUSD on TradingView.com
On the upside, an initial resistance is near the ,500 level. The first major resistance is near the ,000 level, above which the price could accelerate higher. The next major resistance sits near the ,500 level. Any more gains could set the pace for a move towards the ,000 level.
Dips Limited In BTC?
If bitcoin fails to clear the ,000 resistance zone, it could continue to move down. An immediate support on the downside is near the ,500 level. The first major support is now forming near the ,100 level.
The next major support is near the ,000 level. It is near the 50% Fib retracement level of the upward wave from the ,365 swing low to ,777 high. Any more losses could open the doors for a move towards the ,500 level. The next key support sits near the ,000 level.
Technical indicators:
Hourly MACD – The MACD is now moving in the bearish zone.
Hourly RSI (Relative Strength Index) – The RSI for BTC/USD is now below the 50 level.
Major Support Levels – ,500, followed by ,000.
Major Resistance Levels – ,500, ,000 and ,500.
Why Bitcoin Could Rise To $53K, Here Are The Risks Bulls Must Overcome
Bitcoin is moving sideways in lower timeframes as the crypto markets continue to run without a clear direction. The first cryptocurrency by market cap trades at ,837 with a 1.2% loss in the daily chart.
BTC moving sideways in the daily chart. Source: BTCUSD Tradingview
BTC’s price has been moving in a tight range during the week, unable to break above ,500. Data from Santiment suggest an increase in the amount of BTC’s supply exchanging hands since the beginning of September.
This suggests that investors could be taking more profits as Bitcoin tries to take previous highs contributing to the bears’ attempts to take over the market.
As seen below, the BTC Token Circulation metric can be used to find a correlation between the price action and the amount of supply exchanging moving on the network. The firm said:
Bitcoin now sits at .1k following a volatile couple of weeks to open September. Notably, the amount of unique tokens moving on the $BTC network, known as token circulation, is up big. Wednesday saw 187.91 unique coins moved, the most since July 29.
Source: Santiment
For Analyst Justin Bennet, BTC’s price broke its upward trend during last week’s selloff. In that sense, the analyst found similarities between this event with May’s price action, when Bitcoin experience the first of several capitulation events.
Related Reading | Bitcoin Suffers As Mid Caps Cryptos Establish Market Dominance With Wide Margin
The ,000 to ,000 region is critical for the bulls, if BTC’s price managed to take over the latter, Bennet expects a resume of the bullish momentum. Otherwise, Bitcoin is at risk of returning to the ,000 lows. The analyst said:
Until then (BTC back to ,000), I’ll continue to believe that this week is a corrective move before the next selloff toward ,000. It’s the same pattern as late April and early May.
A Turbulent Week For Bitcoin And The Crypto Market
In addition to the increase in profit-taking by investors, the current week has seen some hurdles in prominent crypto projects and crypto-based companies. In addition to the threat of legal action from the Securities and Exchange Commission (SEC) to Coinbase, Tether had to clarified rumors about the assets backing USDT.
Related Reading | Bitcoin Price “Pitchfork Channel” Could Pin-Point The Last Dip Ever
On the other hand, a report by QCP Capital records a “quiet week” in the derivatives sectors. As seen below, funding rates for perpetual swaps have been returning to neutral levels after going negative on September 7th.
Source: Skew via QCP Capital
With that in mind, QCP expects the current period of consolidation to continue into the ,000 range for Bitcoin, at least in the short term.
Related Reading | New To Bitcoin? Learn To Trade Crypto With The NewsBTC Trading Course
By the end of September, BTC’s price could increase its levels of volatility due to the “massive end-month expiry” in BTC options, as seen below. In addition to that, QCP Capital believes Q4, 2021, could bring more macro uncertainty into the market.
Source: QCP Capital
NewsBTC
TA: Bitcoin Breaks $53K, Why BTC Could Soon Revisit $50K
Bitcoin price attempted a recovery above ,000 against the US Dollar, but it struggled above ,000. BTC trimmed gains and it even broke the ,200 support zone.
- Bitcoin extended its decline below ,200 and ,000 support levels.
- The price is now trading well below ,000 and the 100 hourly simple moving average.
- There was a break below a key bullish trend line with support near ,220 on the hourly chart of the BTC/USD pair (data feed from Kraken).
- The pair is likely to continue lower towards the ,000 and ,000 levels in the near term.
Bitcoin Price Extends Losses
Yesterday, bitcoin started a decent recovery above the ,500 and ,000 levels. BTC even spiked above the ,000 resistance and the 100 hourly simple moving average.
However, the price struggled to continue higher and it started a fresh decline from the ,235 high. It broke a few important supports near the ,000 and ,500 levels. There was also a break below a key bullish trend line with support near ,220 on the hourly chart of the BTC/USD pair.
The price even declined below the ,000 support level and the ,200 pivot level. It traded to a new weekly low at ,634 and it is now consolidating losses. An initial resistance is near the ,000 level. It is close to the 23.6% Fib retracement level of the recent decline from the ,235 high to ,634 low.
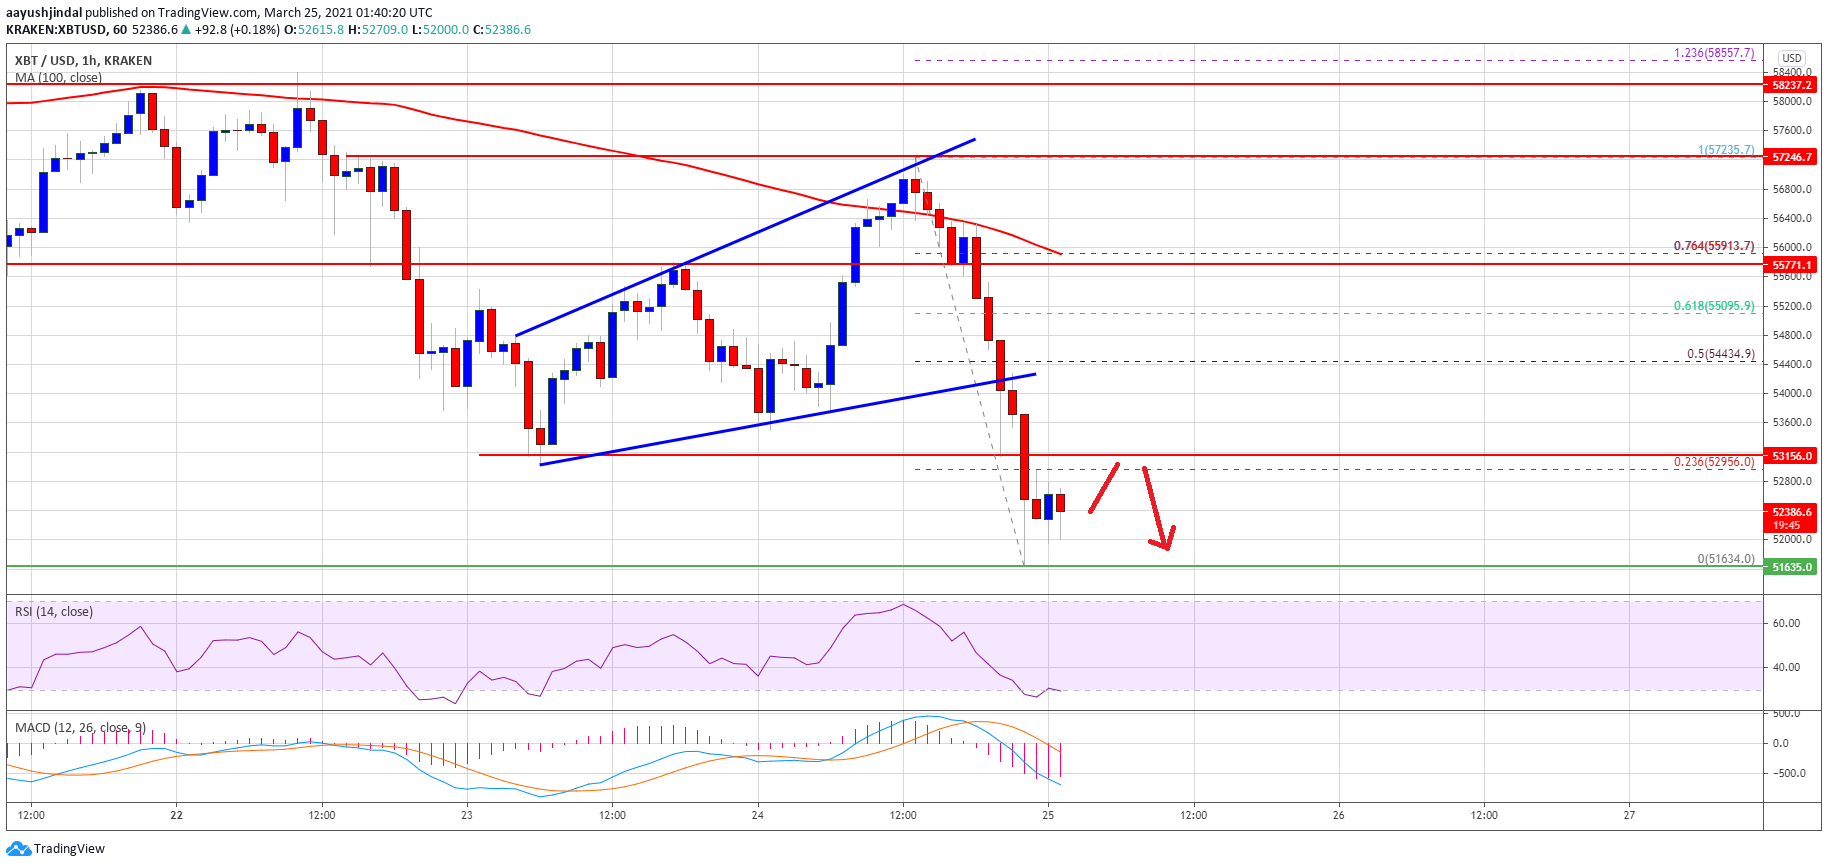
Source: BTCUSD on TradingView.com
The first major resistance is near the ,200 pivot level. If there is a fresh increase above ,200, the price could recover towards the ,500 level. The 50% Fib retracement level of the recent decline from the ,235 high to ,634 low is also close to ,500.
More Losses in BTC?
If bitcoin fails to correct higher above ,200 and ,500, there are chances of more downsides in the near term. An initial support is near the ,500 level.
The first key support is now near the ,000 level, below which the price is likely to test the ,000 support zone. Any more losses might call for a move towards the ,000 level.
Technical indicators:
Hourly MACD – The MACD is now gaining momentum in the bearish zone.
Hourly RSI (Relative Strength Index) – The RSI for BTC/USD is now well below the 40 level.
Major Support Levels – ,000, followed by ,000.
Major Resistance Levels – ,200, ,500 and ,000.
TA: Why Bitcoin Price Remains At Risk of More Losses Below $53K
Bitcoin price failed to correct above the ,750 zone against the US Dollar. BTC is showing bearish signs and it remains at a risk of more losses below ,000.
- Bitcoin failed to correct higher and it struggled to settle above ,500.
- The price is now trading well below ,500 and the 100 hourly simple moving average.
- There is a key bearish trend line forming with resistance near ,000 on the hourly chart of the BTC/USD pair (data feed from Kraken).
- The pair is likely to decline heavily if it fails to stay above ,000 and ,750.
Bitcoin Price Signaling Bearish Signs
Yesterday, we saw a crucial decline in bitcoin below the ,500 support zone. BTC even broke the ,000 level before starting an upside correction.
There was a recovery above the ,000 resistance. The price even climbed above ,500, but there was no follow up move. A high was formed near ,757 before the price declined again. It broke the ,000 support zone.
It is now trading well below ,500 and the 100 hourly simple moving average. There is also a key bearish trend line forming with resistance near ,000 on the hourly chart of the BTC/USD pair.
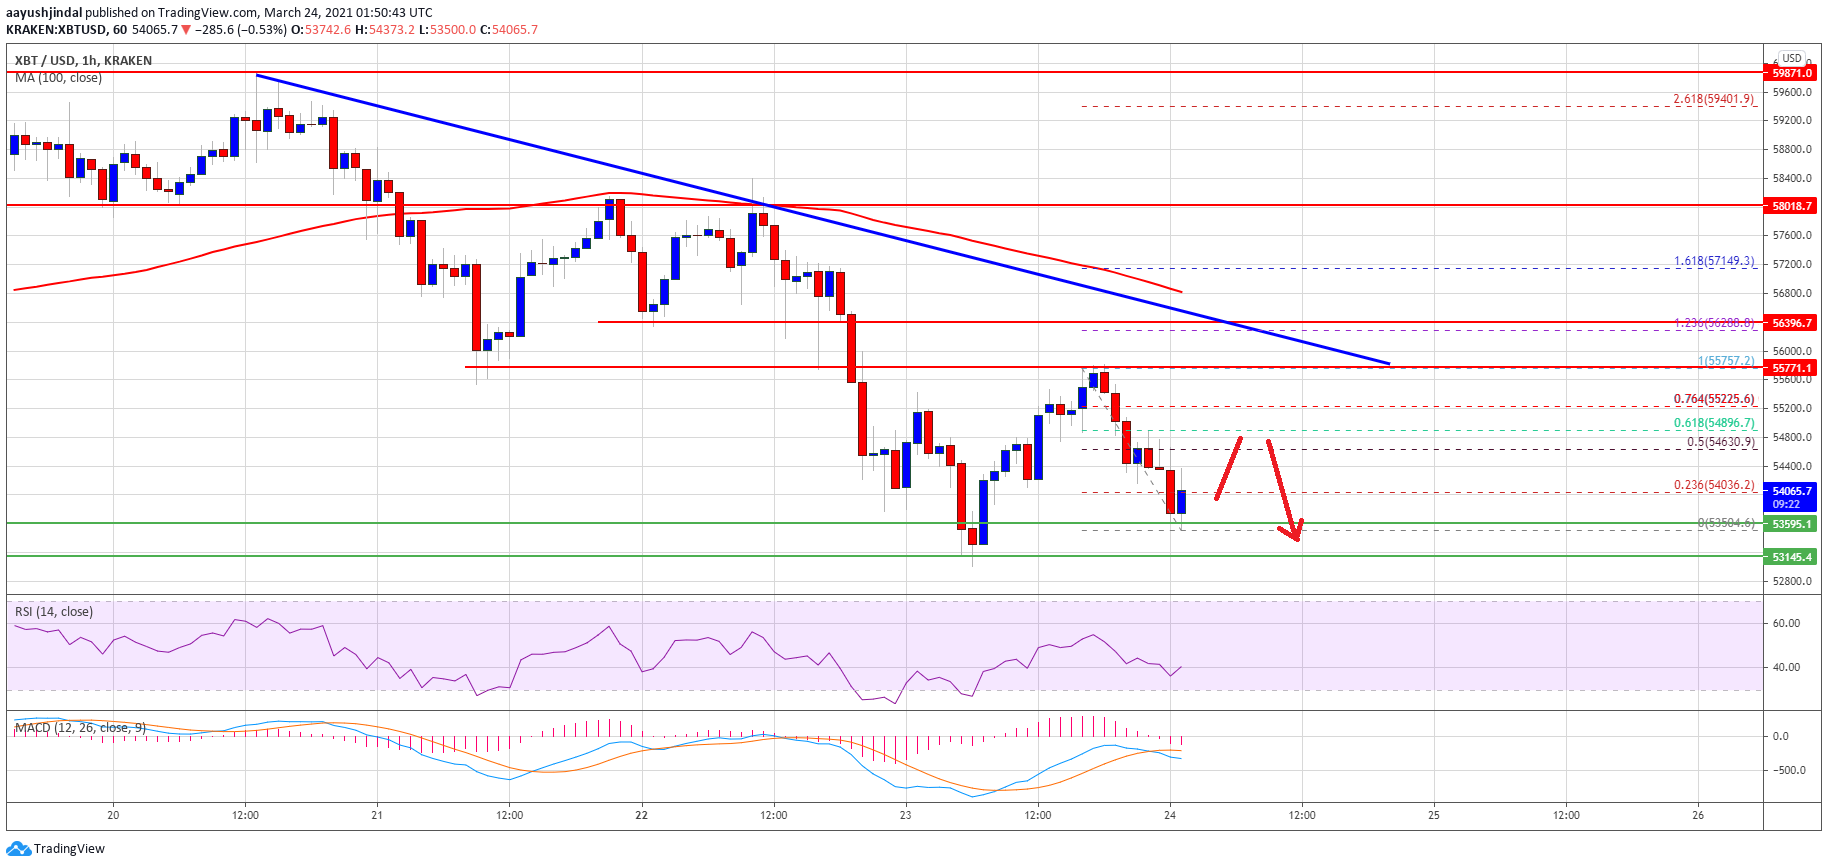
Source: BTCUSD on TradingView.com
An initial resistance on the upside is near the ,650 level. It is near the 50% Fib retracement level of the recent drop from the ,757 high to ,504 low. The first major resistance is near the ,850 and ,000 levels.
The 61.8% Fib retracement level of the recent drop from the ,757 high to ,504 low is also near ,850. To start a steady recovery, the price must settle above ,000 and ,500. The next major resistance for the bulls could be near the ,000 region.
More Losses in BTC?
If bitcoin fails to correct higher above ,000 and ,500, there are chances of more downsides in the near term. An initial support is near the ,000 level.
The key support is now near the ,150 level, below which the bears might aim a test of the ,000 support zone in the near term.
Technical indicators:
Hourly MACD – The MACD is now gaining momentum in the bearish zone.
Hourly RSI (Relative Strength Index) – The RSI for BTC/USD is now well below the 50 level.
Major Support Levels – ,000, followed by ,750.
Major Resistance Levels – ,850, ,000 and ,500.