 JPMorgan has cautioned investors that the price of bitcoin could fall to ,000 after the halving event in April. The global investment bank’s analysts explained that K is the level they “envisage bitcoin prices drifting towards once bitcoin-halving-induced euphoria subsides after April.” The bank also recently stated that the bitcoin halving and the next major […]
Bitcoin News
Bitcoin Price Faces Uphill Task, Risk of Additional Losses Below $42K Looms
Bitcoin price is still struggling below the ,250 resistance zone. BTC remains at risk of more downsides if it stays below ,500 for a long time.
- Bitcoin price is still trading in a range from the ,500 zone.
- The price is trading below ,250 and the 100 hourly Simple moving average.
- There was a break below a key rising channel with support near ,880 on the hourly chart of the BTC/USD pair (data feed from Kraken).
- The pair is now at risk of more downsides below the ,500 support zone.
Bitcoin Price Turns Red
Bitcoin price started a consolidation phase from the ,500 zone. BTC recovered a few points, but the bears were active near the ,250 and ,500 levels.
The last swing high was near ,568 before the price started a fresh decline. There was a clear move below the ,000 level. Besides, there was a break below a key rising channel with support near ,880 on the hourly chart of the BTC/USD pair.
Bitcoin is now trading below ,250 and the 100 hourly Simple moving average. It is again attempting a recovery wave above the ,500 level.
On the upside, the price is facing resistance near the ,800 level. It is close to the 50% Fib retracement level of the recent decline from the ,568 swing high to the ,190 low. The first major resistance is ,000. The main resistance is now forming near the ,250 level.
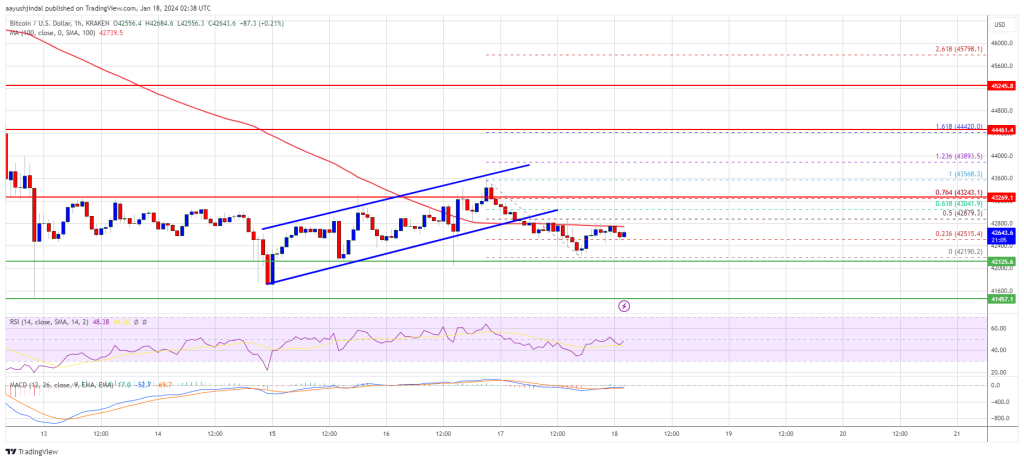
Source: BTCUSD on TradingView.com
The 76.4% Fib retracement level of the recent decline from the ,568 swing high to the ,190 low is also near ,250. A clear move above the ,250 resistance could send the price toward the ,000 resistance. The next resistance is now forming near the ,250 level. A close above the ,250 level could push the price further higher. The next major resistance sits at ,000.
More Losses In BTC?
If Bitcoin fails to rise above the ,250 resistance zone, it could start a fresh decline. Immediate support on the downside is near the ,120 level.
The next major support is ,450. If there is a close below ,450, the price could gain bearish momentum. In the stated case, the price could drop toward the ,000 support in the near term.
Technical indicators:
Hourly MACD – The MACD is now gaining pace in the bearish zone.
Hourly RSI (Relative Strength Index) – The RSI for BTC/USD is now below the 50 level.
Major Support Levels – ,120, followed by ,450.
Major Resistance Levels – ,000, ,250, and ,000.
Bitcoin Price Extends Rally Above $42K But Signs of Trend Exhaustion Appear
Bitcoin price extended its rally above the ,000 resistance. BTC is now correcting gains and might test the ,800 support zone.
- Bitcoin surged further above the ,200 and ,000 levels.
- The price is trading above ,200 and the 100 hourly Simple moving average.
- There is a major bullish trend line forming with support near ,880 on the hourly chart of the BTC/USD pair (data feed from Kraken).
- The pair could correct lower toward ,800 before it starts a fresh increase.
Bitcoin Price Rises Over 10%
Bitcoin price started a strong increase above the ,500 resistance zone. BTC gained over 10% in the past few sessions and broke many hurdles near ,000.
It even cleared the ,200 resistance and spiked above the ,000 zone. A new multi-month high is formed near ,415 and the price is now correcting gains. There was a move below the ,000 level. The price is now testing the 23.6% Fib retracement level of the upward move from the ,360 swing low to the ,415 high.
Bitcoin also trades above ,200 and the 100 hourly Simple moving average. Besides, there is a major bullish trend line forming with support near ,880 on the hourly chart of the BTC/USD pair. The trend line is close to the 50% Fib retracement level of the upward move from the ,360 swing low to the ,415 high.
On the upside, immediate resistance is near the ,200 level. The first major resistance is forming near ,500, above which the price might rise toward the ,200 level.
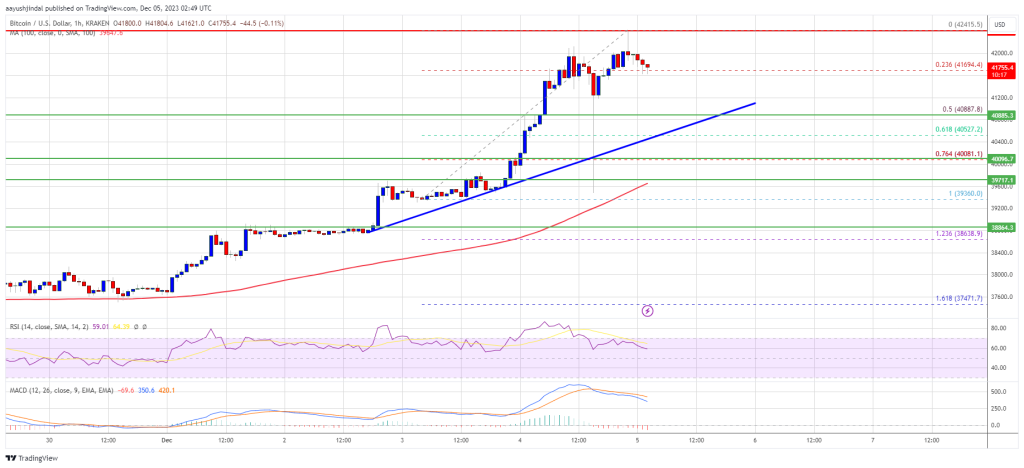
Source: BTCUSD on TradingView.com
A close above the ,200 resistance might send the price further higher. The next key resistance could be near ,000, above which BTC could rise toward the ,000 level.
Are Dips Limited In BTC?
If Bitcoin fails to rise above the ,200 resistance zone, it could start a downside correction. Immediate support on the downside is near the ,200 level.
The next major support is near ,800 and the trend line. If there is a move below ,800, there is a risk of more downsides. In the stated case, the price could drop toward the ,000 support in the near term.
Technical indicators:
Hourly MACD – The MACD is now losing pace in the bullish zone.
Hourly RSI (Relative Strength Index) – The RSI for BTC/USD is now above the 50 level.
Major Support Levels – ,200, followed by ,800.
Major Resistance Levels – ,200, ,500, and ,200.
Bitcoin Technical Analysis: BTC Breaks $42K Resistance in Latest Bullish Swing

On December 4, 2023, bitcoin’s price exhibited significant movements trading between ,409 and ,155 during the intraday sessions. The crypto asset briefly crossed the K zone — a height not seen since the Terra LUNA crash. Bitcoin’s current market capitalization is around 3 billion as it trades for ,556 per unit at the time of writing.
Bitcoin
Presently, bitcoin’s relative strength index (RSI) stands at 85, indicating a balanced stance, while the Stochastic reads 89, suggesting a slightly bearish signal after reaching the K mark. The commodity channel index (CCI) at 229 currently remains neutral. Bitcoin’s movement is strongly supported by various moving averages, all signaling positivity within the market.
The exponential moving averages (EMAs) and simple moving averages (SMAs) for 10, 20, 30, 50, 100, and 200 days ranged from ,893 to ,284, consistently favoring the current upward trend. After tapping K, the high volume associated with the modest sell-off and lower volume during consolidation suggests a temporary yet strong shift in market dynamics.
Meanwhile, the 4-hour chart provided a contrasting view with a sustained uptrend, marked by a series of higher highs and higher lows — a bullish sign. The highest peak on the 4-hour chart aligns with the short-term resistance level, and volume spikes on upward movements support the current market optimism. For trading strategies, potential entry points could be identified amid pullbacks, while exit points might be considered upon noticing reversal patterns with high volume, signaling a possible end to the current trend.
Bull Verdict:
The comprehensive analysis of bitcoin on December 4, suggests a predominantly bullish outlook. The alignment of various moving averages indicates a strong upward trend, with longer-term charts reinforcing this sentiment through a series of higher highs and higher lows.
Bear Verdict:
Conversely, the analysis of bitcoin on December 4 can also be interpreted with a bearish perspective. The overbought conditions suggested by the RSI and the significant selling pressure observed in the short-term chart analysis indicate potential market exhaustion.
Register your email here to get weekly price analysis updates sent to your inbox:
What do you think about bitcoin’s market action on Monday morning? Share your thoughts and opinions about this subject in the comments section below.
BTC to Peak at $42K in 2023: Finder’s Bitcoin Price Predictions Report

Bitcoin is expected to reach its peak at ,000 in 2023, with an end-of-year price prediction of ,000, according to Finder’s bitcoin price predictions report. The report, based on a survey of 29 industry specialists, reveals that 43% of panelists believe bitcoin is currently underpriced, 36% say it is priced fairly, and 21% consider it overpriced.
Bitcoin Price Predictions: Experts Forecast K End-of-Year Value, K Peak in 2023
Finder’s average prediction for the peak price of bitcoin (BTC) in 2023 remains consistent with previous estimates, but the end-of-year projection has increased by 9% to ,000. Futurist Joe Raczynski anticipates bitcoin to end 2023 slightly higher than the panel average at ,000, citing growing institutional interest and the potential approval of a bitcoin spot ETF, which could result in substantial investments.
Martin Froehler, CEO of Morpher, believes bitcoin is currently undervalued, attributing his end-of-year prediction of ,000 to the anticipated bitcoin halving event and the ongoing interest rate cycle. Froehler expects the macroeconomic headwinds to fade and foresees a significant price increase following the halving event.
Looking ahead, the panel forecasts an average bitcoin price of approximately 0,000 by the end of 2025 and over 0,000 by the end of 2030. Alex Svanevik, CEO of Nansen, predicts bitcoin to be valued at 5,000 and 0,000 by the end of 2025 and 2030 respectively, citing high inflation and mistrust in institutions as contributing factors.
On the more bullish end of the spectrum, Ben Ritchie, managing director at Digital Capital Management, projects BTC to be worth 0,000 by 2025 and 5,000 by 2030. Ritchie emphasizes the multifaceted utility of bitcoin. The Digital Capital Management executive said:
Bitcoin’s utility extends beyond its function as a currency, encompassing data storage essential for the issuance of smart contract tokens and non-fungible tokens. Additionally, its robust security features contribute to its allure, instilling confidence among investors regarding the safekeeping of their bitcoin holdings.
Bearish Points of View
However, not all panelists share the same level of optimism. Kate Baucherel, a digital strategist at Galia Digital, predicts bitcoin to remain at its current price of ,000 by the end of 2023 before reaching ,000 in 2025. Jeremy Cheah, associate professor of decentralized finance at Nottingham Trent University, gives a more modest prediction of ,000 per BTC by the end of 2025, highlighting potential lawsuits and tighter market regulations as factors affecting the market.
John Hawkins, senior lecturer at the University of Canberra, expresses a more bearish view, forecasting bitcoin to be valued at just ,000 by the end of 2023 and continuing to decline to 0 by the end of 2030. Hawkins considers bitcoin a speculative bubble and believes that the future lies in central bank digital currencies (CBDCs) rather than decentralized cryptocurrencies like bitcoin.
In terms of investment strategies, the majority of panelists (59%) advise buying bitcoin, while 33% recommend holding and only 7% suggest selling. Check out the entire prediction report published on finder.com here.
What do you think about the experts’ predictions concerning bitcoin’s peak price this year and year-end forecasts? Share your thoughts and opinions about this subject in the comments section below.
TA: Bitcoin Technicals Suggest Bulls Aim Sharp Move Above $42K
Bitcoin climbed further above the ,000 level against the US Dollar. BTC is showing positive signs and might rally further above ,200.
- Bitcoin remained well supported above the ,000 and ,100 levels.
- The price is now trading above ,500 and the 100 hourly simple moving average.
- There is a key bullish trend line forming with support near ,050 on the hourly chart of the BTC/USD pair (data feed from Kraken).
- The pair might start a strong upward move if it settles above the ,000 resistance zone.
Bitcoin Price Gains Pace
Bitcoin price extended increase above the ,500 resistance zone. BTC even cleared the ,000 resistance zone and settled above the 100 hourly simple moving average.
A high was formed near ,235 before the price started a downside correction. There was a move below the ,500 pivot level. The price even spiked below the ,000 level, but it found support near the ,900 level.
A fresh base was formed and the price is now back above ,500. Bitcoin climbed above the 50% Fib retracement level of the recent decline from the ,235 swing high to ,900 low. It is now trading above ,500 and the 100 hourly simple moving average.
There is also a key bullish trend line forming with support near ,725USD pair. An immediate resistance on the upside is near the ,725 level.
Source: BTCUSD on TradingView.com
The 61.8% Fib retracement level of the recent decline from the ,235 swing high to ,900 low is also near the ,725 level. The next key resistance could be ,000. To start a strong upward move, the price must settle above the ,000 zone and then clear ,230. If the bulls succeed, the price could rise towards the ,200 resistance zone.
Dips Supported in BTC?
If bitcoin fails to clear the ,000 resistance zone, it could start a downside correction. An immediate support on the downside is near the ,250 level.
The next major support is seen near the ,000 level and the trend line zone. A downside break below the trend line might send the price to ,750 or the 100 hourly simple moving average.
Technical indicators:
Hourly MACD – The MACD is slowly gaining pace in the bullish zone.
Hourly RSI (Relative Strength Index) – The RSI for BTC/USD is now above the 50 level.
Major Support Levels – ,250, followed by ,000.
Major Resistance Levels – ,725, ,000 and ,500.
TA: Bitcoin Prints Bearish Pattern, Why BTC Could Drop To $42K
Bitcoin extended decline below the ,000 support against the US Dollar. BTC remains at a risk of a move towards the ,000 support zone.
- Bitcoin gained bearish momentum after it broke the ,000 support zone.
- The price is trading below ,000 and the 100 hourly simple moving average.
- There are two bearish trend lines forming with resistance near ,900 and ,400 on the hourly chart of the BTC/USD pair (data feed from Kraken).
- The pair could extend decline towards the ,000 level in the near term.
Bitcoin Price Dives Over 5%
Bitcoin price started a major decline from the ,000 resistance zone. BTC traded below the ,000 and ,500 support levels to move into a bearish zone.
The price even broke the ,000 support level and settled below the 100 hourly simple moving average. Finally, it spiked below the ,000 level and traded as low as ,904. It is now consolidating losses near the ,000 level.
On the upside, an immediate resistance is near the ,800 level. It is near the 23.6% Fib retracement level of the recent decline from the ,845 swing high from the ,904 low. There are also two bearish trend lines forming with resistance near ,900 and ,400 on the hourly chart of the BTC/USD pair.
The next resistance could be near ,250. The main resistance is now forming near ,000 or the 50% Fib retracement level of the recent decline from the ,845 swing high from the ,904 low.
Source: BTCUSD on TradingView.com
Bitcoin price must clear the ,800 and ,000 resistance levels to start a fresh increase. In the stated case, the price may perhaps rise towards the ,000 resistance zone.
More Losses in BTC?
If bitcoin fails to clear the ,000 resistance zone, it could continue to move down. An immediate support on the downside is near the ,000 level.
The next major support is seen near the ,800 level. A downside break below the ,800 support zone could increase selling pressure. In the stated case, the price could drop towards the ,000 support in the near term. The next major support might be ,200.
Technical indicators:
Hourly MACD – The MACD is now gaining pace in the bearish zone.
Hourly RSI (Relative Strength Index) – The RSI for BTC/USD is well below the 50 level.
Major Support Levels – ,000, followed by ,000.
Major Resistance Levels – ,800, ,000 and ,000.
TA: Bitcoin Steadies Above $42K, What Could Spark More Upsides
Bitcoin started a steady increase above the ,000 resistance against the US Dollar. BTC tested the ,400 zone and recently corrected lower.
- Bitcoin started a downside correction after a test of ,400.
- The price is trading above ,000 and the 100 hourly simple moving average.
- There is a key bullish trend line forming with support near ,950 on the hourly chart of the BTC/USD pair (data feed from Kraken).
- The pair must stay above the ,500 support zone to remain in a positive zone.
Bitcoin Price Remains In Uptrend
Bitcoin price started a steady increase after it cleared the ,000 resistance zone. BTC gained pace for a move above the ,500 level and settled above the 100 hourly simple moving average.
The upward move was such that the price even broke the ,200 resistance. It traded as high as ,402 and is currently correcting lower. There was a move below the 23.6% Fib retracement level of the recent increase from the ,510 swing low to ,402 high.
However, the bulls are defending the ,000 support zone. There is also a key bullish trend line forming with support near ,950 on the hourly chart of the BTC/USD pair. The trend line is close to the 50% Fib retracement level of the recent increase from the ,510 swing low to ,402 high.
On the upside, the price is facing resistance near the ,800 level. The next major resistance could be near the ,000 zone. A successful break and close above the ,000 level might start another steady increase.
Source: BTCUSD on TradingView.com
In the stated case, the price might rise towards the ,500 level. Any more gains could send the price towards the ,200 level in the coming sessions.
Downside Break in BTC?
If bitcoin fails to clear the ,000 resistance zone, it could correct further lower. An immediate support on the downside is near the ,000 zone.
The next major support is seen near the trend line and the 100 hourly SMA. The main support sits near the ,500 zone (the previous breakout zone). A downside break below the ,500 support zone could push the price further lower towards ,500.
Technical indicators:
Hourly MACD – The MACD is now losing pace in the bearish zone.
Hourly RSI (Relative Strength Index) – The RSI for BTC/USD is now above the 50 level.
Major Support Levels – ,000, followed by ,500.
Major Resistance Levels – ,800, ,000 and ,500.
Crypto Prices Today: Bitcoin Above $42K While Ether and SOL Tumble
This year, cryptocurrencies have been on a rollercoaster, with Bitcoin prices trading near k after jumping over 40$. The world’s most significant digital token is up 1.5% at present but down 9% overall for 2022 so far – it still needs to recover some lost ground if we want our asset back near its record high.
As a sign of the times, Bitcoin continues its climb to new heights. The cryptocurrency market capitalization is now over trillion as per CoinGecko – with solid support coming from crypto prices across all markets today.
Related Reading | Bitcoin above ,000, Shiba Inu rallies 29%; ether, Solana slip. Check cryptocurrency prices today
Ether, the cryptocurrency linked to the ethereum blockchain network, scaled again as it reached new heights above K for the first time since January 21. The coin was trading hardly lower at 3125 but has shown signs of recovery. Likewise, Binance Coin (BNB) shed about 0.6% today and is currently trading at around 419 USD per coin.
With the price of Dogecoin climbing over 5% to .15, Shiba Inu skyrocketed 29%. Other coins like XRP (Ripple) and Stellar had mixed performances with gains. Avalanche, Cardano, and Polygon prices traded higher than the last 24 hours, whereas Solana slipped by 1%.
Crypto Prices Following US Stock Rally
Cryptocurrencies have seen their value volatility skyrocket this week as they continue to struggle with an uncertain regulatory landscape. The rise of cryptocurrency came alongside a rally in US stocks, with Nasdaq ending last week’s trading session up despite major fluctuations. Still, traders are not entirely convinced about how these digital coins will perform long due to the heavy volatility.
Related Reading | Bitcoin Hits Two-week High Imitating The Stock Rally
The news that bitcoin production more than doubled in January from a year earlier helped boost other listed crypto assets on Friday. In addition, miner Riot Blockchain announced they would be releasing new coins into circulation.
BTC price crumbles to K | Source: BTCUSD on TradingView.com
With the market slowing down, they struggled to break out. Growth stocks and other riskier assets faltered amid investor concern about an impending Fed rate hike. A global trend toward tighter monetary policy caused their downfall in this environment. The authorities did not reward high-volume trades with lucrative returns like before 2016’s crypto bubble burst on numerous exchanges worldwide.
Profit Starts for Short-term Holders
With the on-chain data indicating the long-term price of Bitcoin seems to be setting new lows every other day, there’s no need for worry as it will eventually rise again.
As seen in the Root Analytics account, short-term holders of Bitcoin are beginning to see their share increase. The portion of the Bitcoin supply controlled by short-term holders is starting to tick upward after falling at times, coinciding with macro price lows.
On Monday, Root commented in a tweet;
“Likely the macro bottom is in. Who could have known.”
There’s some good news for holders of short-term notes, with the ratio slipping back above one this weekend.
With values climbing through 1 from below, it’s clear that short-term holders, on average, are beginning to sell at a profit rather than lose.
BTC short-term holder SOPR chart | Source: Cryptoquant.com
With 25% of the bitcoin supply remaining underwater, it’s no wonder that only 16.7% has been purchased between K – .5K.
Featured image from Pixabay, chart from Cryptoquant.com
TA: Bitcoin Bounces To $42K, Why BTC Could Recover To $43.5K
Bitcoin started a sharp recovery wave from ,700 against the US Dollar. BTC is rising and the next major stop for the bulls might be ,500.
- Bitcoin spiked towards the ,600 level, where the bulls took a stand.
- The price is trading above ,000 and the 100 hourly simple moving average.
- There was a break above a key bearish trend line with resistance near ,800 on the hourly chart of the BTC/USD pair (data feed from Kraken).
- The pair might continue to recover and test the ,500 resistance zone in the near term.
Bitcoin Price Recovers Sharply
Bitcoin price extended decline below the ,500 support level. BTC even spiked below the ,000 level and traded as low as ,659.
Recently, there was a sharp recovery wave above the ,000 level. The price climbed higher above the ,500 and ,200 resistance levels. The bulls even pushed the price above the 50% Fib retracement level of the recent decline from the ,739 swing high to ,659 low.
Besides, there was a break above a key bearish trend line with resistance near ,800 on the hourly chart of the BTC/USD pair. Bitcoin is now trading above ,000 and the 100 hourly simple moving average.
Source: BTCUSD on TradingView.com
On the upside, the first major resistance is near the ,750 level. The next major resistance is near the ,500 level. It is near the 1.236 Fib extension level of the recent decline from the ,739 swing high to ,659 low. Any more gains could pump the price towards the ,500 level. The next major resistance is near the ,500 level, where the bears might emerge.
Fresh Decline in BTC?
If bitcoin fails to recover above ,500, it could start a fresh decline. An immediate support on the downside is near the ,800 zone and the 100 hourly SMA.
The first major support is near ,500 and the broken trend line. A downside break below the trend line support could lead the price towards the ,000 level. Any more losses might push the price towards the ,000 support zone in the coming sessions.
Technical indicators:
Hourly MACD – The MACD is now gaining pace in the bullish zone.
Hourly RSI (Relative Strength Index) – The RSI for BTC/USD is now above the 50 level.
Major Support Levels – ,500, followed by ,500.
Major Resistance Levels – ,750, ,000 and ,500.