 Ethereum’s price experienced a turbulent trading session on March 4, 2024, with significant intraday fluctuations marking the landscape. Despite the short-term volatility, underlying indicators and moving averages suggest a strong bullish trend over the long term. Ethereum The last 24 hours saw ethereum’s (ETH) price swing from ,411 to ,537, encapsulating the volatile nature of […]
Bitcoin News
Ethereum’s Bullish Breakout: Analysts Predict Surge To $3,500 – Here’s Why
Ethereum, the second-largest crypto by market capitalization, is currently exhibiting signs of a bullish breakout, as observed by two prominent analysts in the crypto space. According to World Of Charts, Ethereum shows consolidation within a bullish pennant pattern.
This technical formation typically suggests continuing an upward trend in Ethereum’s case. According to the analyst, if Ethereum successfully breaks out of this pattern, it could surge toward a significant level of ,500.
Trend Is Up Consolidating In Bullish Pennant Expecting Breakout Soon Incase Of Successful Breakout Expecting Move Towards 3500$#Crypto #Eth #Ethusdt #Ethereum pic.twitter.com/nlqbMfh3k0
— World Of Charts (@WorldOfCharts1) January 10, 2024
Crucial Resistance Zone: Ethereum Path To Breakout
Adding to World Of Charts’ optimistic outlook, crypto trader Skew has identified the ,320–,382 range as a key resistance zone for Ethereum. This price range has historically acted as a barrier to Ethereum’s upward movement, with “numerous rejections” witnessed at these levels.
Skew emphasizes the importance of Ethereum closing above ,400 on the 1-hour and 4-hour charts. This decisive move would breach the resistance zone and confirm Ethereum’s bullish momentum.
Skew also noted that technical indicators such as the Relative Strength Index (RSI) and stochastics still display significant momentum, supporting the potential for Ethereum’s continued upward trend.
$ETH 4H
Maybe it’s time for ETH to shine & run, would definitely help if the BTC Spot ETF is legitimately approved later20 – 82 has proven to be strong resistance with numerous rejections
the key confirmation would be a solid 1H & 4H close above 00
4H trend &… pic.twitter.com/taWbcC7eWY
— Skew Δ (@52kskew) January 10, 2024
Ethereum’s Solo Bull Run Amid Market Turbulence
Despite recent market turbulence, including the plunge of several cryptocurrencies, including BTC, following the Securities and Exchange Commission’s (SEC) fake spot ETF approval announcement, Ethereum has shown resilience and is currently in the green.
Over the past 24 hours, Ethereum has climbed by 5.5%, surpassing the ,400 mark before a slight retracement to around ,381 at the time of writing. This bullish trend is further supported by increased trading volume, which surged below billion to approximately billion in the past day.
Skew suggests that Ethereum’s bullish momentum could receive an additional boost from the potential approval of a Spot BTC ETF. If such approval were to come to fruition, it could further support Ethereum’s upward trajectory.
This sentiment is echoed by Michaël van de Poppe, another renowned crypto analyst, who also foresees Ethereum’s approach to its 2022 low as a precursor to a potential breakout. Van de Poppe believes that Ethereum’s current positioning near last year’s low could be crucial in absorbing liquidity and fueling a bullish breakout.
Van de Poppe’s analysis highlights the broader market context, specifically the awaited decision on a spot Bitcoin ETF in the US. An approval, he predicts, could notably impact the ETH/BTC trading pair, potentially triggering a sharp price movement known as a liquidation candle.
Following this, Van de Poppe anticipates a significant reallocation of funds into Ethereum, accompanied by a bullish weekly divergence, propelling Ethereum onto an upward trajectory.
Featured image from Unsplash, Chart from TradingView
Ethereum Retests Breakout Zone, Analyst Sets $3,500 Target
An analyst has explained how Ethereum is retesting a breakout zone currently and that this might lead toward a price target of ,500.
Ethereum Is Retesting The Breakout Line Of An Ascending Triangle
As pointed out by analyst Ali in a new post on X, Ethereum may be preparing for a further climb right now as it’s retesting the breakout zone of an ascending triangle.
An “ascending triangle” is a pattern in technical analysis that, as its name implies, resembles a triangle. The pattern involves a horizontal line made by connecting highs and a slant line that strings together higher lows.
When the price retests the upper, horizontal level, it could be probable to feel some resistance. On the other hand, a touch of the lower level could lead to the price rebounding back up.
A break out of either of these lines suggests a potential sustained continuation of the trend. Naturally, an escape out of the triangle towards the upside implies bullish momentum, while a fall under means bearish momentum.
Like the ascending triangle, there is also the “descending triangle,” which is a similar pattern except for the fact that the two levels are switched around (as the prevailing trend is towards the downside).
Now, here is the chart shared by Ali that displays how the price is interacting with an ascending triangle right now:
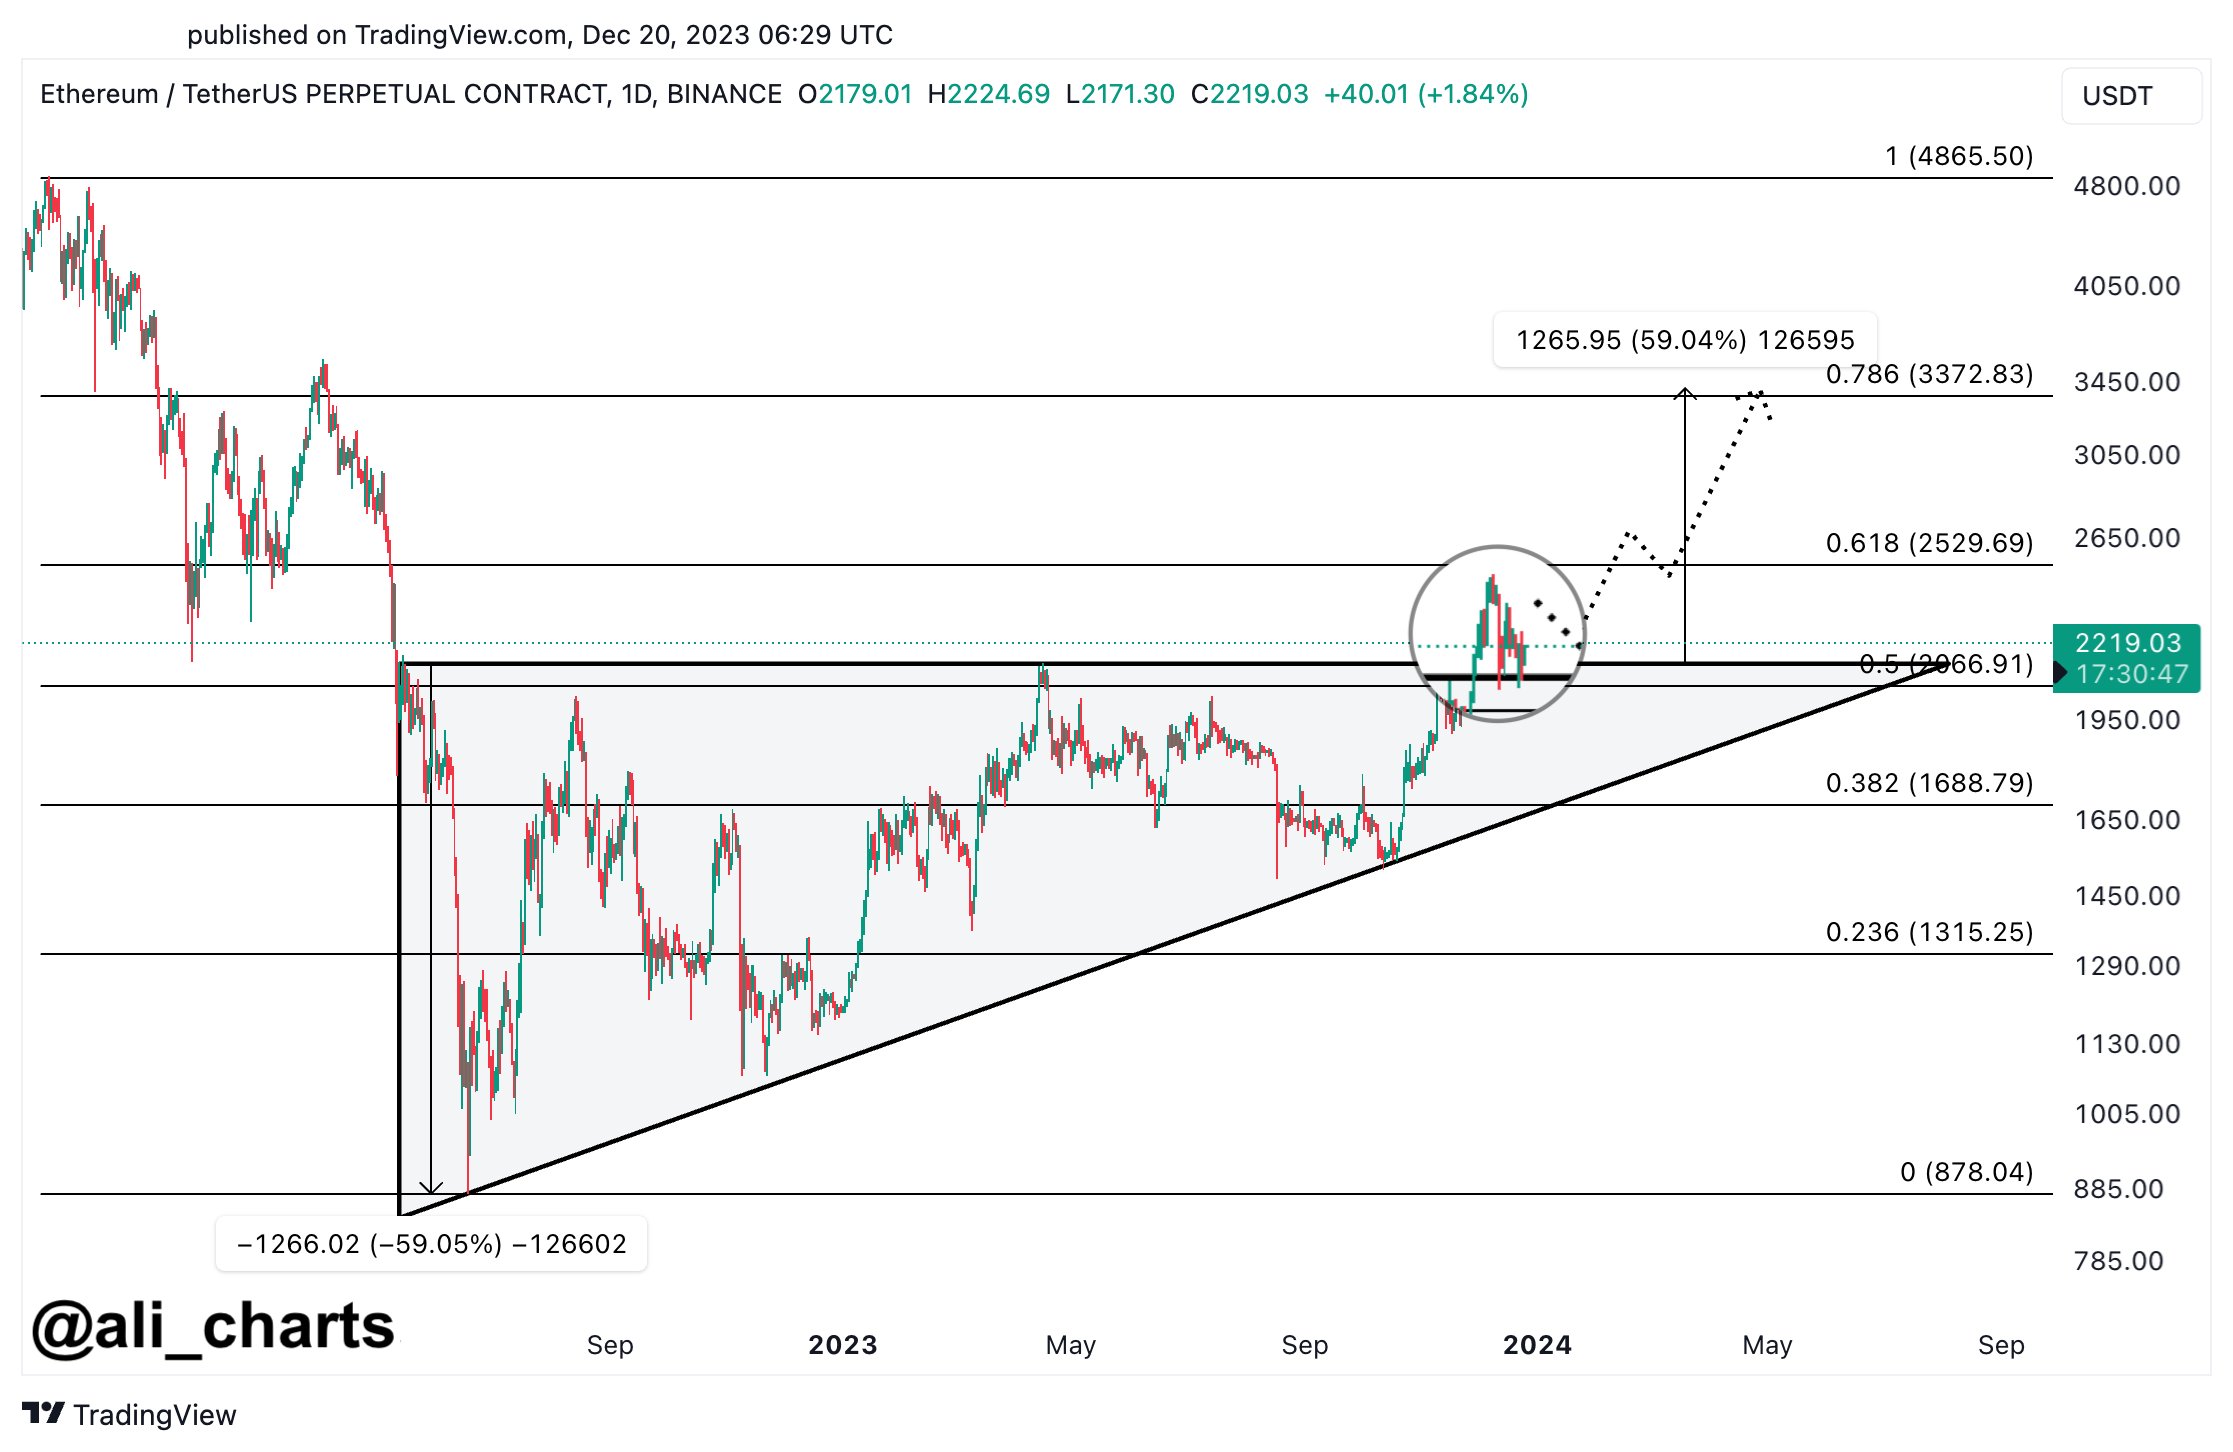
As is visible in the graph, Ethereum found a bottom at the lower line of this ascending triangle pattern back in October. Following this low, the asset turned itself around with a sharp rally and went on to challenge the upper line.
The cryptocurrency succeeded in finding a break above the triangle and observed a continuation of the bullish momentum, exploring new highs for the year. Recently, though, the asset has slumped back again and has now fallen towards the triangle’s breakout line.
So far, the line has provided support to the asset, as its price has been able to remain above it. The analyst believes that this retest could be a sign that the coin is preparing for a further rally.
“The price range between ,150 and ,900 could be the ideal zone for accumulation before ETH sets its sights on a higher target of ,500,” explains Ali. From the current price, such a target would mean a rally of almost 60% for the asset.
October, the month when Ethereum turned itself around off the triangle’s slope, was also an inflection point for the asset in terms of on-chain activity, as the analytics firm Glassnode has explained in its latest weekly report.

From the chart, it’s visible that the Ethereum transaction count and transfer volume have both been trending up since the inflection point a couple of months back, which could be bullish for the price.
ETH Price
Ethereum has gone a bit stale recently as it has been consolidating around the ,200 mark.
Ethereum Price Prediction: Crypto Analysts Reveal Catalyst That Will Drive Price Above $3,500
A crypto analyst has singled out an event that could be the spark that Ethereum needs to hit the price level of ,500. He believes that the second-largest cryptocurrency by market cap is going to make this run after Bitcoin “gets its shine.”
How Ethereum Will Hit ,500
In a post shared on his X (formerly Twitter) platform, the CEO and founder of MN Trading, Michaël van de Poppe, alluded to the Ethereum Spot ETF filing by Fidelity in his price prediction of ,500. The crypto analyst seemed to be suggesting that approval of an Ethereum Spot ETF could propel Ethereum’s price to such heights.
His reference to Bitcoin also confirms that this might indeed be van de Poppe’s “thesis.” He spoke about Ethereum “running to ,500 in Q1 2024” after Bitcoin has had its shine. The “shine” likely refers to the possible approval of a Spot Bitcoin ETF. Some analysts have predicted that there is a 90% chance that a Spot Bitcoin ETF will be approved by January 10, 2024.
With this in mind, the crypto analyst possibly believes that approval of an Ethereum Spot ETF could come not long after once the Spot Bitcoin ETF is approved. If that happens, it could spark a massive rally in Ethereum’s price. That could explain why Michaël van de Poppe is predicting Ethereum to run to ,500.
Several asset managers have already applied with the Securities and Exchange Commission (SEC) to offer an Ethereum Spot ETF. However, all eyes seem to be on the SEC’s decision on the pending Spot Bitcoin ETF applications. This could simply be because a final decision is expected on the pending Spot Bitcoin ETF applications, unlike Ethereum’s, which still have a longer review process.
Ethereum Spot ETFs May Not Get The Same Reception
Historically speaking, there is reason to believe that Ethereum Spot ETFs might not enjoy the same reception that Spot Bitcoin ETFs have gotten so far. This is based on the fact that there was a stark comparison in the numbers when the futures ETF of both crypto tokens launched.
Bitcoin futures ETFs were already in place as of 2021, with ProShares Bitcoin Strategy (BITO) ETF being the first to launch. Meanwhile, Ethereum futures ETFs just launched this year. What is most interesting is the trading volume that BITO saw on its launch date in comparison to all Ethereum futures ETFs on their launch date.
BITO is reported to have seen more than billion in trading volume in the first two days of launching. On the other hand, the total trading volume for Ether ETFs on their launch day amounted to just under million.
TA: Ethereum Gearing For Another Lift-Off to $3,500: Recovery Isn’t Over Yet
Ethereum started a downside correction from ,400 against the US Dollar. ETH price is holding the ,250 support and eyes a fresh increase above the ,320 resistance.
- Ethereum started a downside correction from the ,400 resistance zone.
- The price is trading above ,250 and the 100 hourly simple moving average.
- There was a break below a major bullish trend line with support near ,300 on the hourly chart of ETH/USD (data feed via Kraken).
- The pair could start a fresh increase if it stays above the ,250 support zone.
Ethereum Price Corrects Lower
Ethereum started a strong increase above the ,320 resistance zone. ETH even broke the ,400 resistance zone and the 100 hourly simple moving average, but there was no momentum.
A high was formed near ,412 and the price is now correcting gains. Ether price declined below the ,320 support. There was a break below the 23.6% Fib retracement level of the key increase from the ,931 swing low to ,412 high.
Besides, there was a break below a major bullish trend line with support near ,300 on the hourly chart of ETH/USD. It is now trading above ,250 and the 100 hourly simple moving average.
Source: ETHUSD on TradingView.com
On the upside, an immediate resistance is near the ,300 level. The first major resistance is near the ,320 level. A clear move above the ,320 level might start another increase in the near term. The next major resistance is near the ,400 level, above which ether price could test ,480. Any more gains could send the price towards the ,550 level in the near term.
Dips Limited in ETH?
If ethereum fails to start a fresh increase above the ,320 level, it could continue to move down. An initial support on the downside is near the ,250 level. The first key support is now forming near the ,175 level.
It is near the 50% Fib retracement level of the key increase from the ,931 swing low to ,412 high. A downside break below the ,175 level might push the price towards the ,115 zone. Any more losses could lead the price towards ,000.
Technical Indicators
Hourly MACD – The MACD for ETH/USD is slowly losing pace in the bearish zone.
Hourly RSI – The RSI for ETH/USD is above the 50 level.
Major Support Level – ,250
Major Resistance Level – ,320
TA: Ethereum Dips Turn Attractive, Bulls Could Aim $3,500
Ethereum gained pace above the ,250 zone against the US Dollar. ETH price is correcting gains from ,400, but dips might be limited in the near term.
- Ethereum started a strong increase above the ,250 resistance zone.
- The price is trading above ,250 and the 100 hourly simple moving average.
- There is a major bullish trend line forming with support near ,300 on the hourly chart of ETH/USD (data feed via Kraken).
- The pair could continue to rise if there is a clear break above the ,380 resistance zone.
Ethereum Price Gains Momentum
Ethereum started a strong increase above the ,250 resistance zone. ETH even broke the ,300 resistance zone and the 100 hourly simple moving average to move further into a positive zone.
The bulls even pumped the price above the ,350 level. Ether price spiked above the ,400 level and a new weekly high is formed near ,412. It is now correcting gains and trading below ,360. There was a break below the 23.6% Fib retracement level of the recent upward move from the ,206 swing low to ,412 high.
Ether price is now trading above ,250 and the 100 hourly simple moving average. There is also a major bullish trend line forming with support near ,300 on the hourly chart of ETH/USD. On the upside, an immediate resistance is near the ,380 level.
Source: ETHUSD on TradingView.com
A clear move above the ,380 level might start another increase in the near term. The next major resistance is near the ,420 level, above which ether price could test ,500. Any more gains could send the price towards the ,550 level in the near term.
Dips Limited in ETH?
If ethereum fails to start a fresh increase above the ,380 level, it could start a downside correction. An initial support on the downside is near the ,320 level. The first key support is now forming near the ,300 level.
It is near the 50% Fib retracement level of the recent upward move from the ,206 swing low to ,412 high. A downside break below the ,300 level push the price towards the trend line support. Any more losses could lead the price towards ,200.
Technical Indicators
Hourly MACD – The MACD for ETH/USD is slowly losing pace in the bullish zone.
Hourly RSI – The RSI for ETH/USD is above the 50 level.
Major Support Level – ,300
Major Resistance Level – ,380
Vetter’s Presale Launches Today Following 3500 BNB Private Sale Sellout
Vetter, a next-generation ecosystem and investor-research tool for crypto presales, has raised 3500 BNB (worth 1.7 million USD at current market rates) in a recent sellout private sale. The private sale saw Vetter’s committed community of over 700 paying discord members come together to support the grassroots movement – from Vetters, to Scouts, to regular members.
Both the private sale’s participation and investment size suggest that Vetter’s groundbreaking technology is supported by an enthusiastic community, providing a real solution for eager crypto investors. Accordingly, if this is any indication of future fundraising success, Vetter’s presale today on PinkSale could raise substantially more from the general public, capitalizing on the private sales’ momentum.
Revolutionizing the Pre-IEO Market
Vetter’s fundraising success is built on the innovation at the core of its next-generation technology. It provides a tokenized research tool for evaluating often difficult to understand pre-sales in the crypto-space. Vetter leverages the knowledge of the crowd to efficiently analyze the numerous presales, ICOs, IDOs etc. that launch each day, providing its users with appropriate metrics to help guide their investment decisions.
Its analytics machine also combines artificial intelligence with the principles of gamification into a user-friendly decentralized application (dApp) which makes it “fun fast and easy to spot crypto projects worthy of consideration” for investment according to Vetter’s detailed whitepaper. Each project is “vetted” by holders of Vetter Tokens, and added to a calendar of upcoming opportunities. Token holders can then provide additional information to “vet” certain opportunities. The application then uses a custom-made A.I.-based scoring and ranking system to reward users who have contributed to the analysis of successful investments.
The objective is to remove the lengthy amount of time and resources needed for individuals to seek out and profit from these opportunities themselves.
No Time Like the Present
Indeed, as the total value of the cryptocurrency market nears trillion, and the number of blockchain-based projects continues to balloon, there has never been a greater need for such a tool. In fact, Vetter’s recent developments suggest their team is uniquely aware that their time is now. In the past few months, Vetter has launched a successful community-building effort, taking part in several AMAs, marketing campaigns and curating a growing following on their variety of socials.
Vetter has also released a series of technical documentation for audit ahead of the presale. The team is now looking to attract beta users for its public launch in the not too distant future as well as set a development schedule that releases new features for the platform every month. Taken together, Vetter’s technology, successful private sale and short-term roadmap provide a good foundation for the future of its pioneering research tool, and it will be interesting to see the outcome of today’s Private Sale on PinkSale.
TA: Ethereum Bulls In Control, Why ETH Could Rally Above $3,500
Ethereum gained strength above ,200 and ,350 against the US Dollar. ETH price could start a fresh rally if it clears ,450 and ,500.
- Ethereum started a steady increase after it settled above the ,200 level.
- The price is now trading above ,300 and the 100 hourly simple moving average.
- There was a break below a key bullish trend line with support near ,400 on the hourly chart of ETH/USD (data feed via Kraken).
- The pair could might remain supported near the ,300 and ,250 levels.
Ethereum Price Stuck Below Resistance
Ethereum formed a base above the ,000 level and started a fresh increase. ETH broke the ,150 and ,200 resistance levels to move into a positive zone.
There was also a close above the ,300 level and the 100 hourly simple moving average. The price traded as high as ,489 and recently corrected lower, similar to bitcoin. Ether declined below the ,400 support level. There was a break below the 23.6% Fib retracement level of the upward move from the ,970 swing low to ,489 high.
There was a break below a key bullish trend line with support near ,400 on the hourly chart of ETH/USD. It is now trading above the ,320 support level.
Source: ETHUSD on TradingView.com
An immediate resistance on the upside is near the ,400 level. The first major resistance is near the ,420 level. A break above the ,420 level could start a steady increase. The next main resistance is near the ,500 zone, above which the price might accelerate higher.
Dips Limited in ETH?
If ethereum fails to continue higher above the ,420 and ,500 resistance levels, it could start a fresh downside correction. An initial support on the downside is near the ,300 level.
The first key support is now forming near the ,250 level and the 100 hourly simple moving average. If ether fails to stay above .250, it could test the ,230. It is near the 50% Fib retracement level of the upward move from the ,970 swing low to ,489 high.
Technical Indicators
Hourly MACD – The MACD for ETH/USD is now losing pace in the bullish zone.
Hourly RSI – The RSI for ETH/USD is just below the 50 level.
Major Support Level – ,250
Major Resistance Level – ,420
TA: Ethereum Reverse Losses, What Could Spark Rally To $3,500
Ethereum remained well bid above the ,950 support against the US Dollar. ETH price started a fresh increase and it could even surpass the ,300 resistance.
- Ethereum started a fresh increase above the ,120 and ,200 resistance levels.
- The price is now trading above ,150 and the 100 hourly simple moving average.
- There was a break above a crucial bearish trend line with resistance near ,150 on the hourly chart of ETH/USD (data feed via Kraken).
- The pair could accelerate higher if there is a clear break above ,260.
Ethereum Price Turns Green
Ethereum remained well bid above the ,950 support zone, similar to bitcoin near ,000. ETH price formed a base above ,950 and it started a fresh increase.
There was a clear break above the ,000 and ,050 resistance levels. The price rallied above the 50% Fib retracement level of the main decline from the ,335 swing high to ,950 low. Ether even settled above the ,150 level and the 100 hourly simple moving average.
Besides, there was a break above a crucial bearish trend line with resistance near ,150 on the hourly chart of ETH/USD. The pair is now trading above the ,200 resistance.
Source: ETHUSD on TradingView.com
On the upside, an initial resistance is near the ,245 level. It is near the 76.4% Fib retracement level of the main decline from the ,335 swing high to ,950 low. The first key resistance is now forming near the ,260 level. A break above the ,260 zone could lift the price towards the ,330 resistance. Any more gains may possibly call for a move towards the ,500 level.
Dips Limited in ETH?
If ethereum fails to continue higher above the ,245 and ,260 resistance levels, it could start a fresh downside correction. An immediate support on the downside is near the ,165 level.
The key support is now forming near the ,150 zone and the 100 hourly simple moving average. A downside break below the ,150 support zone could initiate a larger decline. The next major support could be ,120, below which the bears might aim a retest of ,000 in the near term.
Technical Indicators
Hourly MACD – The MACD for ETH/USD is now gaining pace in the bullish zone.
Hourly RSI – The RSI for ETH/USD is now well above the 60 level.
Major Support Level – ,150
Major Resistance Level – ,330
Analysts Lays This Case for $3,500 Bitcoin Price By 2020’s Halving
After Bitcoin (BTC) rocketed from ,000 to ,000 in the span of six months, analysts have been sure that the cryptocurrency would never revisit the ,000s again. Indeed, the logarithmic price curve that has contained the asset’s price action for the past decade predicts BTC will never again hit ,000.
But, there have been a few analyses projecting that it may only be a matter of time before such low levels are visited once again. And one of these recently gained some steam on Crypto Twitter.
Could Bitcoin Revisit ,000s By Halving? Analyst Fears So
For some reason or another, so-called fractal analysis has gained much traction in the cryptocurrency space. This sees analysts overlay historical price action over current charts to try and predict what’s next.
These analyses have worked well on multiple occasions. For instance, a fractal analyst from trader NebraskanGooner predicted Bitcoin’s decline from the ,000s late last year to the ,000s, then the latest recovery back to the ,000s. This same fractal suggests a price drop will soon occur.
Another fractal suggests the same.
This fractal is one from cryptocurrency trader Haejin. They noted that Bitcoin’s price action since the ,000 top in June is eerily reminiscent of that seen in the 2018 bear market, with both cycles seeing a downward price channel, an upward wedge-formed false breakout, declining volume, and signs of capitulation.
Haejin then noted that if BTC follows the exact path it did in 2018, the price will soon collapse back to the ,000s, then Bitcoin will capitulate in March or April to fall as low as ,300 by the time of the halving.
https://t.co/JhMTlE2zA1: Bitcoin Deja vu?
Here is a Members only chart: Note the Inverse H&S on both fractals.
Also the three wave ABC price constructs The downward price channelThe upward wedgeDeclining volumesPotential Capitulation Volume
All within 4 months? Hmmm. pic.twitter.com/hXNN53PI7B
— Haejin (@Haejin_Crypto) January 17, 2020
Related Reading: Ethereum’s Price is “Convincingly Bearish”: Here’s What Comes After 20% Week
History Begs to Differ
While this scary fractal says that Bitcoin will be back at the multi-year lows by the time of the halving in the middle of May, some say the opposite will take place. In fact, an analyst who called Bitcoin’s rally into the ,000s when BTC was trading in the low-,000s at the start of January, said that the leading cryptocurrency could be at its previous all-time high just a month after the block reward reduction.
Per previous reports from NewsBTC, prominent Bitcoin analyst Financial Survivalism released an extensive analysis on TradingView earlier this month that indicated BTC could hit ,000 by July 1st, 2020, just six months away.
Check out this post on @tradingview to learn why I think $BTC will retest all time highs by July 1, 2020.  https://t.co/IK87UVVpmf
— Financial Survivalism (@Sawcruhteez) January 9, 2020
Not to mention, simple historical price action analysis suggests there is about no way that Bitcoin will fall in any dramatic fashion as the halving nears.
Per previous reports from NewsBTC, the four months before the halving to the event itself have been extremely bullish for Bitcoin in 2012 and in 2016, with BTC rallying higher into these events, gaining steam as investors try and front-run this shock to the emission dynamics of BTC.
Related Reading: Elon Musk Just Dropped the Bitcoin Bomb On Twitter, Again
In the four months prior to the first halving in 2012, the price of BTC rallied dozens of percent higher from to around by the time of the event; and in the four months prior to the second halving in 2016, the price of Bitcoin went effectively parabolic, running from 2 to 0.
Bitcoin is about 120 days away from the halving.
What was price action like 120 days prior to the first two halvings?
Whether you believe its priced in or not, if past is prologue – volatility may be expected. pic.twitter.com/7peG6Ir0m4
— Nunya Bizniz (@Pladizow) January 10, 2020
Featured Image from Shutterstock The post appeared first on NewsBTC.
NewsBTC