 Economist Jim Rickards forecasts that gold prices could surpass ,000, emphasizing that this projection is not made for attention or shock value. “It’s the result of rigorous analysis,” he clarified. This represents a significant increase from his previous estimate of ,000 by 2026. Jim Rickards’ K Gold Prediction Explained Economist Jim Rickards shared his prediction […]
Bitcoin News
Ark Invest’s ETF Holds Unique ‘Bitcoin Puppet’ NFT Worth Over $27,000
 According to onchain metrics, Ark Invest’s holdings in its spot bitcoin exchange-traded fund (ETF) include several inscriptions, among them an Ordinal inscription from the “Bitcoin Puppet” digital collectible series, valued at ,900. Similarly, Blackrock’s IBIT possesses an Ordinal inscription from the “Speculum Aeternum” non-fungible token (NFT) collection. Spot Bitcoin ETFs Are Holding Unique NFT Inscriptions […]
Bitcoin News
Bitcoin, Ethereum Technical Analysis: BTC Falls on Saturday, Following Brief Spell Above $27,000

Bitcoin retreated from a brief spell above ,000 on Saturday, as uncertainty in the market remained high to start the weekend. The global cryptocurrency market was marginally higher to start the weekend, trading 0.42% higher as of writing. Ethereum continued to consolidate above a recent floor of ,535.
Bitcoin
Bitcoin (BTC) retreated below the ,000 level to start the weekend, after a late surge in price on Friday.
Following a low of ,686.32 earlier in Friday’s session, BTC/USD peaked at a high of ,092.70 as the day progressed.
Although BTC has since slipped, and is currently trading at ,866.74, it is still higher than yesterday’s bottom.
The consolidation comes as the relative strength index (RSI) continues to hover above a floor at the 45.00 mark.
Whilst now tracking at 46.72, the next target is likely to be at a ceiling of 50.00, and if hit, bitcoin will be back above ,000.
Overall, bitcoin is trading 4% lower than at the same point last week.
Ethereum
Ethereum (ETH) is largely unchanged at the time of writing, as the cryptocurrency consolidated to start the weekend.
ETH/USD reached a high of ,571.75 on Friday, however has since fallen to a current reading of ,546.80.
This is slightly higher than yesterday’s low at ,538.09, which was marginally above a support point at ,535.
The drop in price coincides with the RSI failing to breach its own point of resistance at the 40.00 mark.
Currently, price strength is at the 37.46 level, with the 10-day moving average continuing to trend downwards.
Register your email here to get weekly price analysis updates sent to your inbox:
Could ethereum fall under ,700 this weekend? Leave your thoughts in the comments below.
Bitcoin Plunge Below $27,000 Drives Investors Into Fear, Will Rebound Occur?
Data shows the Bitcoin drop below the ,000 level has made most investors fearful for the first time this month.
Bitcoin Fear & Greed Index Is Pointing At “Fear” Right Now
The “fear and greed index” is an indicator that tells us about the general sentiment among investors in the Bitcoin and broader cryptocurrency market. Alternative created the metric, and according to the website, it’s based on these factors: volatility, trading volume, social media sentiment, market cap dominance, and Google Trends data.
The indicator uses a numeric scale from zero to hundred to represent the sentiment. When the index has a value greater than 54, it means that the average investor is greedy right now, while it being under 46 implies a fearful mentality is dominant.
The region between these two thresholds naturally signifies a neutral sentiment among the holders. Until today, the sector had been stuck inside this region since the last couple of days of September, as the investors had been split about the trajectory of Bitcoin.
The chart below shows that the market sentiment has worsened with the latest drop in the cryptocurrency’s price below the ,000 level.
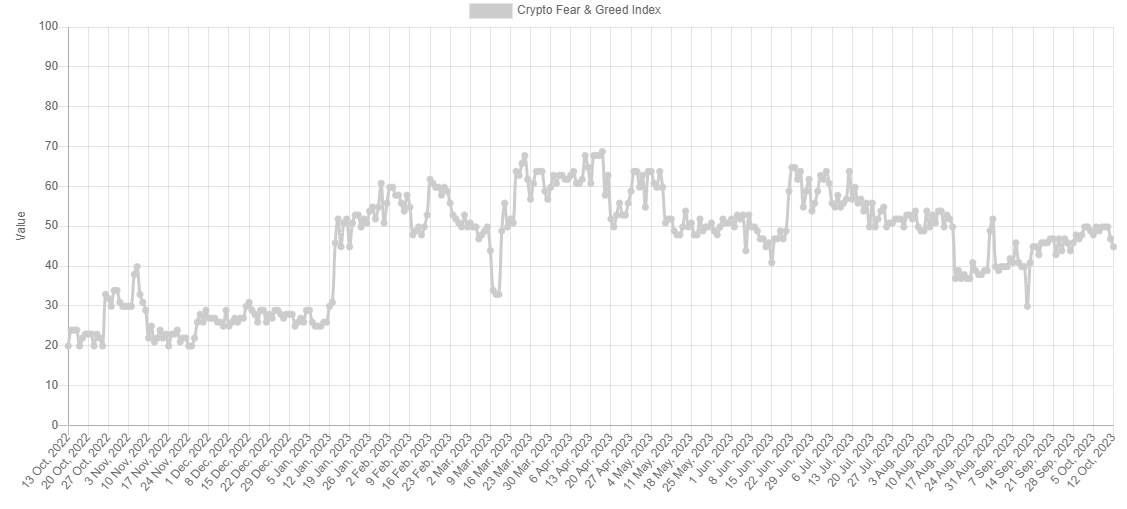
After this latest drop in sentiment, the fear and greed index has hit a value of 45, meaning that investor sentiment has just entered the fear region.
Historically, the market has tended to move in a way that’s opposite to what the majority of the investors believe. The likelihood of such a contrary move happening increases as this imbalance in the sentiment rises.
While the holders are leaning towards one side (fear), the imbalance is small, as the fear and greed index is barely inside the territory. As such, the probability of a rebound would be pretty high right now (at least based on the sentiment).
Besides the core sentiments discussed before, there are also two special zones, called “extreme fear” (at or below values of 25) and “extreme greed” (at or above values of 75).
These regions are where the cryptocurrency has often turned around in the past. Naturally, bottoms have occurred in the former zone, while tops have formed in the latter area.
If the Bitcoin fear and greed index continues declining in the coming days and reaches values near the extreme fear region, a bounce could become a real possibility.
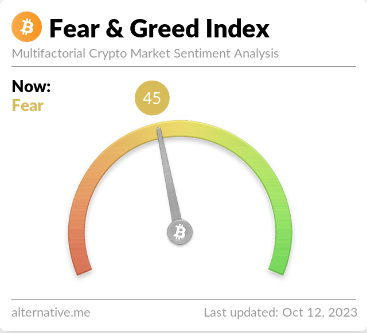
For now, one sign pointing to the chances of a rebound may be that the large investors have been buying recently, as an analyst on X pointed out.
Since the start of October, Bitcoin investors holding between 100 and 1,000 coins have purchased a combined 20,000 BTC worth around 3.6 million at the current exchange rate.
BTC Price
At the time of writing, Bitcoin is trading at around ,700, down almost 5% in the past week.
Bitcoin, Ethereum Technical Analysis: BTC Under $27,000, ETH Hits 1-Month Low Ahead of US Inflation Report

Bitcoin fell below the ,000 level on Thursday, ahead of the upcoming inflation report in the United States. Consumer prices are expected to have risen by 3.6% in September, down 0.1% from the month prior. Ethereum plunged to a multi-week low.
Bitcoin
Bitcoin (BTC) fell for a fifth consecutive day, as markets prepared for the release of last month’s U.S. consumer price index (CPI)
BTC/USD dropped to a low of ,561.10 earlier in the day, which comes less than 24 hours after trading at a high of ,258.45.
Thursday’s sell-off has seen the world’s largest cryptocurrency remain near its lowest point since the end of September.
Looking at the chart, the move pushed the relative strength index (RSI) to a support point at the 44.00 level.
Price strength has since marginally rebounded, and at the time of writing, is tracking at 45.28.
This floor may serve as a buffer ahead of the inflation report, which could then trigger an increase in volatility.
Ethereum
Ethereum (ETH) also experienced a plunge in price, with the cryptocurrency falling to a multi-week low.
Following a high of ,576.40 on Wednesday, ETH/USD dropped to a bottom at ,538.26 earlier in the session.
As a result, ethereum has now fallen to its weakest point since September 11, when the price traded below its ,540 support point.
The downtrend comes following a recent crossover of the 10-day (red) moving average and its 25-day (blue) counterpart.
Due to this bearish momentum, the RSI has fallen to a current reading of 36.88, which suggests volumes are marginally oversold.
This could prompt bulls to consider buying the dip, depending on today’s inflation report.
Register your email here to get weekly price analysis updates sent to your inbox:
Will US inflation fall below 3.6%? Leave your thoughts in the comments below.
Bitcoin Surge Above $27,000 May Not Last, Here’s Why
Bitcoin has broken back above the ,000 level during the past day, but if on-chain data is to go by, this surge may not last for long.
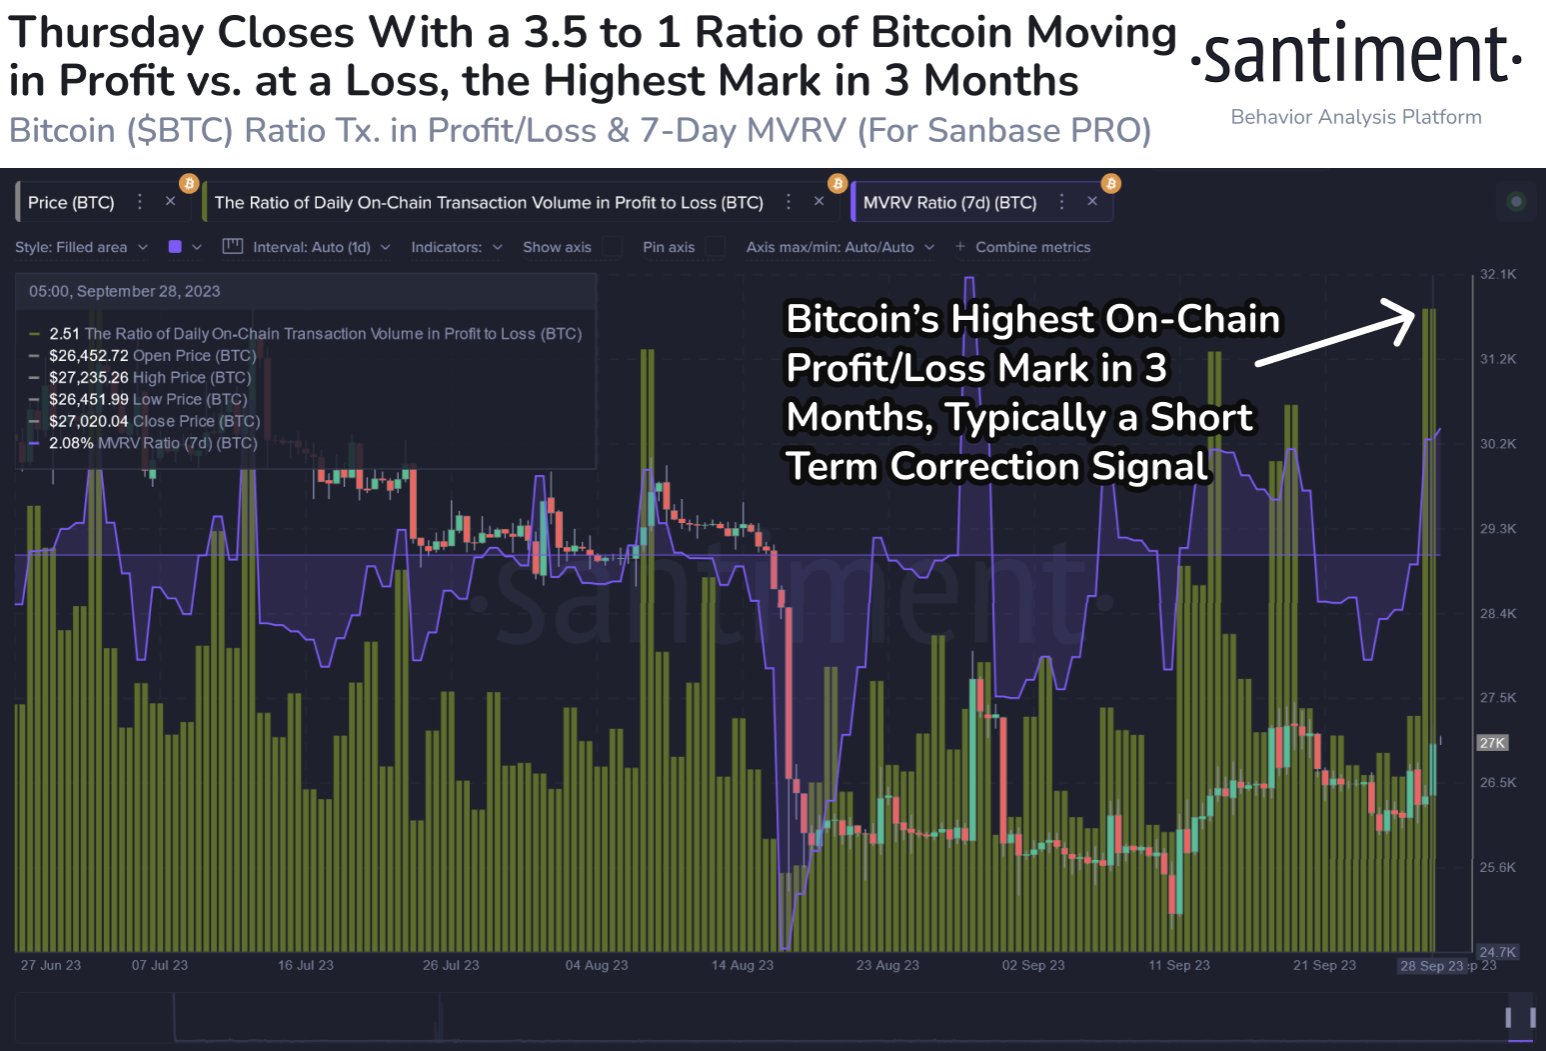
Bitcoin Investors Are Taking Profits At Highest Rate In 3 Months
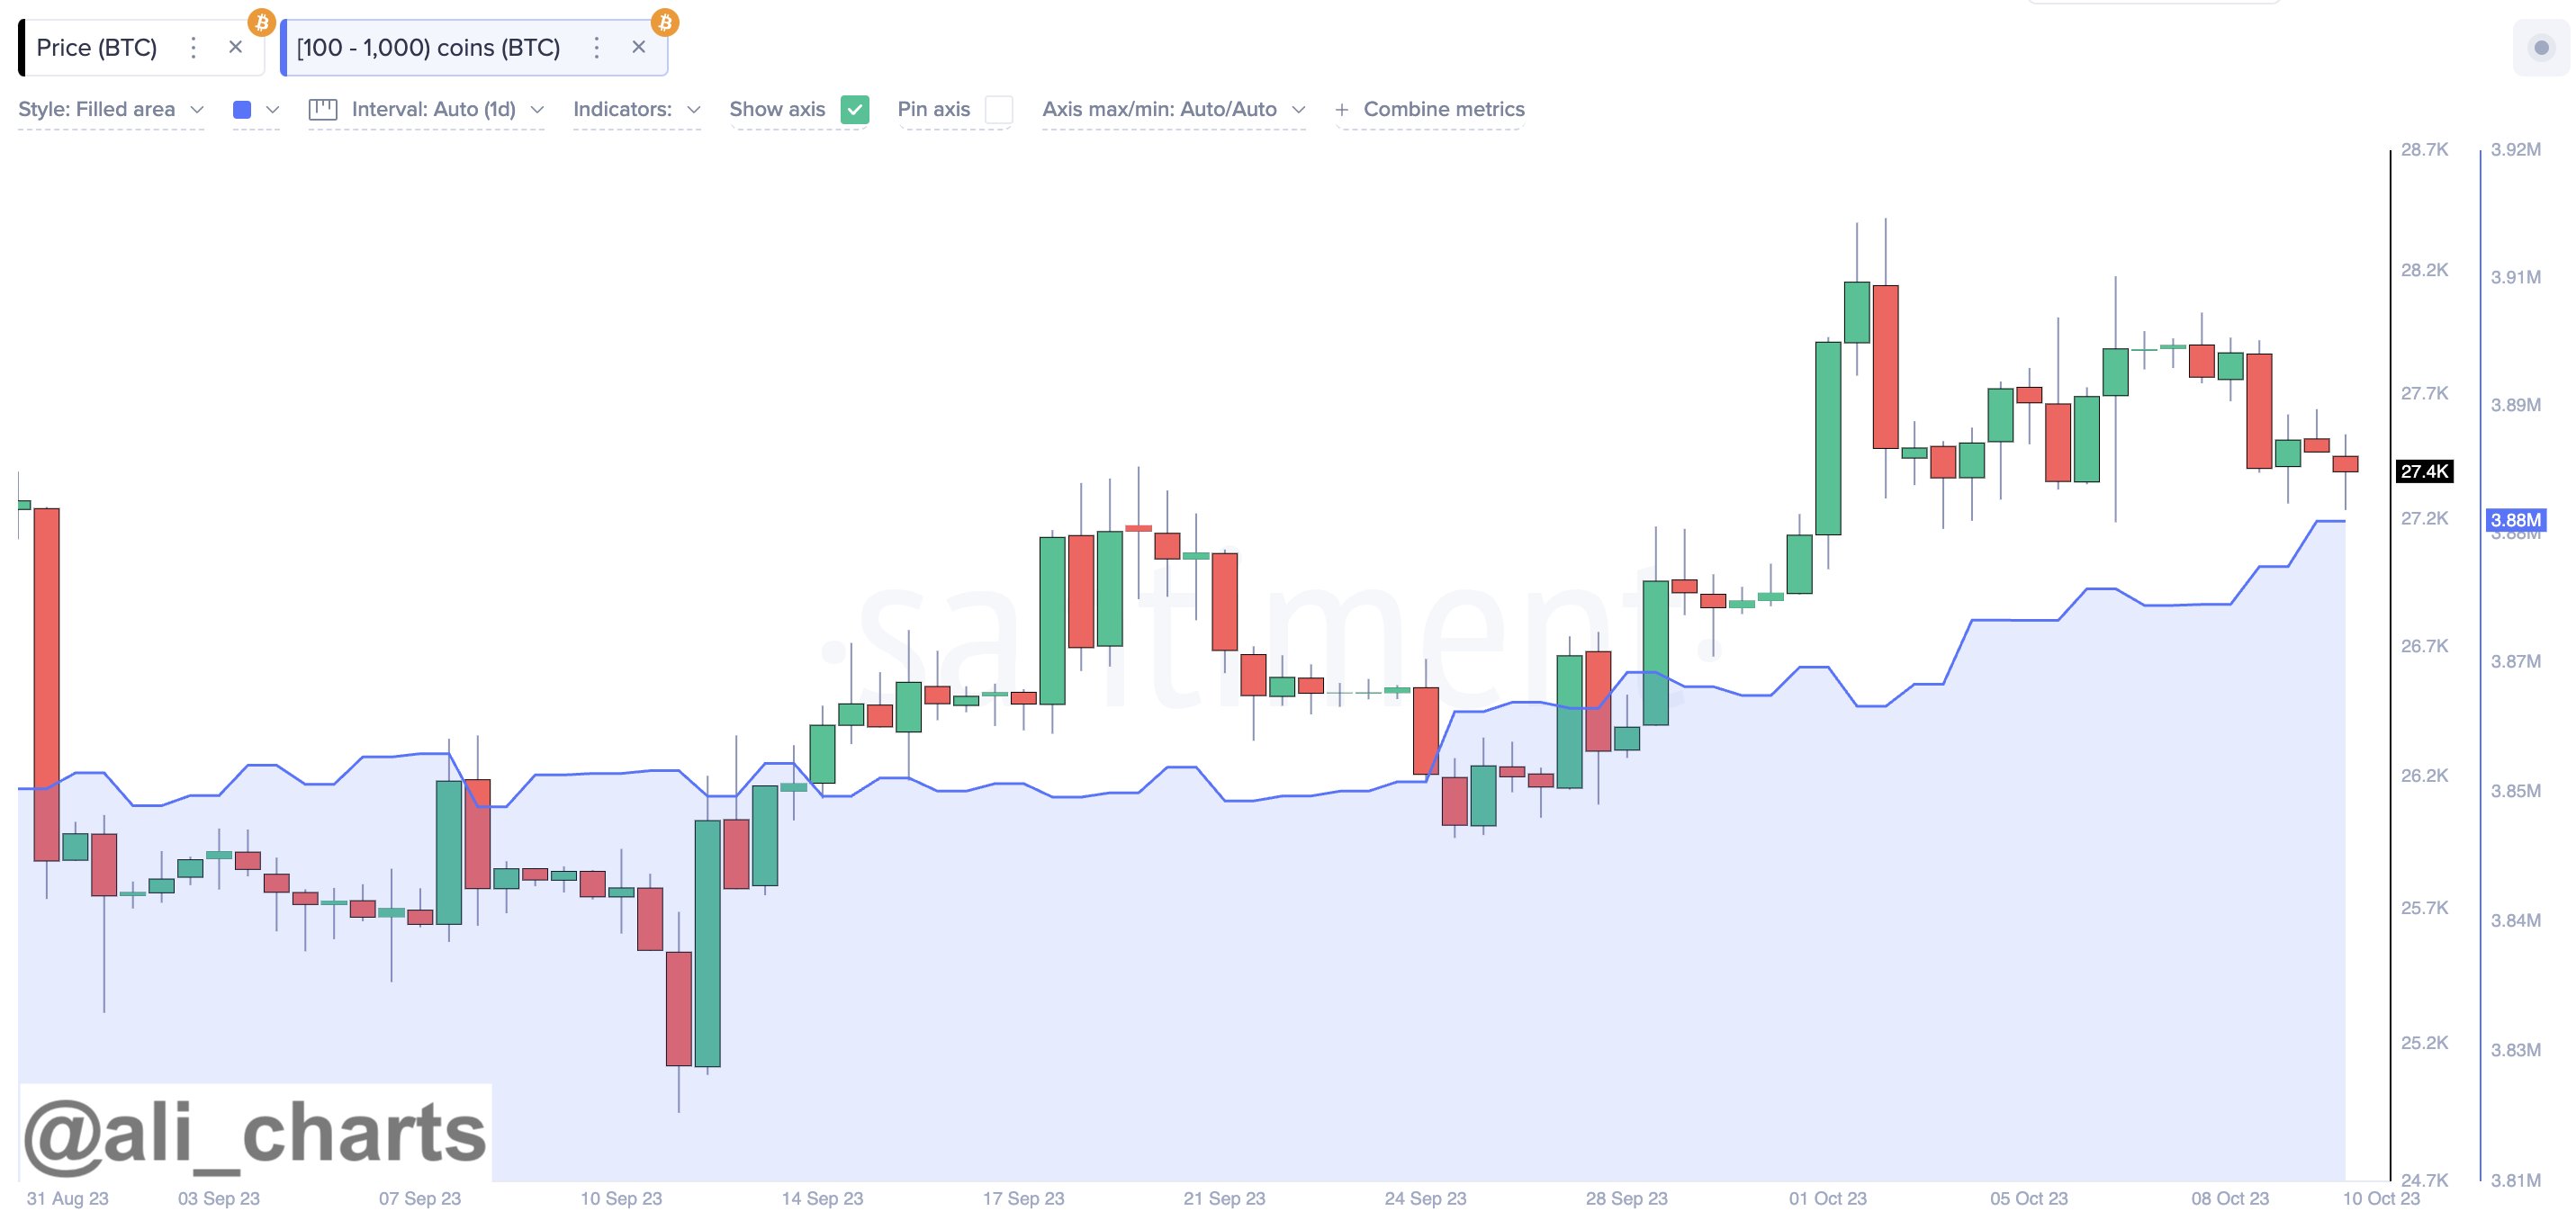
According to data from the on-chain analytics firm Santiment, there is a chance that a short-term correction could happen for the cryptocurrency. The relevant metric here is the “ratio of daily on-chain transaction volume in profit to loss,” which, as its name suggests, tells us about how the profit-taking volume compares against the loss-taking volume on the Bitcoin network right now.
This indicator works by going through the transaction history of each coin being sold/transferred on the blockchain to see what price it was moved at before. If this previous selling price for any coin was less than the current spot price, then that coin is being sold at a profit right now.
The sale of all such tokens would contribute toward the Bitcoin profit-taking volume, while coins of the opposite type would add towards the loss-taking volume.
Now, here is a chart that shows the trend in this BTC metric over the past few months:
As displayed in the above graph, this Bitcoin indicator has observed a large spike as the cryptocurrency’s price itself has seen a surge beyond the ,000 mark and has reached a value of 2.51.
When the metric has a value greater than zero, it means that the profit-taking volume is more than the loss-taking volume. On the other hand, values under this threshold suggest the dominance of loss-taking.
At the current value of 2.51, the profit-taking volume outweighs the loss-taking one by 3.51 to 1. This disparity between these two volumes is the highest it has been since around three months ago.
Historically, intense profit-taking has usually resulted in at least a short-term top for Bitcoin, so it’s possible that the current values of the metric would also result in a correction for the price.
In the chart, Santiment has also attached the data for the “Market Value to Realized Value (MVRV) ratio,” which keeps track of the difference between the Bitcoin market cap and realized cap.
The latter of these is basically a measure of the total amount of capital that the investors as a whole have put into the cryptocurrency, so this metric tells us how the value that the holders are carrying currently compares with their total investment.
From the graph, it’s visible that the 7-day Bitcoin MVRV ratio has turned notably positive with this rise, which implies that the investors are carrying profits at the moment.
The analytics firm notes that this metric going back below zero would be ideal for the next leg up, as the holders being in loss would lead to an exhaustion of the profit-sellers.
BTC Price
So far, despite the aggressive profit-taking happening in the market, Bitcoin has managed to hold above the ,000 mark.
Bitcoin, Ethereum Technical Analysis: BTC Above $27,000, ETH Reaches 1-Month High
Bitcoin continued to trade above the ,000 level on Friday, after a surge beyond this point towards the end of yesterday’s session. Ethereum rallied to a one-week high.
Bitcoin
Bitcoin remained above the ,000 level on Friday, following a late rise in bullish sentiment towards the end of Thursday’s session.
Following a low of ,424.95 on Thursday, BTC/USD raced to an intraday high of ,259.50 earlier in the day.
As a result of the move, bitcoin rose to its highest level since September 20, when price peaked at ,393.00.
However, earlier gains have since edged lower, largely due to a collision which took place on the relative strength index (RSI).
Looking at the chart, the index was unable to push past a resistance level of 58.00, and has since fallen to a reading of 56.57.
Traders could be awaiting the release of this afternoon’s consumer sentiment report in the United States, prior to deciding their next move.
Ethereum
Ethereum (ETH) continued to trend higher on Friday, breaking out of a key resistance level in the process.
ETH/USD peaked at ,687.28 earlier in today’s session, which comes a day after trading at a low of ,620.68.
This surge has resulted in ethereum climbing over a long held ceiling at ,670, hitting a one-month high in the process.
The latest uptrend coincided with the relative strength index moving beyond a ceiling of its own at 57.00. It is now tracking at 58.61.
Bulls will likely remain unsatisfied until they take ethereum back above ,700, which hasn’t happened since the end of August.
Register your email here to get weekly price analysis updates sent to your inbox:
Will ethereum extend this rally into the weekend? Leave your thoughts in the comments below.
Liquid-Staking Token-Backed Stablecoin MKUSD Surges 27,000% in Under a Month

Since the start of 2023, the size of the stablecoin economy has decreased amid numerous redemptions. However, new stablecoin asset projects, such as Aave’s GHO, First Digital’s FDUSD, and Paypal’s PYUSD, have emerged. On September 1, a stablecoin protocol named Prisma Finance was launched, enabling users to deposit liquid staking derivative tokens for a token called MKUSD. Since its inception, the protocol has secured million in locked value.
Prisma Finance Stablecoin MKUSD Joins 3B Fiat-Pegged Crypto Economy
Another stablecoin, MKUSD, has entered the stablecoin economy, a large group of fiat-pegged coins now valued at 3 billion as of September 23. The stablecoin originates from a decentralized finance (defi) protocol named Prisma Finance, which officially launched on September 1, 2023. Prisma’s stablecoin MKUSD is described as a “non-custodial and decentralized Ethereum liquid-staking-token (LST)-backed stablecoin.”
In essence, Prisma users deposit supported liquid staking tokens into a vault to borrow MKUSD. If the collateral ratio drops below 120%, the vault can be liquidated. A stability pool takes on the liquidated debt and distributes collateral to providers. Supported collateral types are WSTETH, CBETH, RETH, and SFRXETH. The minted MKUSD can be used on other defi platforms or later redeemed for the liquid-staking tokens (LSTs).

LSTs have become extremely popular over the past two years and there’s 11.96 million ether locked into LST platforms. At its launch, the Prisma project set its borrowing limit in phases, and by September 15, Prisma had secured million. Presently, defillama.com data indicates that Prisma’s total value locked (TVL) is .16 million.
Etherscan shows the circulating supply of MKUSD is 29.99 million tokens. The token only has a mere 129 holders and the “Stability Pool” address commands 71.39% of the total supply. A stability pool is essentially a mechanism used by defi projects that ensures the supply of a stablecoin is always backed. The second-largest MKUSD wallet is held by Curve Finance and it holds 14.30% of the MKUSD in circulation.
Compared to the major stablecoins like USDT and USDC, MKUSD is considerably smaller. It also lags behind newcomers FDUSD and PYUSD but surpasses GHO’s supply of 22,706,149. There are about 368,787,867 FDUSD and 44,376,440 PYUSD. All four stablecoins – MKUSD, FDUSD, GHO, and PYUSD – are heavily concentrated, with the top 100 holders in each project controlling the majority of the supply.
What do you think about the Prisma Finance defi protocol? Share your thoughts and opinions about this subject in the comments section below.
Bitcoin, Ethereum Technical Analysis: ETH Drops Under $1,600, BTC Consolidates Below $27,000

Ethereum continued to slip lower on Friday, as the cryptocurrency fell below the ,600 level in today’s session. Crypto markets have mostly consolidated since the Federal Reserve opted to keep rates unchanged earlier this week, with the global market cap down nearly 1%, as of writing. Bitcoin continued to trend lower.
Bitcoin
After falling to its lowest point since Monday late in yesterday’s session, bitcoin (BTC) was marginally higher today.
BTC/USD fell to a low of ,389.30 on Thursday, and at the time of writing, has rebounded to ,641.77.
This, however, still remains below yesterday’s peak of ,786.10, and almost ,000 away from a recent three-week high.
The decline comes as the 14-day relative strength index (RSI) fell to a one-week low in the last 24 hours, before finding a stable floor.
At the time of writing, price strength is tracking at 50.77, which is marginally above the aforementioned support at 50.00.
Should bulls opt to reenter after recent days of consolidation, they will likely target the 56.00 level on the indicator.
Ethereum
Ethereum (ETH) fell below the ,600 level in today’s session, as bearish pressure continued to intensify.
Following a high of ,601.54 on Thursday, ETH/USD slipped to an intraday low ,573.31 later in the day.
This was the lowest point ethereum had fallen to since September 12, when price bottomed out at ,549.
Bulls have since bought this dip, with the world’s second largest cryptocurrency rebounding to a current level at ,597.46.
As such, the 10-day (red) and 25-day (blue) moving averages have neared one another, with the prospect of an upward cross seeming imminent.
Should this occur, there could be a bull run in ETH this weekend.
Register your email here to get weekly price analysis updates sent to your inbox:
Where will ethereum end up this coming weekend? Leave your thoughts in the comments below.
Fed Holds Interest Rates Steady, Bitcoin Awaits Trend Reversal Above $27,000
In a highly anticipated announcement for the overall cryptocurrency market and Bitcoin (BTC), the Federal Reserve (Fed) opted to maintain interest rates at their current level, ranging between 5.25% and 5.5%.
The decision aligns with market expectations and signals a continuation of the Fed’s existing policy stance. While the interest rate decision had no immediate impact on Bitcoin’s price, cryptocurrency analysts anticipate a potential shift in market dynamics.
Analysts Predict Bitcoin Reversal Following Fed’s Decision
Bitcoin, the leading cryptocurrency in terms of market capitalization, has experienced a period of consolidation around the crucial ,000 support level for the past two days.
Despite the absence of significant price fluctuations immediately following the recent interest rate decision, market experts believe this stability could potentially signify the beginning of a trend reversal.
Renowned cryptocurrency analyst Michael Van De Poppe shared his perspective on X (formerly Twitter), suggesting that the era of interest rate hikes may have reached its conclusion.
Van De Poppe went on to indicate that Bitcoin is likely to embark on an upward trajectory from this juncture, noting the importance of exercising caution when interpreting price movements following major news events.
Van De Poppe’s remarks mirror the sentiment among BTC enthusiasts who anticipate the Federal Reserve’s decision to act as a catalyst for the cryptocurrency’s resurgence.
The prevailing hope is that this decision could mark the end of the current market downtrend, paving the way for Bitcoin to reach new yearly highs before the conclusion of 2023.
BTC’s Historical Patterns Suggest Potential Bottom Formation
Crypto Con, a renowned crypto analyst provided insights into Bitcoin’s price movements, focusing on its historical patterns and the MVRV (Market Value to Realized Value) deviation bands.
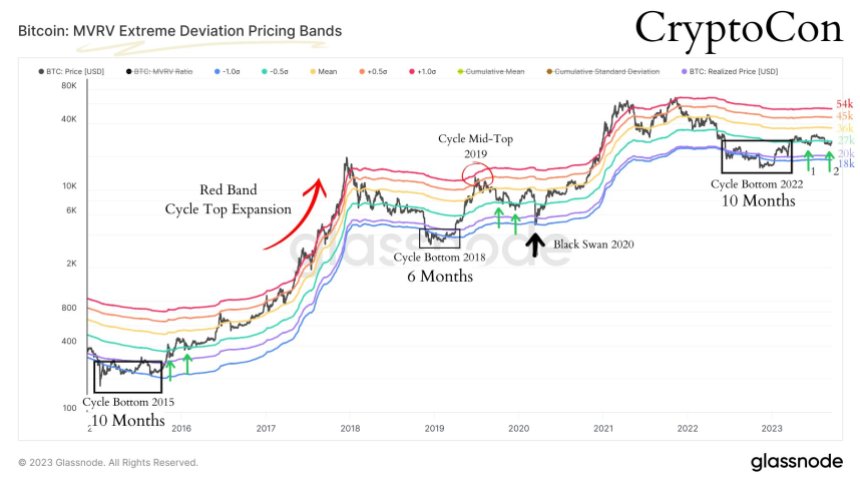
Crypto Con’s analysis highlights the significance of BTC’s recent visit just below the green band, as seen in the chart above, drawing parallels to previous market cycles.
Drawing on historical data, Crypto Con notes that Bitcoin spent approximately 10 months hovering around the bottom purple and blue deviation bands before making its second visit just below the green band.
In 2016, this particular pattern marked a local bottom, and in 2019, it would have done the same if not for unforeseen circumstances such as the black swan event.
Comparing the duration spent at the bottom during the current cycle to that of 2015, Crypto Con highlights a striking similarity. This observation raises the question of whether the significant downside experienced in 2019 was a consequence of the massive price surge that preceded it, with Bitcoin even reaching the cycle top band.
The current value of the red band stands at ,000, according to Crypto Con’s analysis. However, he assures that this value is subject to change as the market progresses toward “the endgame”.
At present, Bitcoin is trading at ,100, indicating no change in the 24-hour timeframe. As a result, the impact of the Federal Reserve’s decision on the cryptocurrency and the broader market in the short term remains uncertain.
Whether this news will have a positive effect shortly or prove beneficial for the remainder of the year is yet to be determined.
Featured image from iStock, chart from TradingView.com