 At this moment, Tesla’s Elon Musk holds the title of the wealthiest individual on the planet, as reported by the Forbes Real Time Billionaires list on June 1, 2024. However, there exists a potential future where Bitcoin’s creator, Satoshi Nakamoto, could surpass Musk’s fortune. Given the current value of BTC, the price would need to […]
Bitcoin News
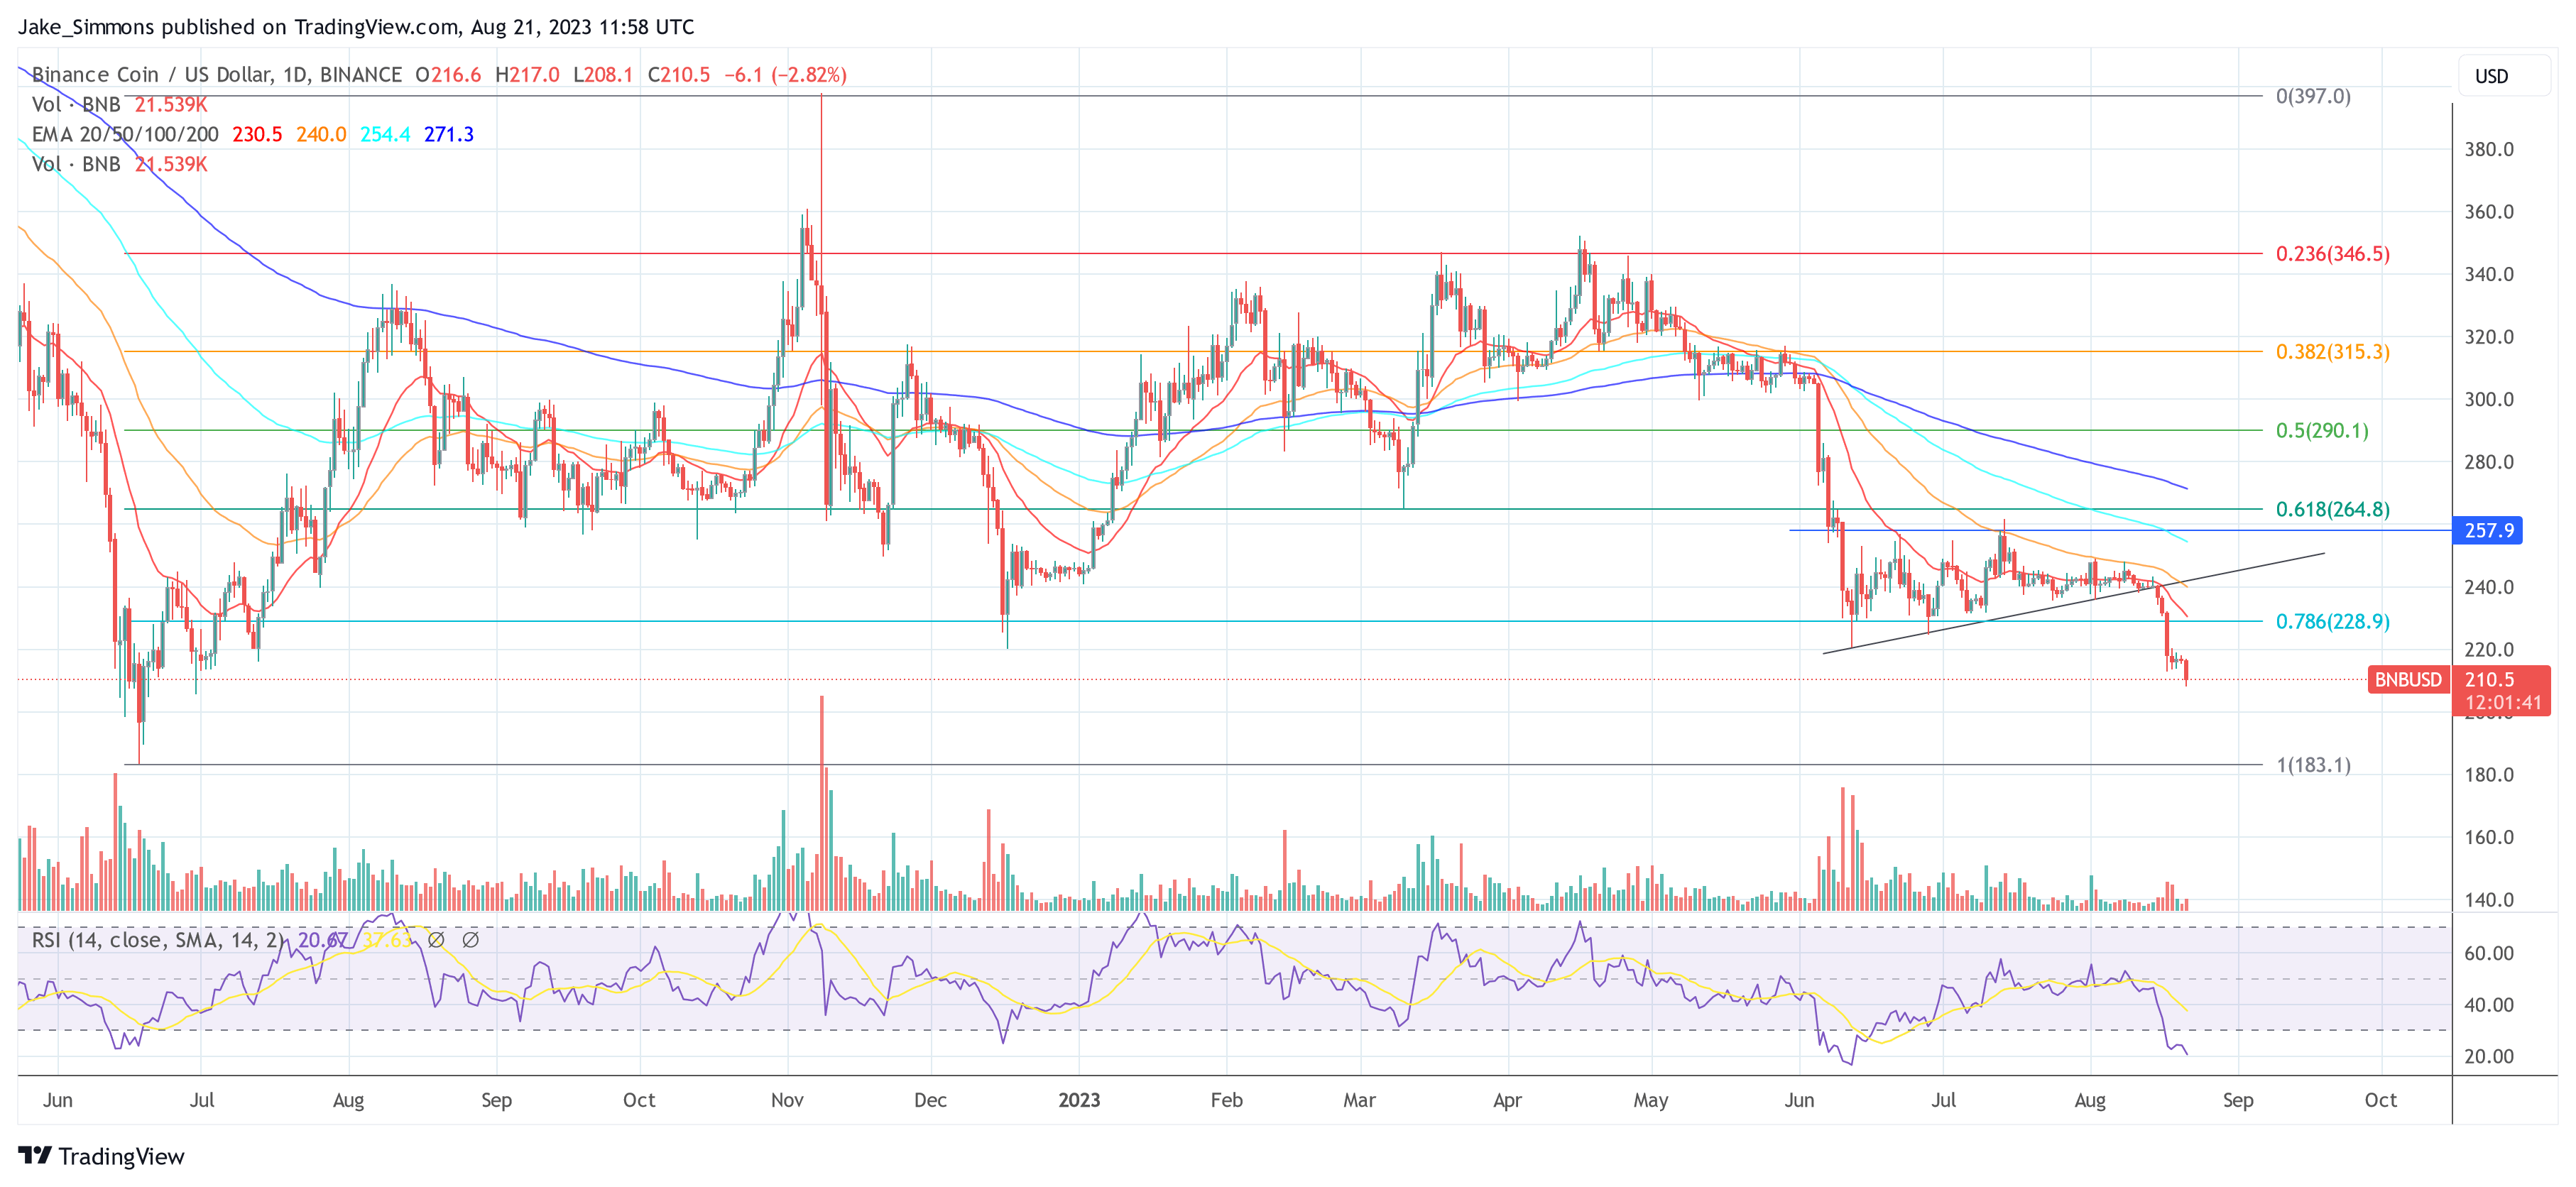
Binance Coin Falls Below $210 As BNB Bridge Hacker’s Health Rate Sinks To 0.99
In a complex tangle of smart contracts, governance proposals, and fluctuating crypto prices, the financial health rate of the infamous Binance BNB Bridge exploiter address (0x48…9bec) has fallen below the critical value of 1, hovering at 0.99. This development is of particular interest, given that the address holds a significant collateral of 784,616.10 BNB and a debt position in the form of USDT and USDC totaling 4 million.
The plummeting health rate comes amidst the fall of Binance Coin (BNB) to 7.9, well below the pre-determined liquidation price of 0.80, leading to increased speculation about potential liquidation scenarios.
As per a tweet from blockchain security firm PeckShield: “The health rate of the BNB Bridge Exploiter on Venus is 0.99. BNB has dropped to 7.9. The Venus community has passed a governance proposal to whitelist liquidation of the BNB Bridge exploiter’s position before.”
Liquidation Contingency: The Binance Plan
He Yi, the co-founder of Binance, alleviated some concerns stating, “The BNB collateral of Venus is covered by Binance. When the price of BNB falls, Binance will liquidate it in time. These BNB will not affect the secondary market price, and Binance will be responsible for burning these additional BNB.”
Nevertheless, the crypto community and analysts alike are closely following the situation, speculating on whether Binance CEO Changpeng Zhao, commonly known as CZ, intends to execute the liquidation to remove the illegitimate BNB from the ecosystem.
Renowned analyst Skew remarked regarding the currently ongoing price movements: “”BNB Shorts going at it again + -24% APR (24hr). BNB Aggregate CVDs show takers are net sellers on the day so far. BNB Binance Spot: Quite a lot of spot bids below down to 0, so there will need to be a frenzy of spot selling in order to cause price dislocation or a crash. Large limit buyer has been trying to absorb the sell pressure.”
Crypto influencer MartyParty brought this hypothesis into the limelight, stating, “Is CZ trying to liquidate the Venus loan to burn the 900k illegal BNB? Based on the Venus protocol documentation, the loan would have to be liquidated to burn the illegal BNB. That is the only way to remove it from the ecosystem.”
This liquidity and governance issue comes after an “exploiter” illegally minted 2 million $BNB through a vulnerability in BNB Bridge, which has since been repaired. Of this illegally minted BNB, 900,000 BNB was used as collateral on Venus Protocol to obtain a loan exceeding 0 million in stablecoins, which was then dispersed across multiple blockchains.
On June 12, 2023, a potential liquidation was averted when Binance stepped in to add million in USDT margin, bringing the liquidation price down to 2. Again on August 17, another liquidation was sidestepped, pulling the liquidation threshold down to 0.80 and consequently the health rate to 1.02.
In an earlier reaction to MartyParty’s query, CZ seemed unfazed: “Took me a while to understand (IF I even vaguely understand now). So, Marty is worried about a -120m worth re-buy of #BNB? Maybe he should check the last BNB burn? or the #SAFU insurance fund size?”
He also commented on the volatility of BNB, adding, “And where did the 2 magic number come from? #BNB price is determined by the market. A m re-buy is less than 4% of a single day’s volume.”
As of this writing, the market is still uncertain, waiting for further signals from CZ, who hasn’t commented on the latest developments. Meanwhile, Arkham Intelligence’s dashboard remains a focal point for real-time updates on the loan status and the health rate of the exploiter’s account. At press time, no liquidation took place yet.
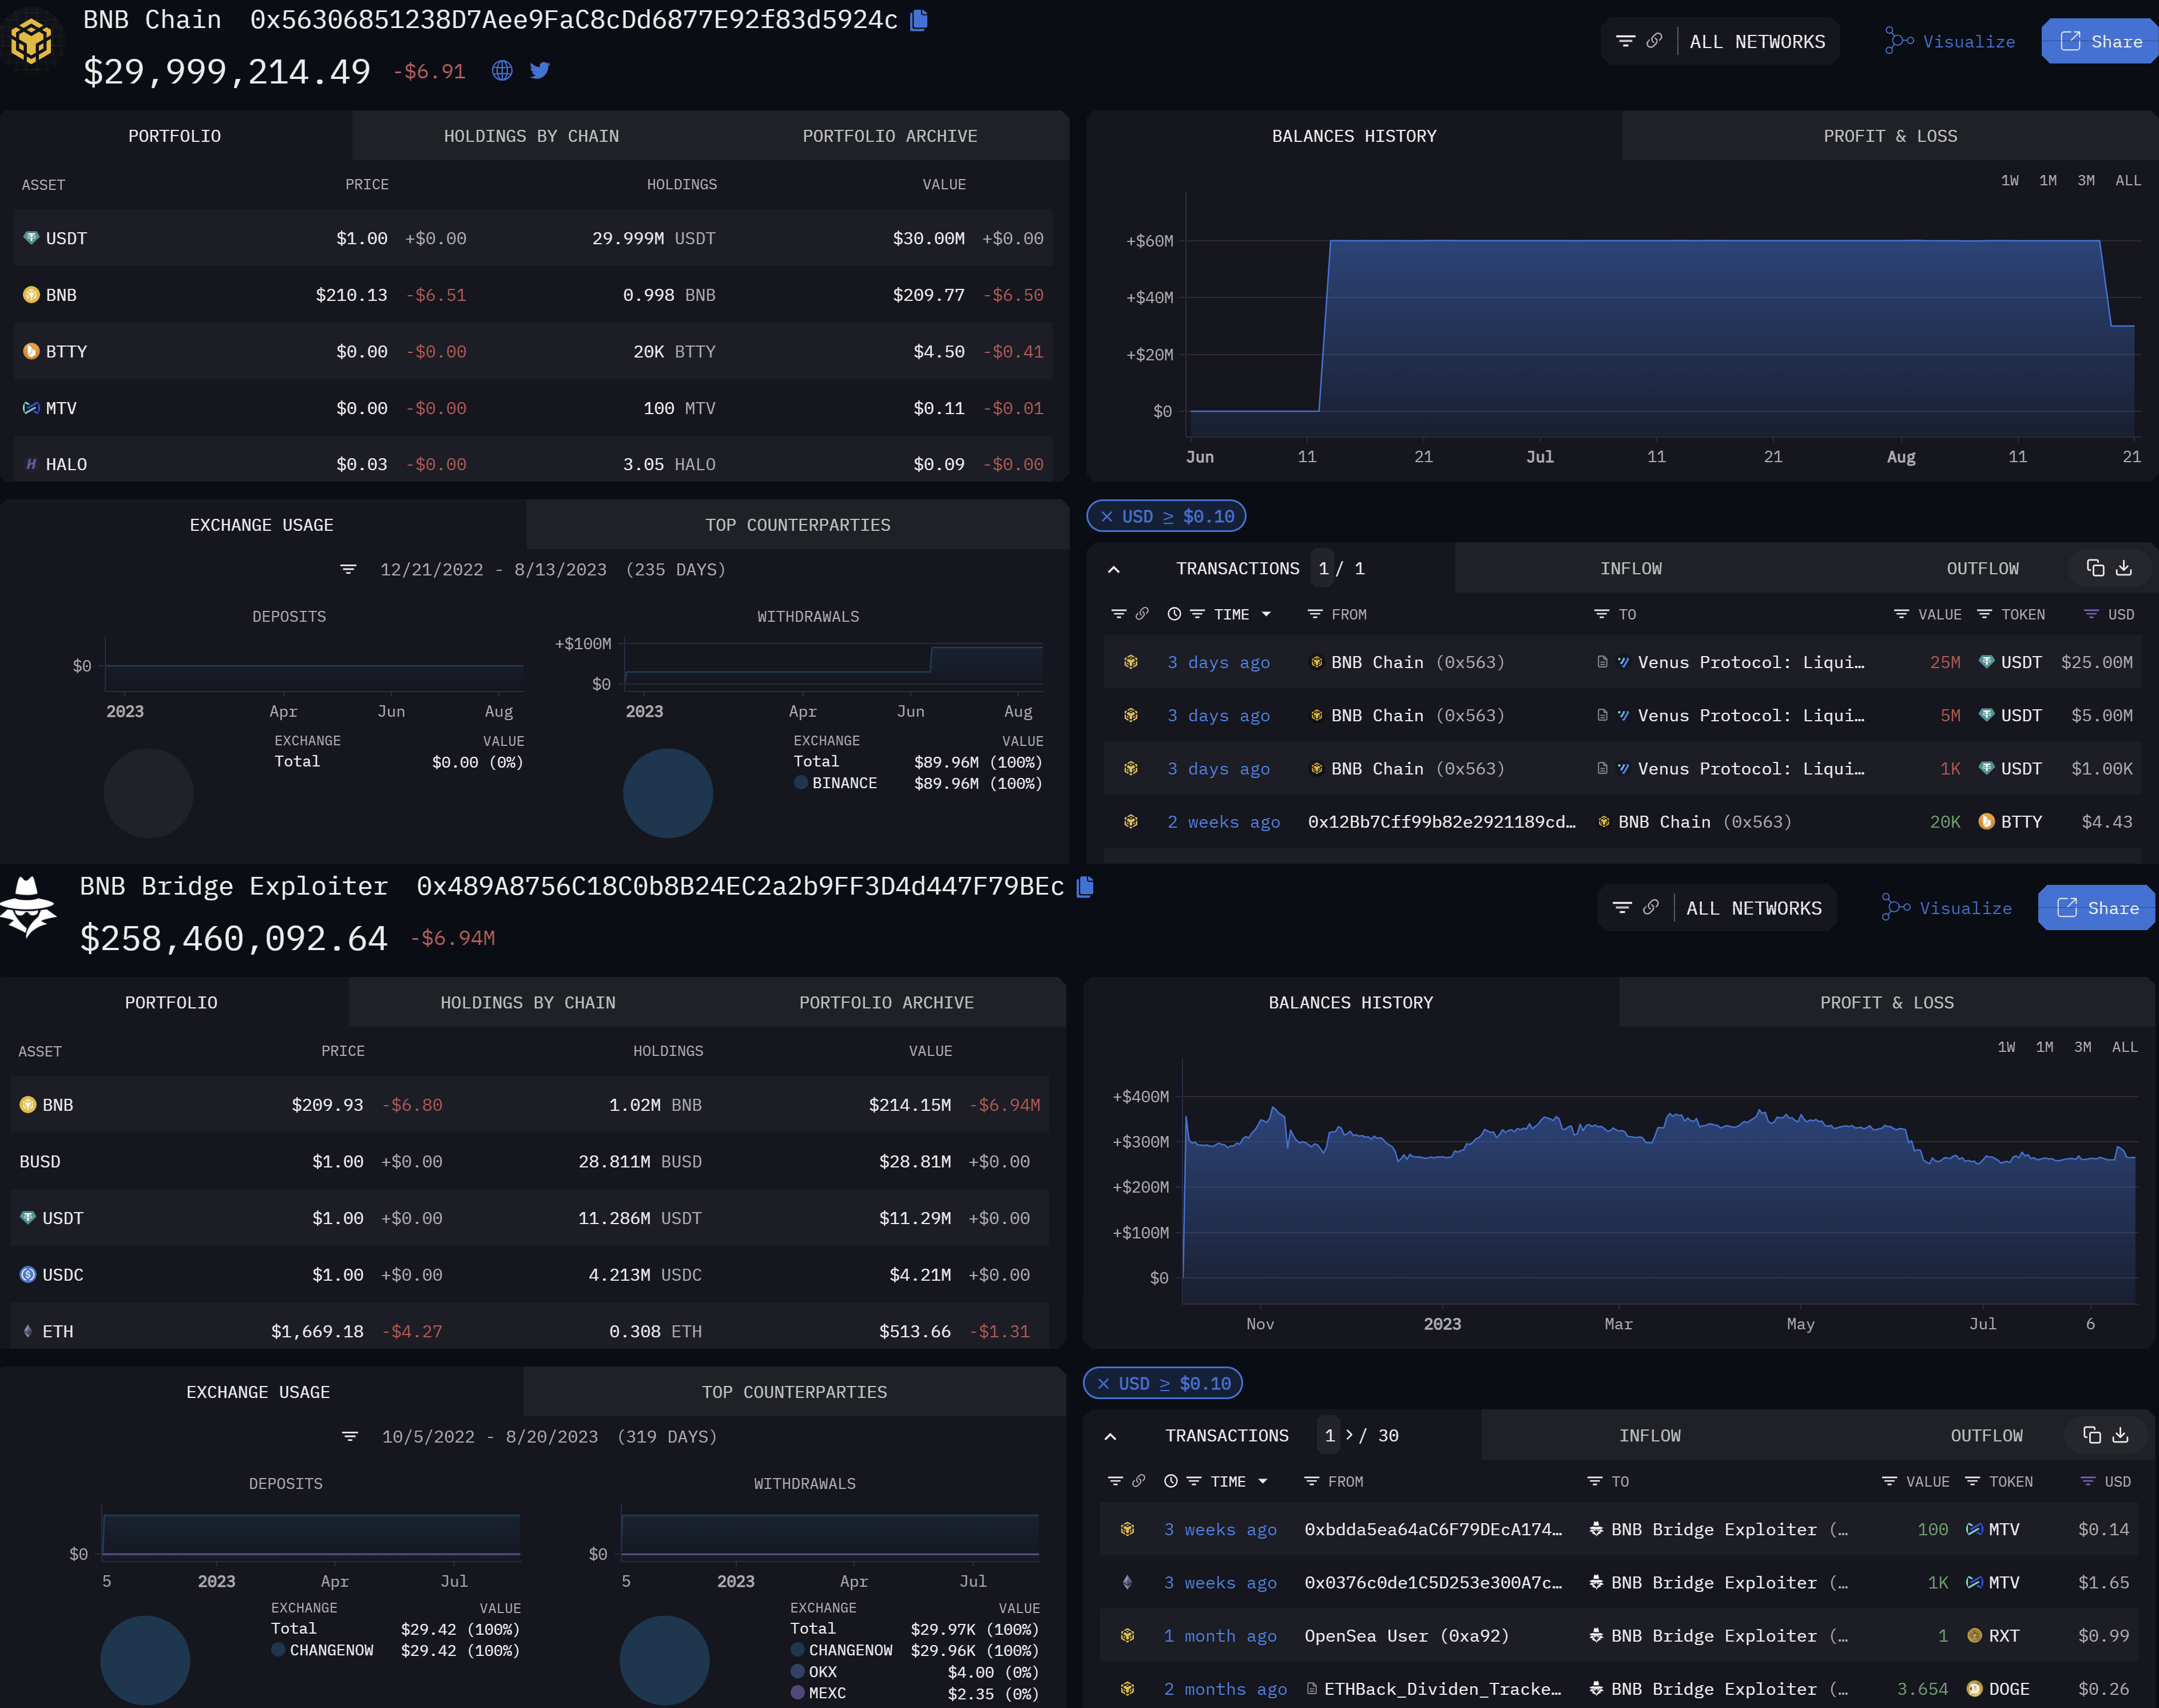
At press time, the BNB price was at 0.5.
Crypto Industry Report: BTC Beats Nasdaq Index and Gold in Q1, Liquid Staking Governance Tokens up by 210%

According to the latest Coingecko crypto industry report, during the first quarter of 2023, bitcoin became the best-performing asset after it saw its U.S. dollar value go up from just under ,000 observed on Dec. 31, 2022, to just over ,000 by March 31, 2023. The report attributes the crypto asset’s resurgence to “increased volatility from the banking crisis” and to Binance’s decision to end part of its zero-fee incentive scheme for bitcoin trades.
Bitcoin Beats Nasdaq Index and Gold
After closing the past year trading below ,000, bitcoin staged a comeback that saw it close the first quarter (Q1) of 2023 trading above ,000. With this performance, bitcoin, which eventually went past the ,000 level, has outperformed major asset classes including the Nasdaq index and gold, data from the latest Coingecko crypto industry report has shown.
As shown in the report, bitcoin’s quarter-on-quarter (QoQ) growth of 72.4% makes it the best-performing asset during the period. The Nasdaq index and gold were the second and third-best performers with gains of 15.7% and 8.4%, respectively.
Although bitcoin and the entire crypto market’s recovery are known to have begun sometime in January, according to the report, the U.S. banking crisis might be the primary reason why interest in this asset class has surged.
“Trading volume saw an upswing in January 2023, when the market started rallying. It then spiked momentarily in early March due to increased volatility from the banking crisis, before tapering off in late March, when Binance removed part of their zero-fee trading incentives for BTC,” the Coingecko report said.
Stablecoins Lose Ground in Q1
With respect to stablecoins, the report said the market capitalization of this asset class had dropped by 4.5% or .5 billion “due to the shutdown of Binance USD (BUSD) by Paxos and the brief USD Coin (USDC) de-pegging event during SVB’s collapse.”
Meanwhile, the Coingecko report also reveals that the market capitalization of decentralized finance (defi) surged by 65.2% to end the quarter at .6 billion. Liquid staking governance tokens saw their value grow by 210.9% in Q1, thus making them “the 3rd largest category in defi.”
During the same period, trading volumes on non-fungible token (NFT) platforms also went up from .1 billion in the last quarter of 2022, to .5 billion. According to the report, a large share of these volumes came from Blur, which recently took Opensea’s place as the most dominant NFT platform.
What are your thoughts on this story? Let us know what you think in the comments section below.
Ethereum Could Narrowly Avoid a Major Downtrend if it Breaks $210
Ethereum failed to continue above the 0 resistance and declined recently against the US Dollar. ETH price must stay above 5 and 2 to avoid a major downtrend.
Ethereum is still struggling to break the 0 and 5 resistance levels.
The price might start a decent recovery wave as long as it is above the 2 support zone.
There is a major bearish trend line forming with resistance near 5 on the hourly chart of ETH/USD (data feed via Kraken).
The pair could avoid a significant decline if it breaks the 0 resistance zone.
Ethereum Price is Facing Hurdles
After two rejections near the 0 resistance, Ethereum price started a fresh decline against the US Dollar. Bitcoin price also declined below the ,000 support, sparking a bearish wave in ETH below the 2 level.
The price broke the 0 support and tested the 8 level. A low is formed near 8 and the price is currently correcting higher. There was a break above the 0 and 2 levels. Ether also climbed above the 23.6% Fib retracement level of the recent decline from the 0 high to 8 low.
On the upside, there is a strong resistance forming near the 5 level and the 100 hourly simple moving average. There is also a major bearish trend line forming with resistance near 5 on the hourly chart of ETH/USD.
Ethereum Price
The trend line is close to the 50% Fib retracement level of the recent decline from the 0 high to 8 low. If there is an upside break above the 5 resistance, the price could make another attempt to clear the 0 resistance zone.
If the bulls succeed in clearing the 0 resistance, the price could avoid a major downtrend and it might continue to move higher towards the 0 and 0 levels.
More Losses
If Ethereum fails to clear the 5 and 0 resistance levels, the price could resume its decline. If there is a downside break below the 0 support, the price could even trade below the 8 low.
In the mentioned case, the price could dive towards the 2 support level. Any further losses may perhaps start a major downtrend in the coming sessions.
Technical Indicators
Hourly MACD – The MACD for ETH/USD is about to move back into the bullish zone.
Hourly RSI – The RSI for ETH/USD is now correcting higher towards the 50 level.
Major Support Level – 8
Major Resistance Level – 5
Take advantage of the trading opportunities with Plus500
Risk disclaimer: 76.4% of retail CFD accounts lose money.
NewsBTC
Do or Die For Bulls: Can Ethereum Surge Past $210 & $220?
Ethereum is struggling to gain bullish momentum above the 0 and 0 resistance levels against the US Dollar. ETH price remains at a risk of drop below 0 if it continues to struggle near 0.
Ethereum is facing an uphill task near the 0 and 1 resistance levels.
A crucial support is forming near the 7-8 zone.
There is a major bearish trend line forming with resistance near 0 on the hourly chart of ETH/USD (data feed via Kraken).
The bulls must gain strength above 0 for a sustained move towards 0 and 0.
Ethereum Price Trading Near Key Hurdle
Recently, Ethereum made another attempt to surpass the 0 resistance against the US Dollar, but it failed. ETH price formed a short term top near 1 and declined sharply.
There was a break below the 2 support zone, but the 7-8 region acted as a strong buy zone. Ether price traded as low as 7 and it is currently rising. There was a break above the 2 and 5 levels.
The price surpassed the 50% Fib retracement level of the recent decline from the 1 high to 7 low. However, Ethereum is currently struggling to clear 8 and the 100 hourly simple moving average.
There is also a major bearish trend line forming with resistance near 0 on the hourly chart of ETH/USD. An intermediate resistance is near the 76.4% Fib retracement level of the recent decline from the 1 high to 7 low.
Ethereum Price
To move into a positive zone and start a strong upward move, the price must break the 0 and 1 resistance levels. If the bulls gain bullish momentum above 1, the price is likely to grind higher towards the 0 level. The next major resistance is seen near the 0 level.
Another Failure?
If Ethereum fails again to break the 0 and 1 resistance levels, there could be another bearish reaction. An initial support on the downside is near the 2 level.
The main support is now forming near the 7 and 8 levels. If the price fails to stay above 0 and settles below 7, there is a risk of a significant decline towards the 2 and 0 support levels.
Technical Indicators
Hourly MACD – The MACD for ETH/USD is about to move into the bullish zone.
Hourly RSI – The RSI for ETH/USD is currently just below the 50 level.
Major Support Level – 0
Major Resistance Level – 1
Take advantage of the trading opportunities with Plus500
Risk disclaimer: 76.4% of retail CFD accounts lose money.
NewsBTC
Ethereum Plunges To $210: Here’s Why $200 Could Be A Savior
Ethereum is down another 10% and it broke the main 0 support area against the US Dollar. ETH price is now approaching the key 5 and 0 support levels.
Ethereum is down more than 25% in the past two days against the US Dollar.
The price traded close to the 5 support area and it is currently consolidating losses.
There is a key bearish trend line forming with resistance near 2 on the hourly chart of ETH/USD (data feed via Kraken).
Bitcoin price is under a lot of pressure and it traded close to the ,500 support area.
Ethereum Price Nosedives
Yesterday, we saw a strong 10% decline in Ethereum after it broke the 0 support against the US Dollar. Later, the bears gained momentum and ETH price even dived below the main 0 support area.
Moreover, there was a break below the 0 level and the price settled well below the 100 hourly simple moving average. The decline was such that the price traded close to the 5 support area.
A new weekly low is formed near 8 and the price is currently consolidating losses. An initial resistance on the upside is near the 2 level. Besides, the 50% Fib retracement level of the recent slide from the 1 high to 8 low is also near 4.
More importantly, there is a key bearish trend line forming with resistance near 2 on the hourly chart of ETH/USD. Therefore, Ethereum is likely to face a lot of hurdles on the upside near 2 and 4.
Ethereum Price
The main resistance is now near the 0 area, plus the 61.8% Fib retracement level of the recent slide from the 1 high to 8 low. A successful close above the 0 area is needed to start a strong recovery in the near term.
In the mentioned case, the price could recover towards the 0 resistance level and the 100 hourly simple moving average.
0 As Key Support
On the downside, there are many important supports near the 5 and 0 levels. Ethereum bulls are likely to protect more losses below the 0 handle in the coming sessions.
If they fails to protect the 0 handle, it could initiate another slide and a medium term downtrend. The next major support is near the 8 level.
Technical Indicators
Hourly MACD – The MACD for ETH/USD is showing a lot of negative signs in the bearish zone.
Hourly RSI – The RSI for ETH/USD is still well below the 40 level, with a bearish angle.
Major Support Level – 5
Major Resistance Level – 2
NewsBTC
Ethereum May Incur Large Drop if Bulls are Unable to Defend $210
Ethereum’s massive upwards momentum has faltered after its bulls were unable to decisively support ETH above the 0 price level, and its inability to extend its upwards momentum likely stems in part from Bitcoin’s drop to its key support level of ,000.
Analysts are now noting that Ethereum is nearing a critical support level, and an inability for ETH to hold above this level could open the gates for further losses, while providing traders a great shorting opportunity.
Ethereum Drops Towards 0 as Sellers Step Up
At the time of writing, Ethereum is trading down nearly 2.5% at its current price of 1.75, which marks a fairly deep retrace from its daily highs of nearly 9, but a slight bounce from its daily lows of 0.
Ethereum tried and failed on multiple occasions to decisively break above 0 but was met with significant selling pressure with each visit above this price level.
Because 0 proved to be an insurmountable level of resistance for ETH to break above, it has since shed a significant amount of its recent gains but is still trading up significantly from its one-month lows of below 0.
Nik Patel, a popular cryptocurrency analyst, spoke about Ethereum’s recent price action in a blog post, explaining that the next key resistance level it faces in the near-term exists at 0, which is nearly 10% higher than its current price.
“Looking at ETH/USD, the next area of significance is the support/resistance flip from which price originally broke down at 0; however, prior to this, I would like to get long on a pullback towards trendline support,” he explained while pointing to a trendline support that exists within the lower 0 region.
Could a Dip Below 0 Spark an ETH Downtrend?
Although Patel believes that ETH will revisit its trendline before climbing to 0, UB, another popular crypto analyst, explained in a recent tweet that 0 is a key support level and that a break below it potentially opening the gates for a drop into the 0 region.
“$ETH – Currently sitting at Weekly Support. Ethereum needs to bounce soon or it’ll revisit mid to low 0s. I’ll add to my short on a Daily Close below ~0,” he explained.
$ETH – Currently sitting at Weekly Support. Ethereum needs to bounce soon or it'll revisit mid to low 0s.
I'll add to my short on a Daily Close below ~0.#Ethereum pic.twitter.com/r4RckMgO53
— UB (@CryptoUB) September 22, 2019
The coming days and weeks will likely elucidate Ethereum’s near-term trend, which may be largely swayed by Bitcoin’s price action in the coming days and weeks.
Featured image from Shutterstock.
The post Ethereum May Incur Large Drop if Bulls are Unable to Defend 0 appeared first on NewsBTC.
Ethereum Price Surges 6% to Top $210: FOMO in Full Swing
Ethereum bulls are back in full swing. As of the time of writing this, ETH’s price has just topped 0, pushing up by some 6% over the past 24 hours.
Related Reading: Low Volatility Bitcoin Price Action: Decision Time Is Near, Powerful Move Incoming
This strong move higher marks the end of a massive downtrend for Ethereum, in terms of its USD and Bitcoin pair. And analysts say this upward price action may not end any time soon.
Ethereum Price Surges Amid Fundamental Boom
For the first time in a blue moon, Ethereum is showing some brawn.
Over most of 2018, the cryptocurrency had a horrible showing, collapsing from an all-time high of ,400 to double digits, representing a nearly 95% drawdown. Simultaneously, the ETH/BTC pair tumbled to pre-ICO bubble levels, hinting that there was little fundamental demand for the project.
But, over the past few weeks, this has started to change. After bottoming at 0 and around 0.016 BTC, Ethereum has started to rally for both of the pairs.
Traders are saying that this move will likely set the stage for further gains. Rand recently stated that if ETH consolidates above 0, which has acted as an important line of support over the past year, a move to 0-0 is entirely possible.
$ETH is looking pretty strong here:
If consolidates over 0 we can get 0-0 easily. pic.twitter.com/xfxaLzhWYK
— Crypto Rand (@crypto_rand) September 16, 2019
This move comes as Ethereum’s fundamentals have turned decidedly bullish.
Last week, Spanish banking giant Santander revealed on Thursday that it had settled a million bond through ERC-20 tokens, which represented custodied cash, on the public iteration of the Ethereum blockchain.
This comes as the DeFi ecosystem has continued to gain steam, with DeFi Pulse stating that there the amount of ETH locked in Ethereum finance applications is reaching an all-time high. Simultaneously, the number of transactions made with Tether’s USDT stablecoin has continued to surge.
Also, BitPay has announced plans to integrate Ethereum into its leading payments processor, while a startup his announced plans to tokenize assets worth 0 million on the blockchain.
All this has amalgamated in dramatically increased usage of the Ethereum blockchain.
Bitcoin Dominance to Fall; Altcoins to Surge
Ethereum’s price action isn’t an isolated trend. Altcoins across the board have all showed strength over recent days, managing to outpace the market leader for the first time in about forever.
Just look to the chart from Coin360 below, which shows that leading altcoins are experiencing daily gains that are reminiscent of 2017’s bull rally.

This may continue, however. Crypto Thies, a prominent analyst, recently noted that his proprietary indicator for Bitcoin’s dominance chart recently printed a sell signal, suggesting a “potential change in trend” from a BTC-centric market to one that is led by crypto assets.
Also, Thies notes that the altcoin market capitalization has seen a higher low, implying bears are losing steam.
$BTC.D – #Bitcoin Market Dominance
– 1W Sell Signal from @MarketGodx, suggesting potential change in trend
– Higher Low on #TOTAL2 (AltCap)
– Rate of Change on $TOTAL now below ROC on #TOTAL2
Translation …
ᴀʟᴛꜱ ᴀʀᴇ ʙᴀᴄᴋ#TisTheSzn pic.twitter.com/wnKrHWXSTW
— 𝗖𝗿𝘆𝗽𝘁𝗼𝗧𝗵𝗶𝗲𝘀 (@KingThies) September 17, 2019
Featured Image from Shutterstock
The post Ethereum Price Surges 6% to Top 0: FOMO in Full Swing appeared first on NewsBTC.
Ethereum (ETH) Price In Uptrend: New Highs Above $210 Likely
- ETH price gained momentum and traded to a new monthly high at 0 against the US Dollar.
- The price corrected lower, but it remains well supported on the downside near 2.
- Yesterday’s highlighted key bullish trend line is active with support near 2 on the hourly chart of ETH/USD (data feed via Kraken).
- The pair is likely to climb above the 5 and 0 resistance levels in the near term.
Ethereum price climbed above 0 once again versus the US Dollar after bitcoin broke ,000. ETH price is in a nice uptrend and it may soon break the 0 swing high.
Ethereum Price Analysis
In the past three sessions, Ethereum price gained momentum above the 2 and 5 resistances against the US Dollar. The ETH/USD pair even broke the 0 resistance level and settled well above the 100 hourly simple moving average. The main driving force was bitcoin, climbing above the ,800 and ,000 resistance levels. Ether too gained traction and traded to a new monthly high above the 5 level. A swing high was formed near 0 before the price corrected lower.
It traded below the 5 and 0 levels, but the bulls remained in control. The price tested the 2 level and it is currently moving higher. An immediate resistance is 0, and the 50% Fib retracement level of the recent drop 0 high to 2 low. However, the main resistance is near the 4 level. If there is a proper close above 4, the price might break 5. The 5 level represents the 76.4% Fib retracement level of the recent drop 0 high to 2 low. The next resistance is near 0, above which the price is likely to climb higher towards 0.
If there are further gains, the price is likely surge higher towards the 0 level. On the downside, there is a decent support is near the 5 and 2 levels. Moreover, yesterday’s highlighted key bullish trend line is active with support near 2 on the hourly chart of ETH/USD. The key support is near 5 and the 100 hourly SMA.
Looking at the chart, Ethereum price is slowly gaining traction above the 8 and 0 levels. A clear break above the 5 level is likely to set the pace for more gains above the 0 level in the near term. If there is a downside correction, the price is likely to find bids near the 5 and 2 levels.
ETH Technical Indicators
Hourly MACD – The MACD for ETH/USD is about to gain traction in the bullish zone.
Hourly RSI – The RSI for ETH/USD is currently well above the 50 level, with a positive bias.
Major Support Level – 2
Major Resistance Level – 5
The post Ethereum (ETH) Price In Uptrend: New Highs Above 0 Likely appeared first on NewsBTC.
Ethereum Price Analysis: ETH/USD Struggling To Hold Gains Above $210
Key Highlights
- ETH price gained traction recently and rallied above 2 against the US Dollar.
- There are two connecting bullish trend lines formed with support at 6 and 4 on the hourly chart of ETH/USD (data feed via Kraken).
- The pair is struggling to stay above the 0 level and it could test the 4 support.
Ethereum price is showing positive signs against the US Dollar and bitcoin. ETH/USD may correct lower in the short term towards 6 or 4.
Ethereum Price Analysis
There was a solid support base formed near 8 in ETH price against the US Dollar. The ETH/USD pair started an upward move and traded above the 5, 2 and 6 levels. The upside move was strong as there was a close above the 5 level and the 100 hourly simple moving average. The price traded as high as 8 and later started a sharp downside correction.
It moved below the 50% Fib retracement level of the recent wave from the 8 low to 8 high. The recent decline was sharp, but the price is now approaching the 4-206 support area. There are also two connecting bullish trend lines formed with support at 6 and 4 on the hourly chart of ETH/USD. The second trend line is close to the 61.8% Fib retracement level of the recent wave from the 8 low to 8 high. Therefore, if the price continues to decline, it could find a solid support near the 4-206 zone. Below 4, the price may test the 0 handle.

Looking at the chart, ETH price clearly struggled to stay above 0, but it is still well supported above 4. On the upside, an initial resistance is at 2, above which the price could trade past 5. The main hurdle for the current rally is near the 1 level.
Hourly MACD – The MACD is moving back in the bearish zone.
Hourly RSI – The RSI is currently well above the 50 level.
Major Support Level – 4
Major Resistance Level – 2
The post Ethereum Price Analysis: ETH/USD Struggling To Hold Gains Above 0 appeared first on NewsBTC.