 Over the past weekend, 211.51 dormant bitcoins valued at .79 million were reactivated after over a decade of inactivity. More than half of these funds originated from bitcoin wallets that had been inactive since 2012. Vintage Bitcoin Wallets Unleash 211.51 Bitcoin Since June 8, 2024, a series of four transactions brought 211.51 dormant bitcoins back […]
Bitcoin News
Sleeping Bitcoins Worth $13.87M Move After 11 Years, Transfer Exposes 2013 Whale
 According to data from June 3, an entity with eight wallets created in 2013 moved 200 BTC valued at .87 million after the funds remained untouched for over 11 years. If sold today, the value of these bitcoins has increased by 197,785% since their acquisition. Spending 200 Bitcoin Unveils Previous Transactions From 2013 On Monday, […]
Bitcoin News
Silver Squeeze: Precious Metal Soars 11.8% in 5 Days, Reaching Its Highest Price Since 2013
 This week, the price of one ounce of silver has seen a significant rise. Over the past five days, silver has increased by more than 11% against the U.S. dollar, surpassing gold’s 2.3% five-day gain. Silver reached per troy ounce for the first time since February 2013. Silver Hits per Ounce, Outperforms Gold […]
Bitcoin News
Bitcoin Whale From 2013 Resurfaces, Moves Over 1,000 BTC Worth $61 Million
 On May 12, as bitcoin hovered slightly above the ,000 mark, two dormant bitcoin wallets, inactive for over ten years and eight months, executed transactions totaling 1,000 bitcoins valued at approximately .1 million. It appears that both wallets, created on the same day, were owned by the same individual. Dormant for a Decade: Bitcoin Wallets […]
Bitcoin News
Echoes of 2013: Bitcoin Mining Concentration Reaches Decade-High Levels

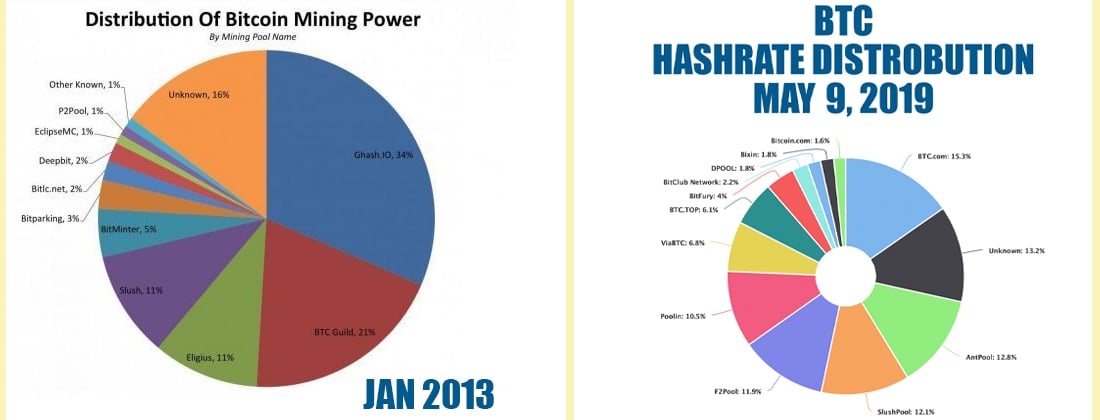
In the past 72 hours, Antpool has dominated 26.48% of Bitcoin’s overall hashrate, closely followed by Foundry USA at 24.95%. Together, these two mining pools wield 51.43% of the prevailing 502 exahash per second (EH/s) total hashrate. This level of concentration in bitcoin mining pools has been unprecedented since 2013, reminiscent of the era when Ghash and Btc Guild were the leading forces in hashrate dominance.
Bitcoin Mining Power Shift: A Return to Dominance by Few Players
Years back, the focus among bitcoin advocates was heavily on the centralization of bitcoin (BTC) mining pools, a topic that sparked considerable debate. Nowadays, though some voices still raise concerns over miner centralization, these issues have largely faded into background noise.
For example, in the last three days, Antpool and Viabtc collectively generated 51.43% of Bitcoin’s entire hashrate, reigniting some discussions about this concentration. In 2023, the concentration of miners mirrors the situation in 2013, when mining pools like Ghash and Btc Guild held a commanding 55% share of the network’s total hashrate.
A notable incident in March 2013 involved an accidental fork, leading to a majority hashrate being used to revert the Bitcoin software to a previous version. Btc Guild, controlling 20-30% of the hashrate, collaborated with developers to roll back the software, sacrificing their proof-of-work since the blockchain split.

This action sparked significant discussion in the community. Arvind Narayanan and Ethereum co-founder Vitalik Buterin wrote about the event, with Buterin highlighting that the “incident opens up serious questions about the nature of the Bitcoin protocol and puts into the spotlight some uncomfortable facts about Bitcoin’s notion of ‘decentralization.’”
Today’s miner centralization echoes that of 2013, sans the chain-splitting episode. Current dominating mining pools nearly replicate the hashrate control seen in Btc Guild and Ghash. This wasn’t the case in 2016 when the top two pools (Antpool and F2pool) only had 32.25% of the hashrate.
Similarly, in 2017, 2018, and 2019, this level of centralization was not observed. However, in 2020, 2021, and 2022, bitcoin mining pools began to centralize again. In June 2022, Foundry USA and Antpool had a combined 38.47% of the total hashrate.
Transaction Filtering Becomes an Issue
Over the past three days, Antpool and Foundry collectively dominate 51.43% of the hashrate among more than 40 pools. Fascinatingly, an altcoin featured on several centralized exchanges might see its deposits halted or face delisting due to concerns that the blockchain may experience a significant reorganization.
Concerns have shifted from potential 51% attacks to censorship within the hashrate and consensus discussions among bitcoiners. For instance, the U.S. Treasury’s Office of Foreign Assets Control (OFAC) has been blacklisting crypto addresses, and miners have the discretion to select which transactions to process.
In May 2021, the North American mining company Marathon produced its first OFAC-compliant block but later abandoned this practice after Taproot’s introduction. Recently, it was discovered that F2pool was filtering transactions linked to OFAC-sanctioned addresses but ceased this after community pushback.
F2pool remains the fourth largest mining pool currently. Moreover, Ocean Pool, supported by Jack Dorsey and led by Bitcoin Core developer Luke Dashjr, faced criticism for censoring transactions related to coinjoin privacy methods and Ordinal inscriptions. Despite a slight dip in hashrate following the backlash, Ocean’s hash power has stayed over 450 petahash per second (PH/s).
Essentially, the evolving landscape of bitcoin mining, marked by fluctuating centralization and emerging concerns over transaction censorship, reflects a dynamic ecosystem and one that should be monitored with vigilance at all times. While the community grapples with challenges to Bitcoin’s decentralization ethos, decentralization advocates must ensure the ongoing debate continues regarding the network’s integrity and the future of bitcoin mining.
How do you view the 2023 mining centralization reflecting the patterns observed back in 2013? Share your perspectives and insights on this topic in the comments section below.
Bitcoin Whale Transfers $13 Million Worth of Dormant Coins Dating Back to 2012 and 2013

Following the transfer of million worth of bitcoins on April 19, after more than nine years of dormancy, another whale has made its move. The whale, who acquired 1,129 bitcoins in 2012 and 2013, has transferred 464 bitcoins worth million for the first time in nine years.
464 Bitcoin Move From an Old 2012-2013 Stash
The price of bitcoin has fallen below the K zone and is struggling to hold above the K region. On Wednesday, a mysterious bitcoin whale transferred 2,071.5 bitcoins worth million at the time of the transaction. This large stash of coins is associated with the Mt Gox saga and a strange bitcoin address (1McUC) that was linked to two significantly large BTC transfers last year.
At 8:19 a.m. Eastern Time on April 21, the Twitter account @lookonchain tweeted about a new whale that sent old bitcoins dating back to 2012 and 2013. “The whale received [1,129 bitcoin] in October 2012 and May 2013, when prices were and 5,” the social media account said. In response to the tweet, one individual speculated that it was “[probably an] OG Silk Road vendor just released.”
Following the transfer of 278.89 BTC by the aforementioned address and the subsequent tweet by the social media account, the address “12At4” sent another 184.23 BTC. So far, the address that once held 1,129 bitcoin has sent a total of 464 BTC worth million at current bitcoin exchange rates. Bitcoin blockchain parsers have been detecting old whales moving dormant coins for years, but statistics from Btcparser.com show that older bitcoins born in 2009, 2010, and 2011 are becoming rare spends.
According to Btcparser.com and further research, a significant number of older Bitcoin transactions have come from 2016 and 2017 in the past few months. The last known transactions from 2009 occurred just over a year ago on April 7 and 8, 2022, when around five Bitcoin block rewards mined in 2009 were spent in a series of transfers. Prior to that, the last time a 2009 block reward was spent was on March 20, 2020, which was nine days after the infamous “Black Thursday” event.
At the time of writing, the “12At4” bitcoin address still holds 665.65 BTC and the owner’s corresponding bitcoin cash (BCH) address still holds approximately 1,128.77 BCH.
What do you think these recent moves by old bitcoin whales mean for the future of the cryptocurrency market? Share your thoughts and opinions in the comments section below.
Dormant Bitcoin Wallet Linked to Mt Gox Saga Moves $60 Million for the First Time Since 2013

According to onchain data, a bitcoin whale address transferred 2,071.5 bitcoin, worth approximately million, after remaining dormant since December 19, 2013. Interestingly, this bitcoin address is linked to two wallets that sent 10,000 BTC last summer for the first time in nine years and are associated with the now-defunct exchange Mt Gox.
2,071 Bitcoin Spent on Wednesday Linked to the ‘1McUC’ Mt Gox-Associated Address
On April 19, 2023, at 4:45 p.m. (UTC), a previously inactive wallet since 2013 moved 2,071.5 BTC. The stash was valued at around .36 million when it first arrived at the address “1JdTW” and had grown to million by the time of transfer on Wednesday. Several BTC parsers, including Btcparser.com caught the movement. Furthermore, Bitcoin.com News discussed it with blockchain researcher Taisia, the admin of the Telegram channel “GFISchannel.”
Taisia identified that the funds were connected to the “1McUC” address that Bitcoin.com News reported on in August 2022. The “1McU” address is related to the now-defunct crypto exchange Mt Gox and may be connected to the exchange hack that took place on June 19, 2011. According to Taisia, the most intriguing aspect of the 2,071.5 BTC movement on Wednesday is its origin.
Taisia stated that examining the original chain of movements revealed two wallet groups previously identified leading to the same “1McU” address mentioned in two articles last year. “In my opinion and those of several blockchain analysts, this wallet belonged to Jed McCaleb, Mt Gox’s original owner and Ripple’s creator,” added the analyst.
Many people noticed the 2,071.5 BTC move, like Taisia; OXT researcher Ergo BTC also linked the transaction to the “1McUC” address. “First activity in this wallet sequence since last summer. 4K [bitcoin] left,” Ergo wrote. “[By the way,] this was a Kraken deposit,” Ergo added. Using our heuristics and onchain clustering tools, Bitcoin.com News can confirm that the funds are associated with the “1McUC” address and Mt Gox saga.
What do you think about the significance of this recent movement of dormant bitcoin linked to Mt Gox? Share your thoughts in the comments section below.
Crypto Economy Swelled 80,466% Since 2013, Despite $1.5 Trillion Loss in 2022 Downturn

Nine years and nine months ago, on May 9, 2013, coinmarketcap.com recorded 14 cryptocurrency assets, and bitcoin’s overall valuation was .24 billion, with 11.13 million bitcoins in circulation at the time. Today, the same website indicates that there are 22,709 crypto assets. Additionally, the market capitalization of the crypto economy has grown significantly, increasing by 80,466% since 2013.
The Evolution of the Crypto Economy: From 14 Coins to 22,709 Coins
Although over .5 trillion has been lost from the crypto economy since its peak in November 2021, its market capitalization has still increased by more than 80,466% since 2013. A snapshot of coinmarketcap.com (CMC) hosted on archive.org shows that, in 2013, there were 14 coins listed on the website. These included bitcoin, litecoin, peercoin, namecoin, feathercoin, terracoin, devcoin, freicoin, novacoin, chncoin, bbqcoin, mincoin, bitbar, and ixcoin. Together, the value of these crypto assets on May 9, 2013, was just over .32 billion.
Of course, many of these coins have been forgotten and a great number of today’s top crypto assets did not exist back then like ethereum, bnb coin, solana, cardano, tether, usd coin, and avalanche. Stablecoins did not exist at that time and today, they represent 7 billion in value out of the current .06 trillion crypto economy. On May 9, 2013, BTC was trading for a whole lot less than it is today as it was exchanging hands for 1.87 per coin. There were only 11.13 million BTC in circulation in comparison to today’s 19.30 million BTC.
In 2013, BTC’s overall valuation was .24 billion, and litecoin’s (LTC) market capitalization was the second-largest. At the time, LTC’s market valuation was around .05 million, according to the CMC snapshot. Today, LTC’s market cap is much larger, at .79 billion. Peercoin’s (PPC) market capitalization was .23 million, and despite being an old-forgotten coin, PPC’s market valuation is around .15 million today. Other coins, like terracoin (TRC), were not as fortunate. TRC’s market cap in May 2013 was .14 million, and today it has fallen to 0,296. Additionally, some coins are so forgotten that they are no longer listed on coin market cap aggregation sites like CMC.
In 2013, there were only a small handful of crypto exchanges, and some of them were sketchy, to say the least. Digital currency wallets were also few and far between, and overall, the crypto economy’s infrastructure nine years ago was a shell of what it is today. 2022 was a difficult year in the crypto sector, and a great number of businesses collapsed from the downturn. Despite the collapses and the hundreds of billions that evaporated from the market, it is a significantly larger forest compared to the small patch of trees it once was in 2013. Besides the internet itself, not many sectors have seen 80,466% growth in less than a decade.
What do you think the future holds for the crypto economy, and how do you see it evolving in the coming years? Share your thoughts in the comments below.
XRP At Risk Of Falling Out Of Crypto Top Five For First Time Since 2013
XRP has had an extremely difficult run since 2017 and things have only turned worse. But somehow despite the poor performance compared to its peers, it has managed to hold onto a top five rank by market cap dating back as far as 2013.
However, the legal blow dealt by the United States Securities and Exchange Commission and the subsequent crypto exchange delistings, the altcoin is now at dangerous risk of falling out of the top five for the first time since back then. Here’s which cryptocurrency could take its spot, and a look at how far the top five has changed since 2013.
The Crypto Market Top Five: 2013 Versus 2021
The cryptocurrency market is constantly evolving, and new projects regularly appear that temporarily dominate the space, only to fall into obscurity later on. The best place for investors to look beyond Bitcoin itself, is the top five or ten cryptocurrencies by market cap.
The higher up the list you go, and the longer the asset has held the position, the more likely the coin has staying power and will continue to do so.
Related Reading | Analyst Who Called Coinbase XRP Delisting Says SEC Is “Investigating” Other Altcoins
In a very risky space, these coins are among the least risky. But scanning through snapshots taken of the top five throughout the history of crypto, even the cream of the crop changes often.

A historical snapshot of crypto in 2013 | Source: CoinMarketCap.com
A handful of coins however have mostly maintained their notch in upper tiers of crypto market share, such as Litecoin, Ethereum, XRP, and of course, Bitcoin.
XRP typically held a number three, but sometimes two or four slot depending on the tides at the time, and for the first time since 2013 is at risk of being booted – possibly for good.
XRP Could Fall Out Of Favor As Investors Continue To Flee
XRP has long battled Ethereum for the number two spot, and as the crypto market grew and so did the need for stablecoins, Tether encroached on the top three.
Related Reading | Here’s Why Despite SEC Charges, XRP Will Soar Again Someday
A newcomer, Polkadot, has now unseated XRP’s fourth rank due to the ripple-effect of the lawsuit against the token’s parent company. The SEC alleges that Ripple sold unregistered securities and XRP are the securities in reference.

Ripple's market cap is barely holding higher than Cardano | Source: CRYPTOCAP-XRP on TradingView.com
The asset saw a mass delisting in the United States, and now even the fifth place rank of XRP is on the ropes against Cardano (ADA).
Ripple has billion of market cap remaining, while Cardano is creeping up right behind with billion. How far could the cryptocurrency fall from grace?
Featured image from Pixabay, Charts from TradingView.com and CoinMarketCap.com
Bitcoin April Monthly Close Was Crypto Asset’s Best Performance Since 2013
Today is a new month, and that means that last night’s daily close also market the April candle close on Bitcoin monthly price charts.
Last night’s close marked the first-ever cryptocurrency’s best April performance since 2013, even easily besting the April 2019 rally that took Bitcoin to over ,000. Is this a sign that the next peak will be even higher?
Bitcoin April Monthly Close Was Most Bullish Since 2013
Bitcoin price exploded from an April low of ,100 to as high as ,500 at the peak.
The powerful move from bulls was the best positive performance in the emerging asset since 2013 when Bitcoin first broke above 0.
Now, the asset is dealing with prices of nearly 100 times that, yet still breaking records for how strong the rally was.
#Bitcoin's performance in April was the best since 2013.
As shown by the violin plot, $BTC also has a relatively high average return during May (the 3rd largest after April & November).
What do you think is in store for May 2020?
Bullish or Bearish? pic.twitter.com/623OrY2Ak0
— Jamie Holmes (@Holmes1991Jamie) May 1, 2020
According to the chart below, April has historically been a strong performing month for Bitcoin and usually closes green. Only two April candles in the asset’s history have ever closed red.
Related Reading | Sell Bitcoin in May and Go Away? Ominous June Event Could Cause Crash
Also depicted on the chart, during the following month in May also has been historically bullish, suggesting that more upside is ahead.
However, there are a number of factors that could make any reversals short-lived.
These Factors Stand in the Way of a New Crypto Bull Run
The April monthly candle closed with an over 35% rise from the bottom of the candle shadow, to the body close. The price closed above the previous red candle, forming a bullish engulfing candle.
These candlestick formations often signal a short-term reversal, but top market experts warn that any reversals are often short-lived and result in a further downtrend.
Related Reading | Top Technical Analyst Claims Latest Bitcoin Engulfing Candle Isn’t Bullish
Bitcoin has to face many other challenges as well. While the halving is seen as a bullish event, it could cause miners to further capitulate as the cost of production grows.
There’s also Mercury in retrograde coming this June, which could cause prices to tank starting in the next month.
Finally, there’s a saying across financial markets, to sell in May and go away. This would have worked decently in Bitcoin last May, as the asset topped out the next month and fell into a downtrend yet again.
The thought is that markets are cyclical and even seasonal, and such recurrence has led to the belief that assets perform the worst during the summer months, then pick up again around October for what is called the Halloween effect.
Of course, Bitcoin‘s halving and the expected impact on supply and demand could prove to be far too bullish for bears to keep the price of the cryptocurrency down any further, as is evident by the amount of liquidates short positions this week.
Featured image from Pixabay
NewsBTC