 The People’s Bank of China (PBOC) paused its gold acquisitions in May, ending 18 months of continuous buying as spot gold prices hit record highs. Despite this interruption, the value of China’s gold reserves continued to rise. China Pauses Gold Buying in May China’s central bank, the People’s Bank of China (PBOC), paused its gold […]
Bitcoin News
Bitcoin’s Significant Adjustment: Mining Difficulty Hits 18-Month Low – What’s Next For Miners?
The Bitcoin mining difficulty has experienced a significant decrease, the largest drop observed in the last 18 months. This change is directly tied to fluctuations in the network’s hash rate, which has dipped below 600 EH/s following the recent halving event.
The adjustment, which marks a 5.7% fall in mining difficulty, brings the level down to 83.1 trillion, according to data from Bitbo.
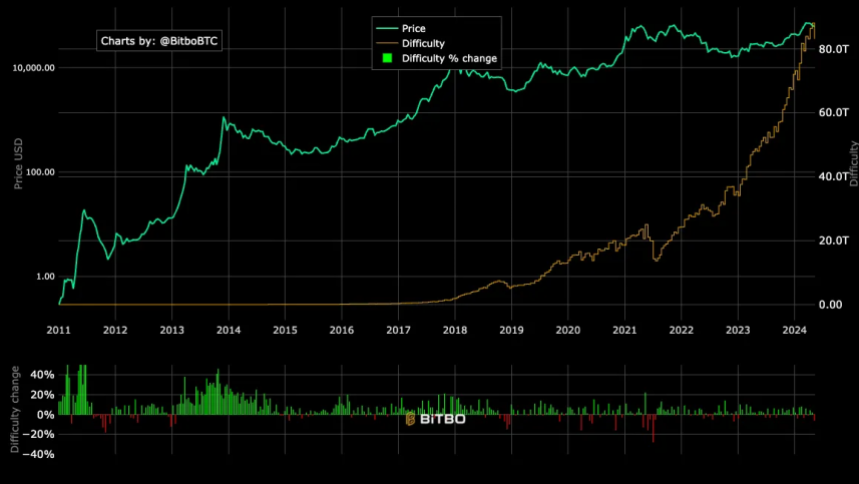
This most substantial adjustment since December 2022 reflects broader shifts within the Bitcoin mining landscape. At that time, Bitcoin’s price hovered around ,000, contrasting sharply with current levels.
Notably, the mining difficulty, a metric that determines how challenging it is to find a new block, adjusts approximately every two weeks, or every 2016 blocks. This system ensures that block discovery remains consistent at around every 10 minutes, irrespective of the number of miners.
Impact On Miners And Market Dynamics
The recent decline in mining difficulty came after a 10% drop in the network’s hash rate from a seven-day moving average of 639.58 EH/s to 581.74 EH/s.
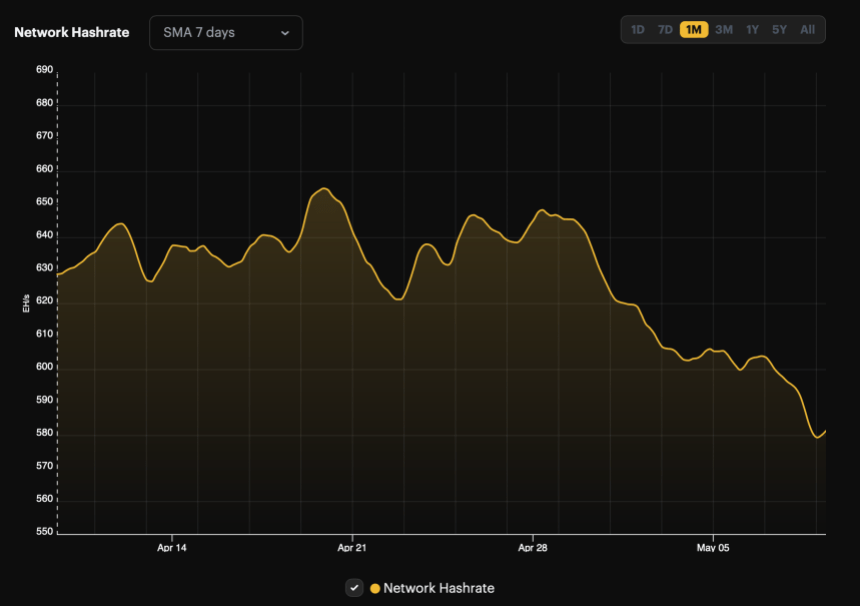
This decrease in hash rate led to longer average block times of about 10 minutes and 36 seconds, up from the standard 10 minutes, before the difficulty adjusted downward at block height 842,688.
The reduced hash rate also contributed to a new low in the hash price, which fell to roughly .049 per TH/s per day.
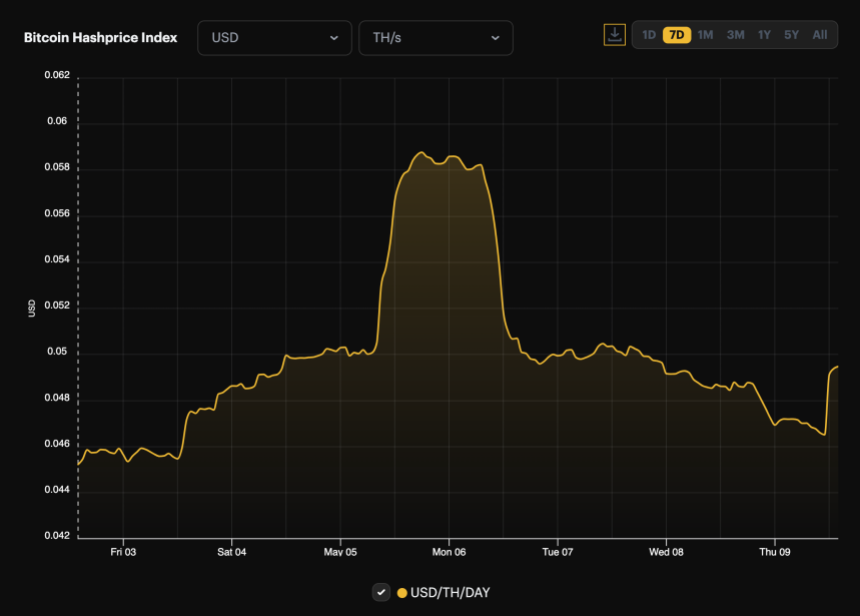
This decline impacts miners’ profitability, as the hash price, a term introduced by Bitcoin mining firm Luxor, represents the earnings a miner can expect per unit of hashing power per day.
However, today’s negative difficulty adjustment may provide some relief for miners, making it easier to mine blocks than in the previous two weeks.
Bitcoin Market Reactions And Investment Trends
The adjustments in mining difficulty and hash rate come when Bitcoin’s price also shows signs of volatility. After reaching a peak above ,000 in March, the price has fallen by 16% and is now trading around ,376.
This decline mirrors the broader trend in the mining difficulty, suggesting a possible correlation between these metrics.
Furthermore, the market has observed subdued activity in the spot Bitcoin exchange-traded funds (ETFs). Data from Soso Value indicates minimal net inflows or outflows, with Bitwise Bitcoin ETF being the only issuer that experienced inflows yesterday.
On May 8, the total net inflow of Bitcoin spot ETF was .5409 million. Grayscale ETF GBTC has no inflows and outflows. Bitwise ETF BITB saw a single-day net inflow of .5409 million. The total net asset value of Bitcoin spot ETFs is .504 billion. https://t.co/OkjFkXsACa
— Wu Blockchain (@WuBlockchain) May 9, 2024
This trend could signify a cooling interest in Bitcoin investments or a shift in investor strategy following the recent price and mining adjustments.
Feature image from Unsplash, Chart from TradingView
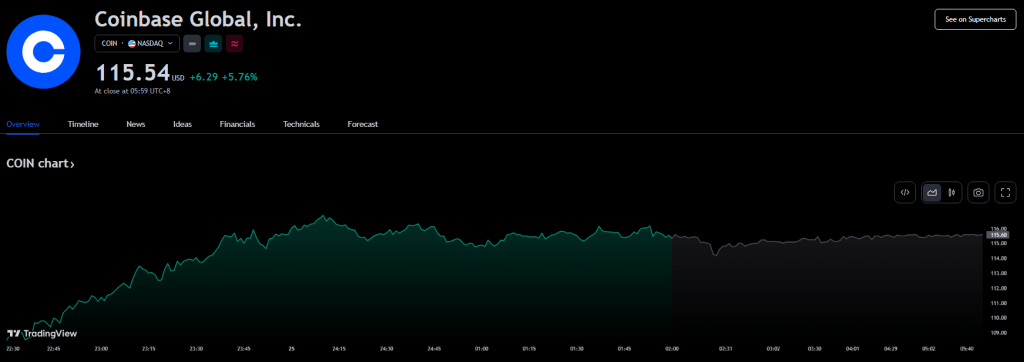
Coinbase COIN Hits 18-Month High To Rally Near $117 – Is $150 On The Cards?
The price of Bitcoin hit a 2023 high, and Coinbase Global (COIN) shares went through the roof. It looked like the crypto exchange had benefited from Binance’s recent legal problems.
People have noticed that COIN’s price has been doing well in line with the overall good trend in the crypto space led by Bitcoin.
This week, the price of Coinbase stock has been going up quickly because its competitor, Binance, is having some problems with the government.
COIN has been soaring for five days in a row and hit a four-month high of 4.4 as a result. But if you look at the chart for the daily time frame, you can see that this rebound is part of a rising channel. This means that the asset is ready for another surge.
The Nasdaq-listed Coinbase stock reached an 18-month high on Friday. The prices of Ethereum and Bitcoin are also rising.
The price of a COIN share was 5.75 at the time of this writing, up almost 7% in the last 24 hours. It has almost reached 7 per share so far today. Just one month ago, COIN was worth per share, but now it’s worth over 40% more.
According to data provided by on-chain research company CryptoQuant, the US exchange’s bitcoin reserves have recently shot up, while Binance’s have fallen.
Over the past several months, Coinbase has become even more of a major player in the digital currencies sector, even as other companies in the same field have gone out of business.
The exchange’s solid track record has been a key part of its success, especially since it promotes a strong compliance-first approach after rivals like Binance have had major run-ins with the law.
This week, Binance admitted to being guilty of money theft in federal court. The company decided to pay fines of .3 billion, and Changpeng “CZ” Zhao, the founder and CEO, also admitted guilt and said he would resign. The news somehow benefited its rival, Coinbase, as seen from the decent numbers it has so far tallied.
As of November, the price of Coinbase stock has made an impressive rebound, coming back strongly from a psychological support level of . In the last few days, this upward trend has pushed the price of the asset to a remarkable 5, which is a 62% climb.
Based in San Francisco, the Nasdaq has listed Coinbase as a public company since 2021. The last time COIN was worth this much was in May 2022, just before the bubble burst for Terra and most of the digital asset economy crumbled along with it.
Analysts said that the Binance legal ruling could also be good for Coinbase because it could make it easier for US regulators to grant permission for a Bitcoin exchange-traded fund (ETF).
A Bitcoin exchange-traded fund (ETF) is a type of investment trust fund that lets buyers benefit from changes in the price of Bitcoin without actually holding the cryptocurrency itself.
It works like a regular stock on a stock market, helping investors buy and sell shares that give them ownership in the Bitcoin ETF. Bitcoin is what the ETF is based on, and its value is linked to the success of the crypto asset.
Meanwhile, as COIN surges to an 18-month high, nearing the 7 mark, speculation arises about the possibility of it reaching 0. The impressive rally showcases the platform’s resilience and market confidence.
Investors are keenly observing whether this upward momentum will persist, potentially propelling Coinbase to new heights. The crypto community awaits eagerly, anticipating whether COIN will continue its ascent towards the speculated 0 milestone.
(This site’s content should not be construed as investment advice. Investing involves risk. When you invest, your capital is subject to risk).
Featured image from Freepik
Bitcoin Hits 18-Month High as Market ‘Greed’ Takes Hold, Igniting Short Squeeze Frenzy

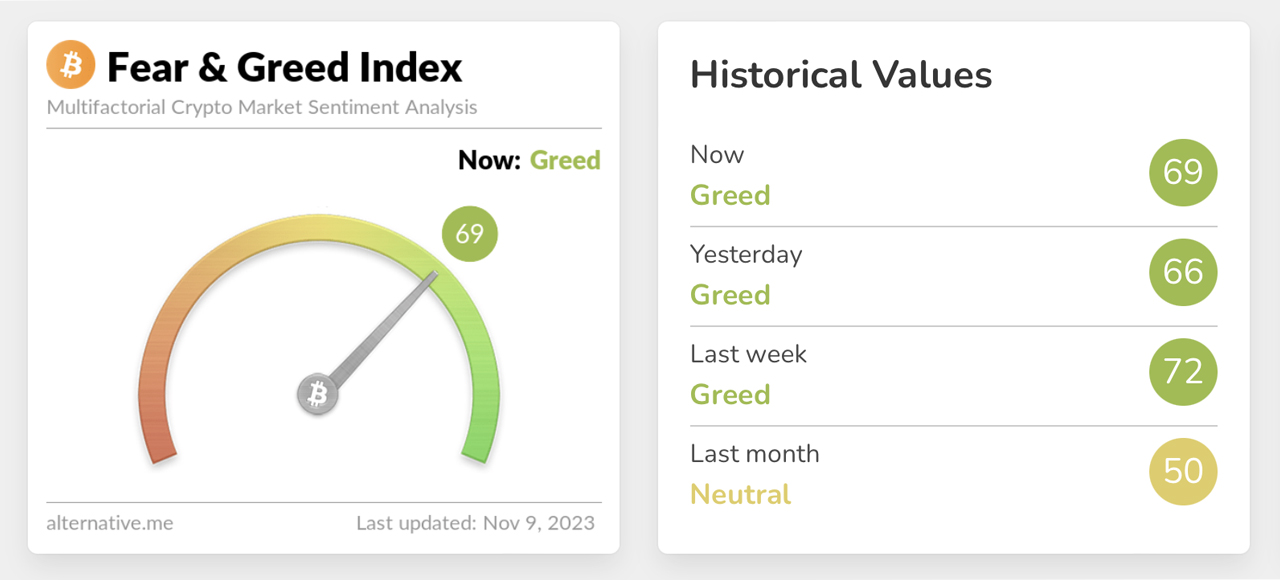
The Crypto Fear and Greed Index (CFGI) currently reveals a mood of “greed” within the cryptocurrency market, scoring a 69 out of 100. As of November 9, 2023, at 5:20 a.m. Eastern Time, the price of bitcoin peaked above K — a peak not observed since the first week of May 2022, stretching over a span of more than 550 days.
Bitcoin Rises Above K Zone; Shorts Crushed With Million Loss
The valuation of bitcoin (BTC) has escalated by 4.4% against the U.S. dollar this Thursday, marking a strong 34% appreciation over the previous month. Bitcoin is now trading just above the K threshold, a level last witnessed on May 6, 2022.
This indicates that for an extensive period of over a year, or just beyond 550 days, bitcoin’s price lingered below the K mark. It has been 238 days since BTC’s value dipped below ,000, which occurred on March 16, 2023, and 299 days since it fell under the ,000 mark on January 14, 2023.
Further, bitcoin has not been priced at ,000 or lower since July 27, 2020, which dates back approximately 1,200 days. From 2020 to 2023, bitcoin’s price remained below ,000 for a duration of 202 days, below ,000 for 471 days, and under ,000 for 637 days in total.
This week, bitcoin’s price has maintained a solid position above K, signaling a bullish outlook as suggested by the latest technical oscillators and moving averages. The 10-day short-term exponential moving average (EMA) and simple moving average (SMA) are flashing bullish signals, indicative of a strong price trajectory in recent times.
Despite these positive indications, the Crypto Fear and Greed Index (CFGI) continues to suggest a tilt towards “greed.” The index mirrored this sentiment last week and the day prior as well, while it reflected “neutral” feelings last month as reported by alternative.me.
According to the CFGI, “extreme fear” may hint at widespread concern among traders and investors, potentially marking a prime entry juncture. Conversely, “extreme greed” suggests that the crypto market might be ripe for a price correction.
Nonetheless, recent statistics highlight that those who wagered on a crypto downturn by positioning short bets have incurred losses amounting to 2 million in the past day alone, with bitcoin’s swift ascent towards K causing the liquidation of over 59% of these shorts, equating to about million.
What do you think about the Crypto Fear and Greed Index? Share your thoughts and opinions about this subject in the comments section below.
Biggest Movers: LINK Nears 18-Month High on Saturday, as Bulls Extend Momentum

Chainlink moved towards an 18-month high to start the weekend, following a second day of bullish momentum. The cryptocurrency rose by as much as 7% in today’s session, despite the global market cap mostly consolidating on Saturday. Cardano also rallied, nearing a multi-month high of its own.
Chainlink (LINK)
Chainlink (LINK) made considerable gains to start the weekend, as the token rose by as much as 7% in the day.
LINK/USD peaked at a high of .59 earlier in today’s session, which comes a day after price fell to a low of .80.
Today’s gains pushed price closer to a recent 18-month high of .78, which was hit during the week.
The latest bullish push in LINK comes as the relative strength index (RSI) continued to trend upward, and it now sits at 81.68.
A ceiling is fast approaching at the 83.00 mark, and should bulls fail to break out of this level, there will likely be a reversal in price.
Cardano (ADA)
Cardano (ADA) was another notable mover on Saturday, climbing closer to a recent nine-week high.
Following a low of .284 on Friday, ADA/USD raced to a peak at .2973 earlier in today’s session.
As a result of the surge, cardano edged closer to its highest level since mid-August, when price traded over .30.
From the chart, it appears that the 14-day RSI is now tracking at a reading above 77.00, which could prompt some bears to begin entering the market.
As a result, a handful of bulls have begun to secure gains, leading to ADA now trading marginally below today’s peak.
Register your email here to get weekly price analysis updates sent to your inbox:
Will cardano reach .30 during November? Let us know your thoughts in the comments.
Bitcoin, Ethereum Technical Analysis: BTC Remains Near 18-Month High, ETH Recaptures $1,800 Level
After a brief spell above ,000 late on Wednesday, bitcoin retreated below this level during today’s session. Despite the decline, the cryptocurrency continues to trade close to an 18-month high on Thursday. Ethereum rose back above the ,800 level.
Bitcoin
Bitcoin once again fell below the ,000 level on Thursday, after a brief stint above this level on Wednesday.
Following a high of ,133.76 late in yesterday’s session, BTC/USD dropped to an intraday low of ,151.88 earlier today.
The move saw bitcoin continue to trade close to its strongest point since May 2022, when price was over ,000.
At the time of writing, bitcoin is now trading at ,990.55, which comes as the relative strength index (RSI) failed to penetrate the 90.00 zone.
Currently, the index is at a reading of 82.99, which remains significantly overbought in the medium term.
Should sentiment begin to truly shift bearish, a floor at ,000 is the likely target for bears in the market.
Ethereum
On the other hand, ethereum (ETH) was mostly higher, leading prices back above the ,800 level.
ETH/USD peaked at ,865.10 earlier in today’s session, following a low at ,781.49 on Wednesday.
As a result of today’s surge, ethereum rose to its highest level since August, when the price hovered below ,880.
The cryptocurrency has now traded in the green for seven straight sessions, adding nearly 20% to its value during this period.
Overall, the 10-day (red) moving average continued to race ahead of its 25-day (blue) counterpart, which is a sign that momentum remains bullish.
At the time of writing, the RSI is at 74.90, which could cause current buyers to soon begin to capture gains.
Register your email here to get weekly price analysis updates sent to your inbox:
Do you expect ethereum to hit ,900 before market sentiment shifts? Leave your thoughts in the comments below.
Bitcoin Could See 10% Jump, As Volatility Drops To 18-Month Low
After its third-largest weekly fall in over a year, the Bitcoin (BTC) price has finally began to rise. BTC’s price has effectively rebounded from the important support level of ,500, despite an impending Federal Reserve rate hike.
Bitcoin Poised For 10% Jump
Various analysts, like The Wolf of All Streets, Michael van de Poppe, and PlanB, are bullish on the bullish trend, with the Bitcoin price currently holding above ,000.
In a tweet on May 4, on-chain data provider Santiment published historical data showing a 20% rally as a result of BTC transactions is negative at the same levels between February 16 and 22. The week’s Bitcoin Ratio of On-Chain Transactions Volume in Profit/Loss statistic is the third largest capitulation in a year.
As technicals improve, several analysts and traders forecast a price increase in the following days.
Michaal van de Poppe predicts that the price of Bitcoin (BTC) will rise from current levels. He stated,
“Bitcoin starts to look way better at this stage. Odds that the event tonight is a ‘Sell the rumour, Buy the News’ event are increasing.”
A prominent crypto trader, The Wolf Of All Streets, predicted a rebound in Bitcoin price as it breaks above the trend line. A big rise could be anticipated if the BTC price stabilizes over ,000.
Bitcoin On-Chain Transactions Volume. Source: Santiment
According to PlanB, the original K S2F model, which was released in March 2019, appears to be tracking the Bitcoin price trend. He also expects Bitcoin to rise in value.
The price of Bitcoin (BTC) has regained over 5% in the previous 24 hours, stabilising near ,000. Whales continue to accumulate at dips, resulting in a huge increase in trading volume. Furthermore, the BTC has avoided a drop below the critical support level. It suggests that a rally could happen in the next several days.
Suggested Reading | Bitcoin Briefly Tops ,000 As More Countries Adopt Crypto
BTC Trades Sideways
BTC has been trading sideways over the past few days, with the price dropping below ,000 on April 26. Although, after reaching the swing highs near ,000, the price has already begun to drop. BTC retreated and lost 45 percent of its value. BTC sellers, on the other hand, are weary as the price trades sideways in a narrow range since April 25.
B
BTC/USD trades sideways. Source: TradingView
A daily close below the session’s low, on the other hand, would disprove the bullish price assumption. In that situation, ,000 would be the lowest point on the downside.
BTC/USD is currently trading at ,874, up 5.63 percent for the day as of publishing time. According to CoinMarketCap, the first cryptocurrency by market capitalization has a 24-hour trading volume of ,528,442,016.
Suggested Reading | Will Bitcoin Shoot Over ,000 — Or Drop To ,000?
Volatility Drops
Bitcoin’s historical volatility is at 18-month lows, according to statistics released by the Buy Bitcoin Worldwide webpage. Its anticipated 60-day average value fell to 2.62%.
Bitcoin (BTC) volatility was last this low in November 2020, when the orange coin broke through ,000 for the first time in this bullish cycle.
Image by Buy Bitcoin Worldwide
On April 27, 2022, thirty-day volatility reached a local low, but it is already showing signs of recovery.
The Bitcoin Volatility Index (BVOL), similar to the stock market’s VIX, shows how much Bitcoin’s price changes on a given day in relation to its previous price.
The most recent increase in Bitcoin (BTC) volatility occurred in July 2021, when the flagship cryptocurrency was twice as volatile over a 30-day period as it is now.
Featured image from Pixabay, chart from TradingView.com
Aion Token Project Estimates 18-Month Runway After Bitcoin and Ether Sales
The Aion Foundation has sold off half of the bitcoin and ether raised in an October 2017 token sale, says its CEO.
CryptScout #BitFeed RSS – Bitcoin and Cryptocurrency News 24/7
US City Mulls 18-Month Moratorium on Bitcoin Mining
A proposed law in the City of Plattsburgh would place a moratorium on new commercial cryptocurrency mining operations for 18 months.
CoinDesk