Bithumb, South Koreas largest cryptocurrency exchange, has posted a net loss of 205.5 billion won 0 million for 2018.n
CryptScout #BitFeed RSS – Bitcoin and Cryptocurrency News 24/7
Ethereum (ETH) Price Signaling Bullish Continuation Above $180
- ETH price corrected lower and found support near the 4 level against the US Dollar.
- The price found a strong buying interest and it is currently moving higher towards 5.
- Yesterday’s highlighted important bullish trend line is active with support at 5 on the hourly chart of ETH/USD (data feed via Kraken).
- The pair is showing positive signs above the 5 level and it could continue to move higher.
Ethereum price is holding key support levels versus the US Dollar and bitcoin. ETH is slowly climbing higher and it is likely to continue towards the 4 and 5 levels.
Ethereum Price Analysis
Recently, there was a fresh downside correction from the 8 swing high in Ethereum price against the US Dollar. The ETH/USD pair declined below the 4 and 0 support levels. The price even broke the 6 level, but it found a strong buying interest near the 4 level. Moreover, the 61.8% Fib retracement level of the last leg from the 4 low to 8 high acted as a support. The price formed a decent support base above the 4 level and it recently moved higher.
It broke the 6 resistance and the 23.6% Fib retracement level of the recent drop from the 8 swing high to 4 low. More importantly, there was a break above a connecting bearish trend line with resistance at 7 on the hourly chart of ETH/USD. It opened the doors for more gains and the price recently tested the 0 level. It seems like the 50% Fib retracement level of the recent drop from the 8 swing high to 4 low is acting as a short term resistance.
If the price corrects lower, it is likely to find a decent buying interest near the 6 or 5 levels. Besides, yesterday’s highlighted important bullish trend line is active with support at 5 on the same chart. Therefore, it seems like Ethereum remains well supported on the downside near the 5 and 4 levels. On the upside, a break above the 0 level could push the price towards the 4 and 5 resistance levels.
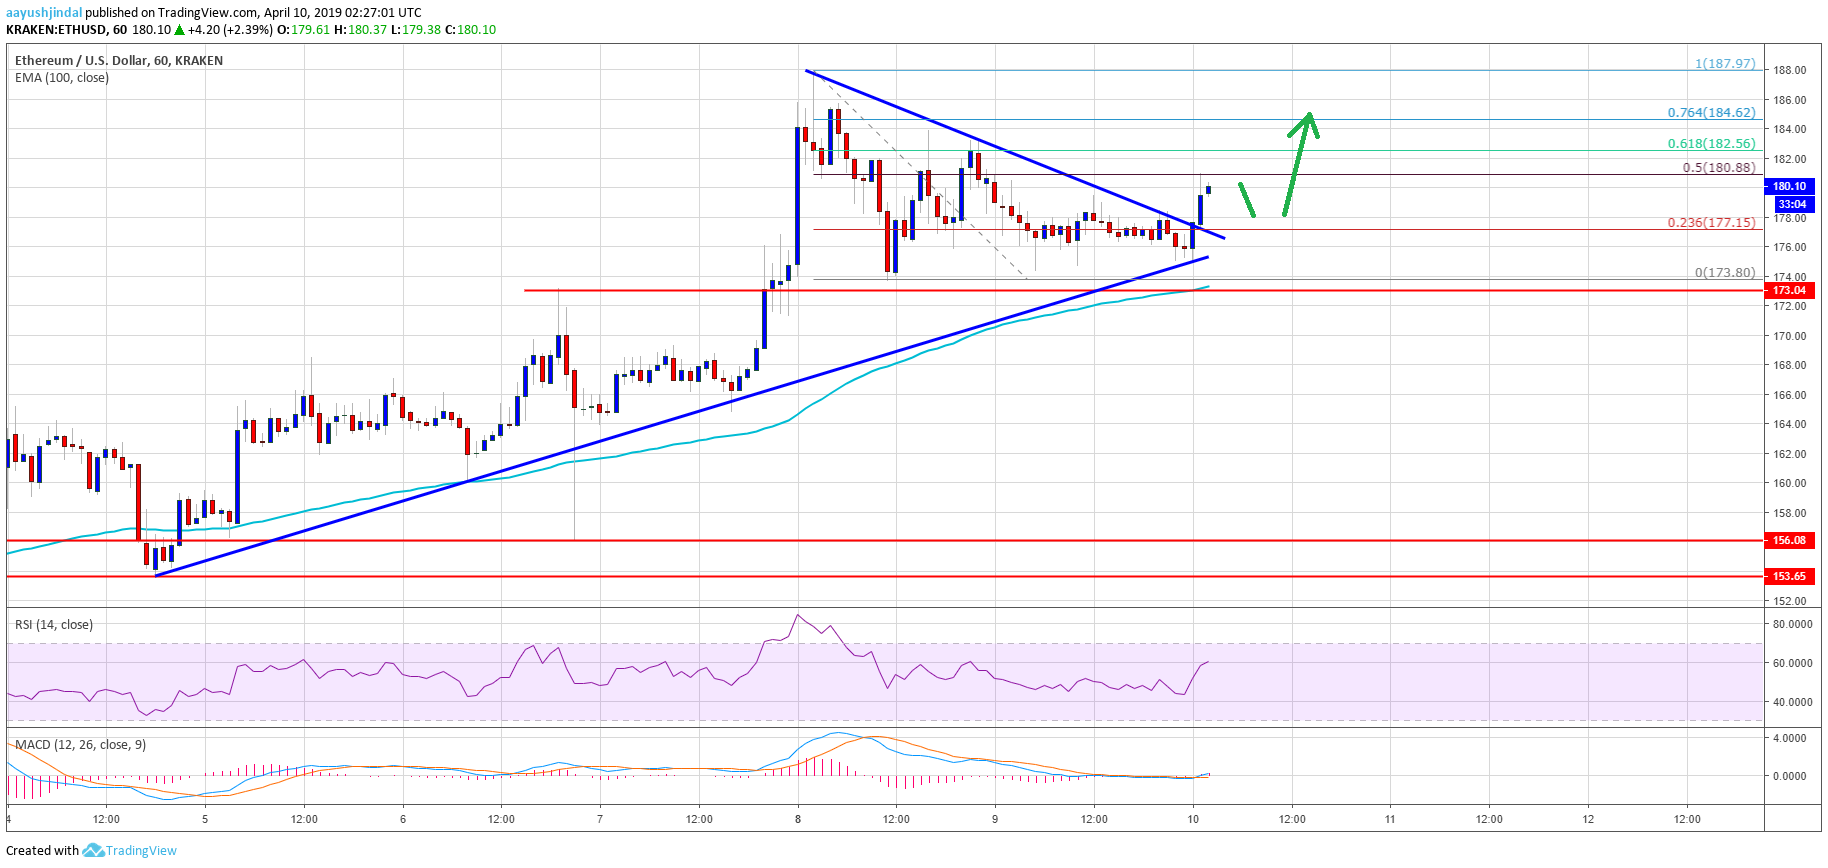
Looking at the chart, Ethereum price is placed nicely in a positive zone above the 4 swing support. Only a close below the 4 level and the 100 hourly simple moving average could start a fresh decline. If not, the price is likely to continue higher towards 5. Above 5, the next stop for buyers could be near 8 or 0.
ETH Technical Indicators
Hourly MACD – The MACD for ETH/USD is slowly gaining momentum in the bullish zone.
Hourly RSI – The RSI for ETH/USD climbed higher above the 50 and 55 levels.
Major Support Level – 5
Major Resistance Level – 5
The post Ethereum (ETH) Price Signaling Bullish Continuation Above 0 appeared first on NewsBTC.
Ethereum Price Weekly Analysis: ETH Could Surge Toward $180
Key Highlights
- ETH price remained in a solid uptrend and it could trade above 0 and 0 against the US Dollar.
- There is a crucial bullish trend line formed with support at 8 on the 4-hours chart of ETH/USD (data feed via Kraken).
- The pair could resume its upward move and it may soon clear the 2 and 0 resistances.
Ethereum price is slowly gaining momentum versus the US Dollar and Bitcoin. ETH/USD may correct lower in the short term, but dips remain supported.
Ethereum Price Analysis
This past week, ETH price followed a solid bullish path above the 0 pivot area against the US Dollar. The ETH/USD pair broke the 2 resistance area and settled above the 100 simple moving average (4-hours). Later, buyers gained bullish momentum and broke the 0 and 4 resistance levels. The price even broke the 0 level and traded towards the 2 level.
A high was formed at 1.57 and later the price started a downside correction. It declined below the 4 support to move into a short term bearish zone. Sellers pushed the price below the 23.6% Fib retracement level of the recent wave from the 8 low to 2 swing high. However, there are many supports on the downside near the 0 and 2 levels. Moreover, there is a crucial bullish trend line formed with support at 8 on the 4-hours chart of ETH/USD. Below the trend line, the 50% Fib retracement level of the recent wave from the 8 low to 2 swing high is at 5. Therefore, downsides near the 0 and 5 levels are likely to find a strong buying interest.
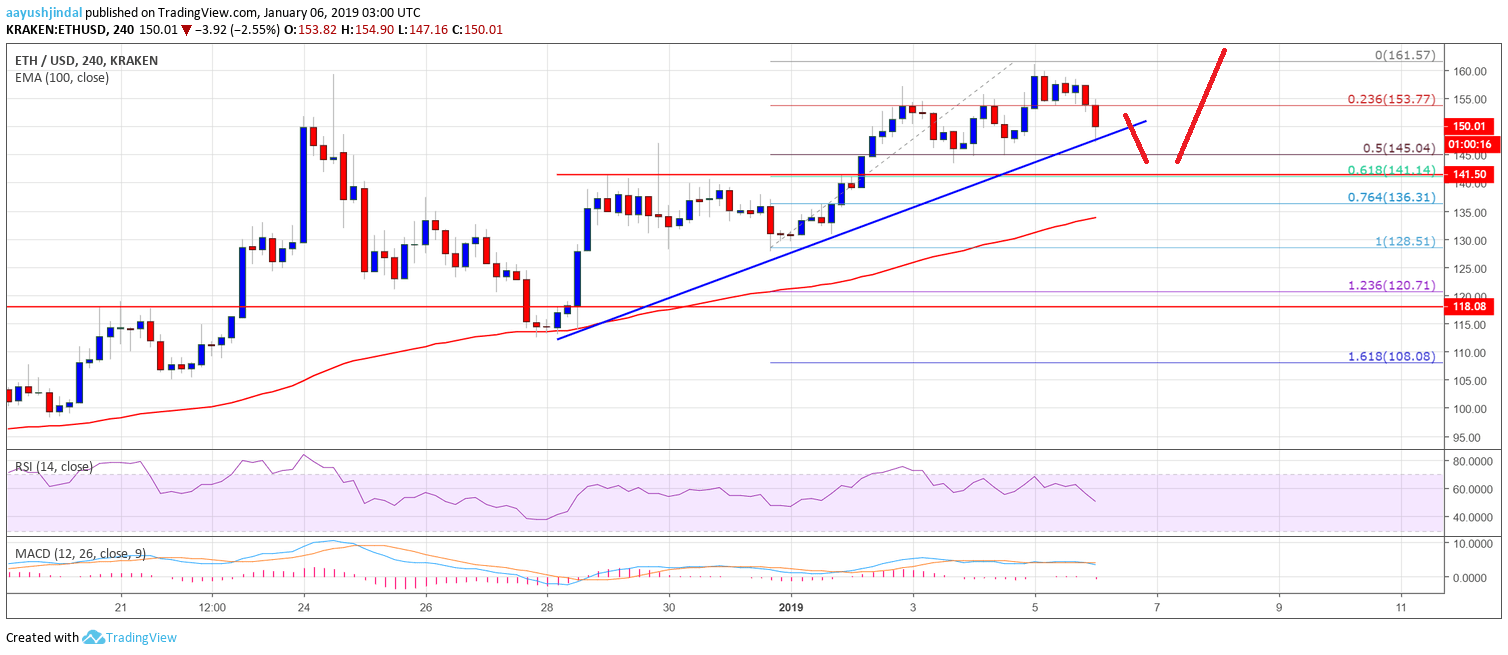
The above chart indicates that ETH price remains in a decent uptrend above the 2 support. On the upside, a break above the 2 swing high may open the doors for 0 and 0.
4-hours MACD – The MACD is slightly placed in the bearish zone.
4-hours RSI – The RSI is moving lower towards the 50 level.
Major Support Level – 2
Major Resistance Level – 2
The post Ethereum Price Weekly Analysis: ETH Could Surge Toward 0 appeared first on NewsBTC.
Bitcoin Cash Price Analysis: BCH/USD Under Pressure Below $180
Key Points
- Bitcoin cash price failed to trade above 5-180 and declined sharply against the US Dollar.
- There are two key bearish trend lines formed with resistance near 5 on the hourly chart of the BCH/USD pair (data feed from Kraken).
- The pair is currently trading near the 5 support and it could tumble towards 0 in the near term.
Bitcoin cash price struggled to hold gains above 0 against the US Dollar. BCH/USD is under pressure and it looks set to clear the 0 and 0 support levels.
Bitcoin Cash Price Analysis
Recently, there were range moves above the 5 support in bitcoin cash price against the US Dollar. The BCH/USD pair jumped higher later and climbed above the 0 resistance. There was a break above the 23.6% Fib retracement level of the last drop from the 7 high to 4 low. However, there was no proper close above the 0 and 0 resistance levels. The price also failed to settle above 0 and the 100 hourly simple moving average.
Moreover, there are two key bearish trend lines formed with resistance near 5 on the hourly chart of the BCH/USD pair. The pair also struggled to settle above the 50% Fib retracement level of the last drop from the 7 high to 4 low. Finally, there was a downside reaction and the price tumbled below the 5 and 0 levels. At the outset, the price is trading near the 5 support, with a bearish angle. It seems like there could be a sharp downside reaction towards 0.
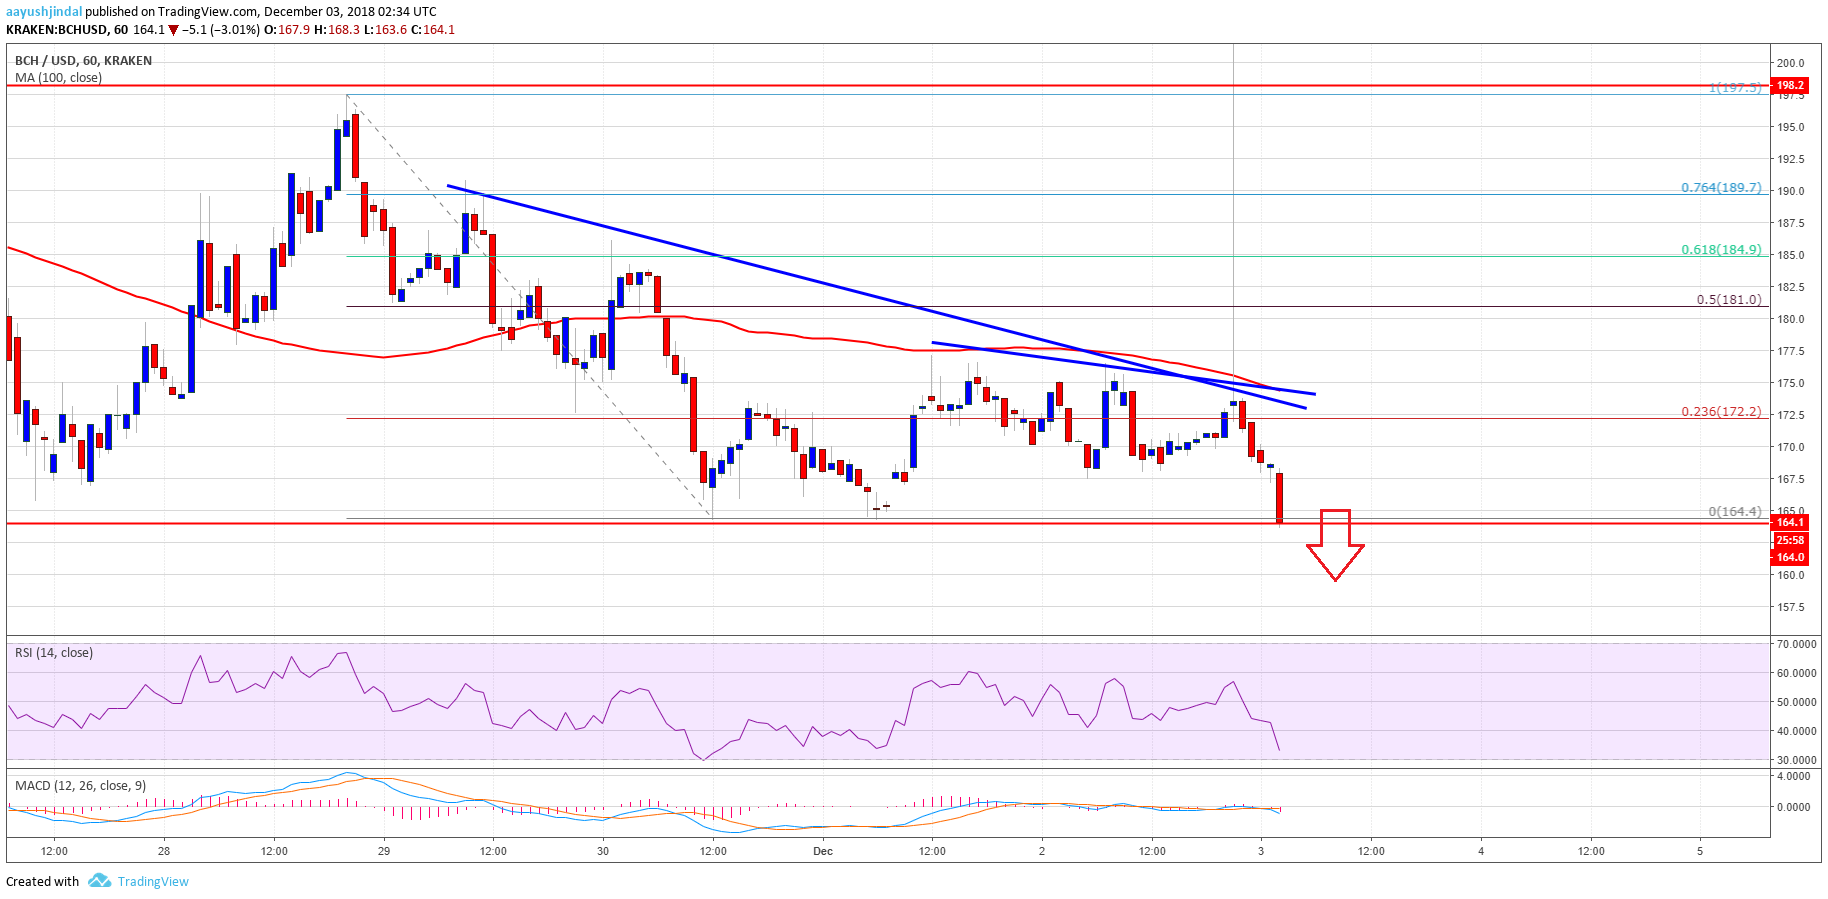
Looking at the chart, BCH price is clearly under pressure below 0 and the 100 hourly SMA. To recover, buyers need to gain strength above 5 and 0 in the near term.
Looking at the technical indicators:
Hourly MACD – The MACD for BCH/USD is gaining strength in the bearish zone.
Hourly RSI (Relative Strength Index) – The RSI for BCH/USD is well below the 50 level.
Major Support Level – 5
Major Resistance Level – 0
The post Bitcoin Cash Price Analysis: BCH/USD Under Pressure Below 0 appeared first on NewsBTC.
Ethereum Price Analysis: ETH/USD Could Decline to $180
Key Highlights
- ETH price is under a lot of pressure after it broke the 0 support against the US Dollar.
- There was a break below a major contracting triangle with support at 0 on the hourly chart of ETH/USD (data feed via Kraken).
- The pair is under a lot of pressure and it could continue to decline towards the 0 level.
Ethereum price declined recently against the US Dollar and bitcoin. ETH/USD may perhaps continue to decline towards the 0 level in the near term.
Ethereum Price Decline
After failing near the 5 level, ETH price started a downside move against the US Dollar. The ETH/USD pair declined ad traded below the 0 and 0 support levels. There was also a close below the 0 level and the 100 hourly simple moving average. Moreover, there was a break below the 50% Fib retracement level of the last wave from the 6 low to 7 high.
More importantly, there was a break below a major contracting triangle with support at 0 on the hourly chart of ETH/USD. The pair declined towards the 0 level and found support near 2. On the downside, the next support is near the 61.8% Fib retracement level of the last wave from the 6 low to 7 high. A downside break below the 2 level could open the doors for more losses. The most important support is near 0, which is close to the 76.4% Fib retracement level of the last wave from the 6 low to 7 high. If the price corrects higher, it could find resistance near the 0 and 5 levels.

Looking at the chart, ETH price in a bearish zone and it could extend declines towards 0, 5 and 0. Below this last, it could even trade back towards the 6 level.
Hourly MACD – The MACD is moving in the bearish zone.
Hourly RSI – The RSI is currently well below the 40 and 30 levels.
Major Support Level – 0
Major Resistance Level – 5
The post Ethereum Price Analysis: ETH/USD Could Decline to 0 appeared first on NewsBTC.
Research Firm Satis Group Predicts Bitcoin at $144,000 in 10 Years, Bitcoin Cash at $180
Research firm Satis Group has released a new report making bold price predictions about the current leading cryptocurrencies on the market. It is attempting to create accurate valuations based on real-world data.
Individual Crypto Asset Valuations
As an emerging, disruptive technology that’s value isn’t yet fully understood or demonstrated, it’s increasingly difficult to give each individual crypto asset a valuation. This creates wild price volatility led by speculators working through natural price discovery.
The report, penned by researchers Sherwin Dowlat and Michael Hodapp, is a deep dive into cryptocurrency market valuations. The duo used a combination of peer-based metrics, quantity theory, discounted cash flow models, and economic forecasting to come up with their valuations.
Satis Group’s research suggests that Bitcoin (BTC), the original cryptocurrency created by Satoshi Nakamoto that started it all, will unsurprisingly continue to reign supreme. They project that it will be priced at ,000 by the year 2023, and could reach nearly 4,000 before the end of the next decade (sorry, McAfee).
The next highest value cryptocurrency is Monero (XMR), which Satis predict could reach over ,000 within five years. By 2028, XMR is estimated to be worth as much as ,000 according to the report. Satis suggest the “largest upside” in the “entire crypto asset market” is in the privacy sector. The firm believes that the network effect, similar to what’s happened with Bitcoin since its inception, would be repeated with the dominant privacy coins.
Zcash (ZEC) and Dash (DASH) are right behind Monero with five-year valuations of roughly ,400 and ,900 respectively. In 10 years, Zcash could be valued over ,000, while Dash would come in just under ,000.
Litecoin (LTC) is predicted to never again reach its all-time high price of 5, with its 10-year outlook performing at just 5.
Ethereum (ETH), the number two cryptocurrency by market cap, has struggled throughout 2018 after reaching an all-time high of ,432. Interestingly, like Litecoin, the report suggest that it won’t ever reach that high a valuation again. Statis does believe that Ethereum will rise from here, peaking in 2019 at 2, then dropping roughly 0 per three, five, and 10 years out.
Other entries from the current cryptocurrency market top 10 will suffer far worse fates than Litecoin and Ethereum. These will not only decline in value and never reach their previous all-time highs, but will see their prices drop significantly lower than their current bear market prices.
Ripple (XRP) for example, will end up valued at .004 in 10 years, according to the data. Stellar (XLM), which shares the same founder as Ripple, Jed McCaleb, will see consistent prices between .01 and .02 over the next 10 years. Cardano (ADA) shares a very similar fate, dropping to .0001 10 years out.
That leaves just EOS (EOS) and Bitcoin’s hard fork, Bitcoin Cash (BCH). EOS oddly drops off to an estimated .05 a year from now, only to reach lower than current prices of .50 and .80 in five and 10 years. Unfortunately for frontman Roger Ver, Bitcoin Cash will fail to see prices over ,000 again, and won’t come close to its previous all-time high of ,330. Satis suggests Bitcoin Cash will decline to as low as 8 in 2023, and only 0 in 2028.
Featured image from Shutterstock.
The post Research Firm Satis Group Predicts Bitcoin at 4,000 in 10 Years, Bitcoin Cash at 0 appeared first on NewsBTC.