 Over the past 19 days, the stablecoin economy has stabilized with negligible growth after reaching the 0 billion threshold at April’s end. Out of the top five, FDUSD is currently the frontrunner in terms of 30-day growth, showing a 15.3% increase in supply. Stablecoin Valuation Holds Steady With Little Growth Following a period of rapid […]
Bitcoin News
NEAR Price Rally: 9% Surge Recaptures Key Level, Records 160% TVL Growth In Q1
Decentralized application (dApp) platform Near Protocol exhibited notable growth in key metrics during the first quarter (Q1) of 2024, driving its native token NEAR to reclaim a crucial key level and paving the way for a potential retest of its all-time high (ATH) from January 2022.
According to a recent report by Messari, NEAR experienced significant increases in market capitalization, revenue, active addresses, and Total Value Locked (TVL), solidifying its position among the top players in the cryptocurrency market.
NEAR Outperforms Bitcoin And Ethereum
In Q1 2024, NEAR’s circulating market cap surged to .2 billion, marking a 94% quarter-on-quarter (QoQ) increase. The fully diluted market cap also witnessed substantial growth, reaching .2 billion, representing a 91% QoQ increase. These numbers propelled NEAR to secure a spot among the top 20 cryptocurrencies by market capitalization.
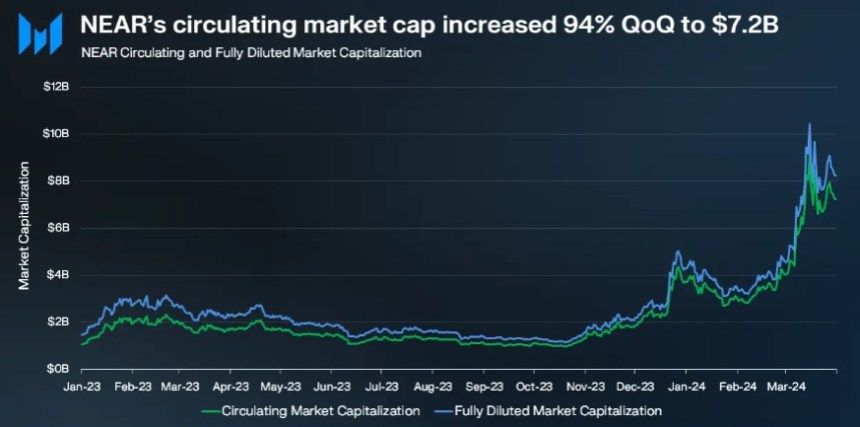
Notably, NEAR outperformed Bitcoin (BTC) and Ethereum (ETH), which recorded QoQ growth rates of 69% and 53%, respectively. Additionally, NEAR’s revenue, derived from network transaction fees, witnessed an 82% QoQ increase, reaching .9 million.
NEAR continued its address growth trend in Q1 2024, with average daily active addresses reaching 1.2 million, representing a robust 42% QoQ increase.
The network also witnessed a surge in daily new addresses, totaling 236,000 (a 37% QoQ increase), and surpassed the milestone of 100 million total accounts.
According to Messari, contributions from established protocols like KAIKAINOW, Sweat, and Playember and the adoption of HOT Wallet, averaging over 350,000 daily active addresses in March and nearly 3 million total wallets, drove this expansion.
Stablecoin Market Cap Soars In Q1
Per the report, the protocol experienced a sustained increase in transaction activity throughout Q1 2024, with daily transactions reaching 4.3 million, representing a 78% QoQ increase and a 538% increase over the last six months.
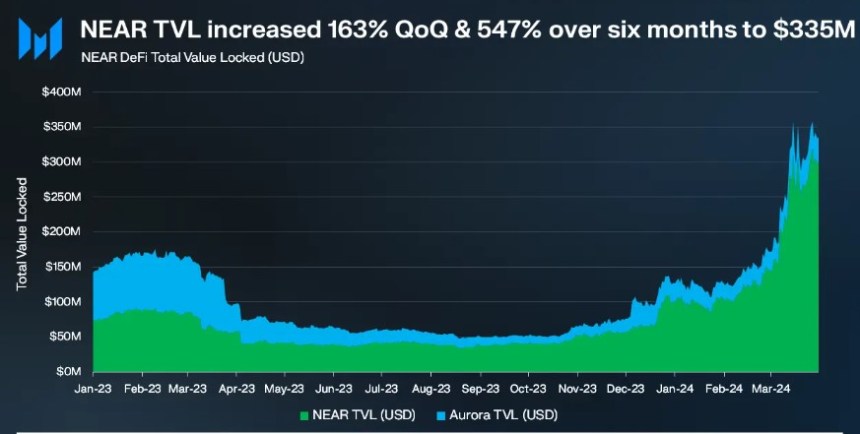
Similarly, NEAR’s TVL witnessed substantial growth, ending the quarter at 5 million, a 163% increase from the previous quarter and a 547% increase over the last six months.
Furthermore, NEAR’s decentralized exchange (DEX) volume experienced a notable surge, with an average daily volume of million, representing a 95% QoQ increase. Ref Finance emerged as the leading DEX on the protocol, with million daily volume, surpassing Orderly Network.
Lastly, NEAR observed a significant increase in its stablecoin market cap during Q1 2024, soaring 176% QoQ to 4 million. Notably, USDT experienced a significant surge, with its market cap increasing by 1,155% QoQ, reaching million.
Outperforming Top 20 Cryptocurrencies
Regarding price action, NEAR Protocol’s native token has exhibited strong performance, surpassing the top 20 cryptocurrencies in the market with a 9.4% uptrend in the past seven days. Meanwhile, Bitcoin has experienced a minor 1.5% price correction over the past 24 hours.
This positive trend has enabled NEAR to reclaim the significant .40 price level, which is important for bullish investors.
Looking ahead, the .60 mark may present a potential resistance level for the token, serving as a crucial barrier to monitoring. It could pave the way for a retest of the mark, signaling further upward momentum if successfully breached.
Conversely, the .80 mark has demonstrated its significance as a key support level. It was previously tested over the weekend and effectively prevented a more significant price decline.
Despite the optimistic outlook, it is important to note that the token remains down by over 64% from its all-time high of .4, reached in 2022.
Featured image from Shutterstock, chart from TradingView.com
Stablecoin Market Hits $160 Billion, Reaching Heights Not Seen Since Terra’s Crash
 This week, the value of the fiat-pegged cryptocurrency economy has climbed to 0 billion, a peak last observed in May 2022, shortly before Terra’s UST detached from its intended parity on May 9, 2022. In the past month, various stablecoins have experienced an increase in supply, with Ethena’s USDE at the forefront, registering a […]
Bitcoin News
OpenAI Setback No Match For FET’s 160% Surge: Time To Invest In AI?
The Artificial Intelligence (AI) sector in the crypto space has enjoyed one of the most prominent rallies despite the debacle with OpenAI. The company behind ChatGPT fired one of its founders and CEO, Sam Altman, sparkling downside pressure for AI-based tokens, such as FET.
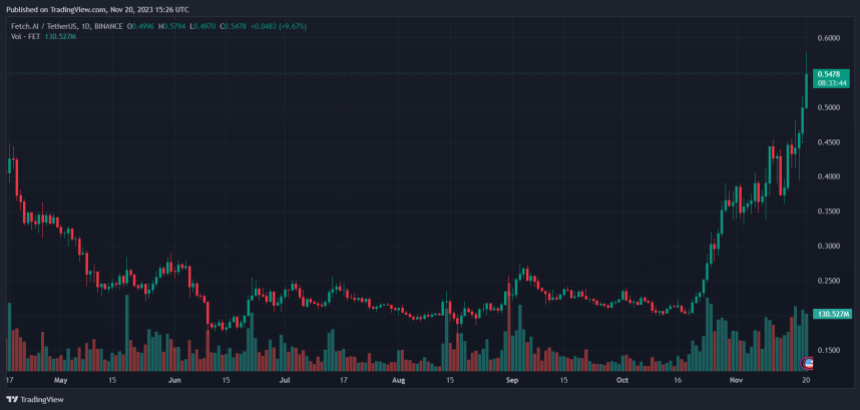
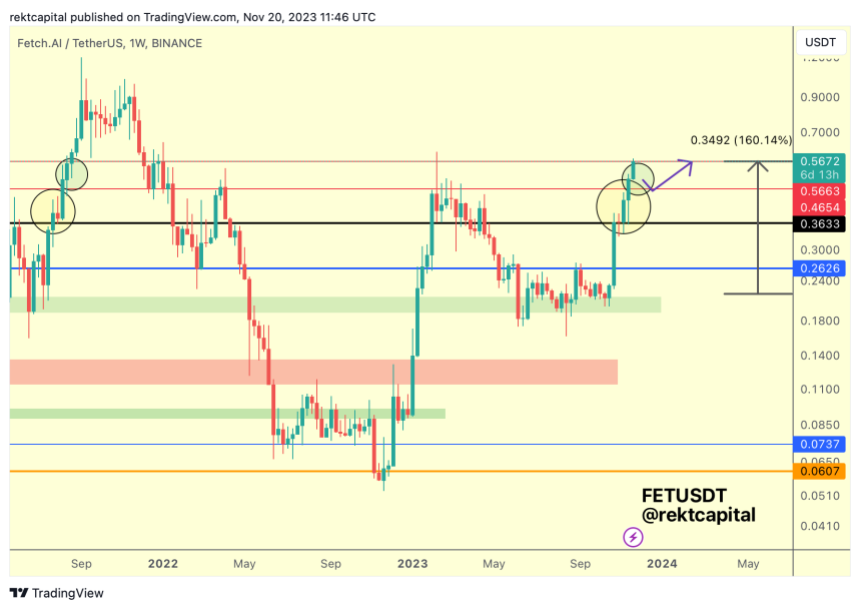
The native token for Fetch.ai, FET, has been trending to the upside following the general market sentiment. Over the past month, the cryptocurrency recorded a 160% rally, and it’s poised for further profits as it breaches critical resistance levels.
OpenAI Controversy Adds Fuel For FET’s Rally
Data from Coingecko indicates that FET’s bullish momentum took a hit last week as news about Sam Altman leaving OpenAI broke. The token has been moving with any development from the broader AI sector, and the uncertainty surrounding this company has impacted its performance on low timeframes.
Over the weekend, FET regained its bullish momentum and reclaimed territory, extending a more significant rally. In that sense, a pseudonym trader looked into FET’s potential target as the cryptocurrency continues “its rally without a dip.”
In the past week, FET breached the resistance at .56, targeting its 2022 highs, as seen in the chart below. If the bullish momentum continues, the token could rise to its 2021 highs between .70 and .90.
FET Rally Could End In Massive Correction
Our Editorial Director and analyst, Tony Spilotro, has been bullish on FET’s trajectory. The analyst believes FET could rise 2x to 4x before losing steam and re-visiting support.
In the past, whenever the token followed a similar trajectory, printing a buy signal above the monthly Bollinger Band, as Spilotro stated, FET corrected by an impressive 80%. Thus, the analyst recommended new investors to tread carefully. Spilotro said:
(…) its safe more than likely to buy FET at such levels, so long as you have a plan to get out before the next 70+% correction happens. Otherwise, price could retrace back to your entry here. Be smart and don’t expect the rally to go on forever.
Today, Microsoft announced the hiring of Sam Altman to spearhead a new AI division. The company will commit to providing resources for the new division, which could ignite a new bull era for AI and AI-based tokens.
Cover image from Unsplash, chart from Tradingview
Seoul Takes Control Over $160 Million in Assets of Former Terraform Employees, Founder

Authorities in South Korea have reportedly seized assets worth billions of won belonging to former representatives of Terraform Labs. The measure should prevent suspects in the case with the failed blockchain firm from selling property that may have been obtained with criminal proceeds.
South Korean Law Enforcement Moves to Seize Terraform-Linked Real Estate, Report
Prosecutors in South Korea have so far established control over 210 billion won (nearly 0 million) in assets owned by employees and executives of Terraform Labs, the company behind the collapsed cryptocurrency luna and stablecoin terrausd, the national broadcaster KBS reported.
The property, mostly real estate, has been seized by the financial and securities crime joint investigation team of the Seoul Southern District Prosecutor’s Office. The move aims to prevent eight people from disposing of the assets that authorities suspect may have been acquired using undue profits.
Among them is Terraform Labs co-founder Shin Hyun-seung, also known as Daniel Shin, who has been accused of unfairly earning some 140 billion won by buying luna before it was officially issued and selling it at peak price afterwards, while failing to inform investors about the risks associated with the coin.
Shin also allegedly used customer information and funds of a fintech firm he later found, Chai Corp., to promote luna. He now faces multiple charges of fraud and violations of capital markets and financial laws in South Korea.
In November, last year, prosecutors seized Shin’s home in a neighborhood of the South Korean capital, and have since frozen about 100 billion won worth of his property. Despite the charges, a Seoul court rejected their second request for his pre-trial detention last week.
South Korean investigators claim Shin made a total of over 154 billion won in gains while working with Terra. They intend to also track down his hidden assets and seize them. The unfair profits of the seven other employees allegedly amount to 169 billion won, 114 billion of which have been “collected and preserved,” the KBS report detailed.
Shin and others are accused of masterminding the Terra business in a way that allowed them to acquire pre-issued luna that they sold when the price increased after launch. Terraform’s other co-founder, Do Kwon (Kwon Do-Hyung) was arrested in Montenegro in March along with Han Chang-joon, the company’s chief financial officer.
Kwon is likely to stand trial in the small Balkan nation for attempting to leave for Dubai on a forged Costa Rican passport, before he is handed over to either South Korea or the United States to face other charges. Both nations are seeking his extradition.
Do you expect South Korean authorities to eventually confiscate the assets of the Terraform Labs former employees? Share your thoughts on the subject in the comments section below.
Binance To Raise USDT, USDC, and TUSD Transaction Fees On Tron By 160%
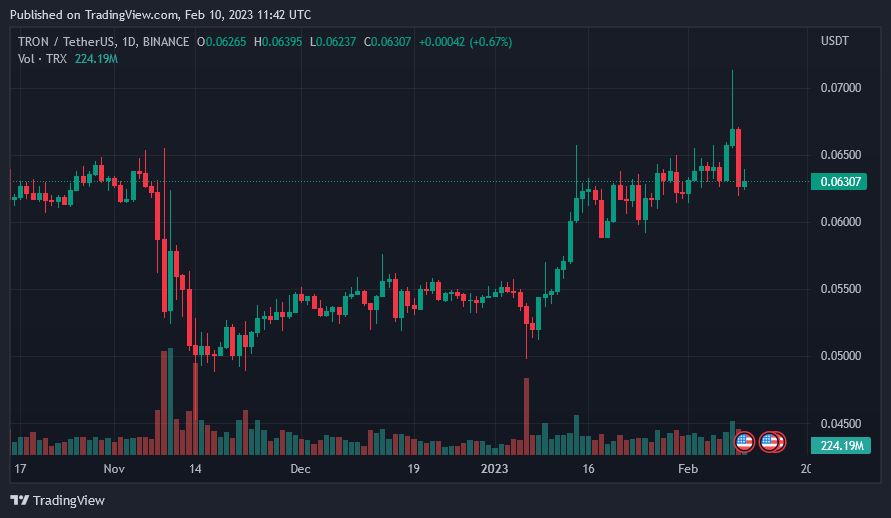
Binance is adjusting fees charged to users transacting on Tron, a smart contracting platform and Ethereum competitor.
Binance Increases Transaction Fees For Tron-Link Transfers
In an update on February 10, Binance, the world’s largest cryptocurrency exchange, said the fee adjustment follows a recent upgrade on Tron.
Binance is increasing the cost of sending USDT, USDC, and TUSD by 160%. Users must now pay .6, up from , when transferring value using any of these stablecoins.
Notably, using BUSD to move funds on Tron will be even more expensive, rising by 175%. Transferring value using BUSD, the stablecoin endorsed by Binance, will now be up to .2 for a single transfer.
Meanwhile, simple TRX transfers will cost the sender 15 TRX, up from 1 TRX.
Those who use Tron’s native tokens, including SUN, JST, BTT, and others, will have to pay an equivalent of 40 TRX. Because of the volatile nature of TRX, the dollar equivalent, Binance said, will also change.
The Impact Of The Dynamic Energy Model
On January 17, Tron upgraded via Aristotle, an implementation that increased the platform’s capabilities.
Java-tron GreatVoyage-4.7.0 (Aristotle) has been released!
It is a mandatory update, containing a few important features:
Add dynamic energy model and "Stake 2.0" stake mechanism;
— TRON DAO (@trondao) January 17, 2023
Every node in Tron was required to update. Besides introducing Stake 2.0, designed to improve the flexibility of the platform’s resource model and drastically enhance the staking stability within the blockchain, Tron introduced the dynamic energy model.
The objective of this model, Tron explained, is to ensure balanced development across its ecosystem. By integrating the suggestions under Tron Improvement Proposal (TIP) 491, the network dynamically adjusts the future energy consumption of a contract based on what’s currently consumed. Tron observed that there was resource concentration and this impacted user experience.
This is because when the network is congested with low-value transactions, and as a result, other worthy transactions posted by dApp developers, for example, must wait longer. This development hampered the dApp ecosystem expansion.
The dynamic energy model makes posting low-value transactions expensive by penalizing resource concentration using an energy factor. That means if a user calls a “hot” contract, they have to pay more in transaction fees.
With this, dApp developers and other users won’t have to wait longer for their transactions to be confirmed. Through this adjustment, Tron believes the network will be more robust, balanced, and diverse.
Over 50% of all USDT in circulation is held in Tron. Users prefer Tron because of its relatively low transaction fees compared to Ethereum. As of February 10, data from TronScan shows a circulating supply of .1 billion USDT.
Interesting. More than 50% of USDT is on Tron and this % has been growing recently.
For comparison, 39.87% is on Ethereum. pic.twitter.com/V30EbK1EJA
— Patrick | Dynamo DeFi (@Dynamo_Patrick) February 6, 2023
Quant (QNT) Price Defiles All Odds On A Bloody Day, Eyes $160
- QNT price holds strong above 50 and 200 EMA on a higher timeframe.
- QNT rallies as price eyes 0 despite the crypto experiencing a bloodbath across the market.
- The price faces resistance at 4 in the weekly timeframe.
Quant (QNT) price has recently shown bullish strength against tether (USDT) as price trends higher above expectations. The price of Quant (QNT) has shown its strength despite Bitcoin (BTC) pulling most altcoins down after a rally from ,000 to a region of ,400, with the price rejected instantly from that region. (Data from Binance)
Quant (QNT) Shines Despite Bloodbath
Market Outlook | Source: QNT On Coin360.com
Despite the huge decline in price across the crypto market with what seems to be a bloodbath, the price of QNT continues to shine above the chart, as many expect this coin to perform extremely well when the market becomes stable.
The price of QNT on the high and low timeframe continues to trend with swing highs and lows as the price eyes a potential 0 reclaim.
Quant (QNT) Price Analysis On The Weekly Chart
The price of QNT has recently bounced from a low of in the weekly timeframe rallying to a high of 0 before rejecting to a region of , where the price has formed good support for price sell-off on the weekly timeframe.
QNT price moved from that region breaking higher to 0, where the price is currently facing resistance to breaking higher to a region of 0-0.
The price of QNT needs to break the 0 resistance with good volume for the price to have an opportunity to trend to a higher region; if the price of QNT is rejected, we would expect the price to retest the support area of where demand for the price of QNT has been created.
Weekly resistance for the price of QNT – 0.
Weekly support for the price of QNT – .
Price Analysis Of QNT On The Daily (1D) Chart
Daily QNT Price Chart | Source: QNTUSDT On Tradingview.com
In the daily timeframe, the price of QNT continued to show strength as the price faced rejection in an attempt to break 0, with the price holding strong and continuing to maintain its bullish structure.
If the price of QNT continues to hold above the trendline support it has formed on the daily timeframe, we could expect the price of QNT to break above 0.
The price of QNT trades at 7 above the 50 Exponential Moving Average (EMA). The 50 EMA acts as a support for QNT price at 6.
A break and close below 6 could see the price of QNT retest lower regions as this invalidates the bullish setup of .
Daily resistance for the QNT price – 0-0.
Daily support for the QNT price – 6.
Featured Image From zipmex, Charts From Tradingview and Coin360
NewsBTC
The Greatest Shakeout: Bitcoin Reclaims Generational Log Curve With 160% Rally
The devastating day now known as Black Thursday took Bitcoin price down to ,800. The sharp collapse also knocked the asset out of a logarithmic growth curve it had been following its entire history.
This latest, over 160% rally has now reclaimed that generational log curve, making it the greatest shake out the cryptocurrency market has ever witnessed.
Bitcoin Reclaims Log Growth Curve After Greatest Shakeout In Crypto History
Bitcoin price had been trading at over ,000 in February, after an early rally in 2020. The stock market alongside it had set a new all-time high.
But a spreading pandemic and its impact on the economy had other ideas for markets, causing a catastrophic collapse. The stock market suffered its worst quarter close on record as a result, and Bitcoin fell out of a logarithmic growth curve it traded within for over ten years.
Related Reading | Stimulus Checked: Here’s The ROI on a ,200 Investment in Top Crypto Assets
The drop out of the growth curve had even the most dedicated Bitcoin supporters wondering if it could actually go to zero. Oil prices falling into negative territory alongside Bitcoin’s demise only further fueled these fears.
However, markets have been recovering thanks to stimulus checks handed out by the US government. The economy is reopening, and the pandemic is slowing.
Bitcoin has now rallied over 160% from its recent bottom and has reclaimed the log curve, leaving the greatest shake out in crypto history on Bitcoin price charts.
Possible Price Targets Based on Logarithmic Growth Curve
Bitcoin is trading back withing the all-important logarithmic growth curve. It can once again be used with some confidence for upside price targets and finding the next potential peak.
Upside targets can be established by targeting the upper band. Selecting key dates that may act as logical tops for Bitcoin, can provide sensible and realistic price levels.
There is a tendency for Bitcoin to reach set its tops and bottoms in December, so December 2020, 2021, and 2022 have each been selected.
Potential top levels put Bitcoin price reasonably at ,000, 0,000 and 0,000 respectively. As time goes by, the potential growth slows and volatility within the curve declines.
Related Reading | One Week Away: Comparing Past Pre-Halving Bitcoin Price Action
Each time the crypto asset passes through the median line, it has set a new all-time high price record. Falling through it has resulted in a bear market. In the example above, it failed to break through the median in June 2019.
Each new bull market has been the result of Bitcoin’s halving, which is just three days away. Now that the shakeout is over, Bitcoin has reclaimed the log curve, and the halving is here, the next bull market may finally be next.
Featured image from Pixabay, Charts by TradingView
NewsBTC
Ethereum Just Broke $160 And It’s Vulnerable to a Larger Decline Below $155K
Ethereum is declining and it recently broke the 0 support, similar to bitcoin. ETH price is likely to continue lower below the 8 and 5 support levels in the near term.
Ether price is showing a few bearish signs below the 2 level against the US Dollar.
The bears seem to be in control and they are likely to aim a larger decline below 5.
This week’s key bearish trend line is in place with resistance near 4 on the hourly chart of ETH/USD (data feed via Kraken).
Bitcoin is also sliding and it recently broke the key ,500 support area.
Ethereum Price Starts Substantial Decrease
After Ethereum failed to climb above the 0 resistance, there was a fresh decline against the US Dollar. ETH price declined steadily and broke the 5 support and the 100 hourly simple moving average.
It opened the doors for more losses and the price recently broke the 2 support. The decline was such that the bears were able to push the price below the 0 support.
A low is formed near 8 and the price is currently trading in a bearish zone. An initial resistance on the upside is near the 2 level. Besides, the 23.6% Fib retracement level of the recent decline from the 1 high to 8 low is near 1.
The main resistance for Ethereum is now near the 5 area. More importantly, this week’s key bearish trend line is in place with resistance near 4 on the hourly chart of ETH/USD.
Ethereum Price
The 50% Fib retracement level of the recent decline from the 1 high to 8 low is also close to the trend line and the 100 hourly SMA.
Therefore, a clear break above the 5 resistance area is needed to decrease the current selling pressure. The next major resistance is near 0, above which ETH might surge towards the 8 barrier. An intermediate resistance is near the 4 level.
ETH Could Decline Further
On the downside, an immediate support is near the 8 level. If ETH price fails to stay above the 8 support, it could easily decline below the 5 support in the near term.
In the mentioned case, Ethereum could revisit the 0 support area, where the bulls are likely to take a stand in the coming sessions.
Technical Indicators
Hourly MACD – The MACD for ETH/USD is now gaining momentum in the bearish zone.
Hourly RSI – The RSI for ETH/USD is now well below the 40 level, with a negative bias.
Major Support Level – 5
Major Resistance Level – 5 The post appeared first on NewsBTC.
NewsBTC
Ethereum Price Plunges to $160: Can Bulls Save The Day?
Ethereum started a sharp decline from the 0 resistance, similar to bitcoin from ,200. ETH declined towards 0, but it is likely to find strong bids near 8.
Ether price was rejected near the 0 area and it declined below 5 against the US Dollar.
Bitcoin price is down more than 5% and it is now trading near the ,500 resistance.
There was a break below a major bullish trend line with support near 2 on the hourly chart of ETH/USD (data feed via Kraken).
The pair is trading above a couple of important supports near 8 and 2.
Ethereum Starts Corrective Decrease
This past week, we saw a strong rise in Ethereum above the 5 and 0 resistance levels against the US Dollar. ETH price even surpassed the 5 resistance and traded close to the 0 zone.
However, the price faced a strong selling interest near the 8-0 resistance zone. A high was formed near 9 and the price started a solid downside correction.
The price traded below a couple of important supports near the 2 and 0 levels. Moreover, there was a break below a major bullish trend line with support near 2 on the hourly chart of ETH/USD.
Ethereum Price
Finally, Ethereum price settled below the 0 level and the 100 hourly simple moving average. It opened the doors for more losses and the price broke the 5 support. A low is formed near 2 and the price is currently correcting higher.
An initial resistance is near the 6 level. Besides, the 23.6% Fib retracement level of the recent decline from the 9 high to 2 low is also near 5.
The first key resistance is near the 8 level and the 100 hourly SMA. The main resistance is near the 0 level since it is close to the 50% Fib retracement level of the recent decline from the 9 high to 2 low.
Therefore, Ethereum needs to climb back above the 8 and 0 levels to resume its upward move towards 0 and 5.
Dips In ETH Remain Supported
On the downside, there are a couple of key supports near 2 and 8. If ETH fails to stay above the 8 support, there is a risk of a larger downside correction.
The main support is near the 2 level, below which Ethereum is likely to turn bearish and decline towards 0 in the near term.
Technical Indicators
Hourly MACD – The MACD for ETH/USD is slowly moving back into the bullish zone.
Hourly RSI – The RSI for ETH/USD is now well below the 50 level.
Major Support Level – 8
Major Resistance Level – 0 The post appeared first on NewsBTC.
NewsBTC