 Pepe-themed meme coin Smidge is exploding today with its price up over 150% in the last 24 hours. Meanwhile, a Pepe-focused layer 2 cryptocurrency, Pepe Unchained, is turning heads after raising almost M through the first week of its presale. Let’s dive into these two meme coins and see what’s behind their rapid rises. Smidge […]
Bitcoin News
Bitcoin, Ethereum, Solana Over 150% Annual Gains Leave The Stock Market, Gold In The Dust
Despite the relative tepid movement in the crypto market since Bitcoin hit a new all-time high (ATH) in March, Bitcoin, Ethereum, and Solana have continued to top traditional assets, including Gold. This was highlighted in a recent report that showed how crypto assets have provided the best returns for a while now.
Bitcoin, Ethereum, And Solana Outperform Traditional Assets
Raoul Pal, Co-Founder of Exponential Age Asset Management (EXPAAM), shared the crypto investment firm’s latest monthly update, showing annualized returns on all major assets.
Bitcoin, Ethereum, and Solana have topped traditional assets with annualized returns of 141%, 152%, and 224%, respectively. For context, NDX, the best major traditional asset, boasts an annualized return of 17%.
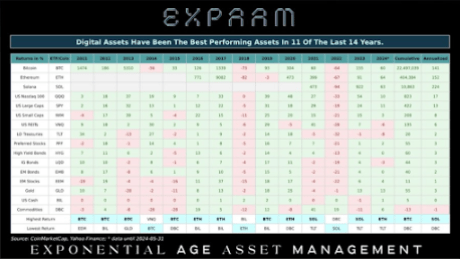
Thanks to this, these crypto assets have been the best-performing assets in 11 of the last 14 years. These digital assets also look on course to outperform traditional assets again this year, as they boast higher year-to-date (YTD) gains. Data from CoinMarketCap shows that Bitcoin, Ethereum, and Solana currently have YTD gains of over 67%, 66% and 70%, respectively.
On the other hand, Gold, the best-performing non-crypto asset this year, has a YTD gain of 13%. The NDX boasts a YTD gain of 10%, while the SPY has recorded a YTD gain of 11%. Interestingly, while the volatility of crypto assets has been criticized at times, this has largely contributed to why they have continued outperforming traditional assets.
The Director of Global Macro at Fidelity Investments, Jurrien Timmer, previously highlighted how Bitcoin has continued to record the best risk-reward since 2020. He also alluded to Bitcoin’s high volatility, stating that Bitcoin’s huge drawdowns have also come with large gains. The same can also said about crypto tokens, especially considering that a token like Solana, which dropped to as low as in late 2022, is now trading above 0.
More Gains Ahead For BTC, ETH, SOL
Bitcoin, Ethereum, and Solana are expected to record more YTD gains as the year progresses, given that the crypto market is currently in a bull run. Recent developments in the crypto market also paint a bullish outlook for these crypto tokens. One is the increased demand for the Spot Bitcoin ETFs. Data from Farside Investors showed that these funds recorded net inflows of 6.6 million on June 4, their best day since March.
Meanwhile, the Spot Ethereum ETFs are expected to begin trading by July. Crypto analysts like Michael van de Poppe predict these funds could spark a significant rally for Ethereum and other altcoins. ‘Solana Summer’ also looks to be on the horizon, with the crypto token showing signs of imminent parabolic upward trend.
At the time of writing, Bitcoin has broken above the ,000 resistance level and is trading at around ,000, up almost 3% in the last 24 hours, according to data from CoinMarketCap.
Can Bitcoin Rise 150% From Here? Crypto Expert Peter Brandt Predicts The Top
Despite the Bitcoin decline below the ,000 price mark, a crypto analyst still maintains an optimistic outlook for the pioneer cryptocurrency, predicting that the price of Bitcoin could reach its top soon.
Analyst Says Bitcoin’s Top Is 0,000
On June 2, crypto analyst, Peter Brandt released a blog post predicting Bitcoin’s top in the current bull cycle. According to Brandt, the price of Bitcoin is expected to witness an exponential surge between the range of 0,000 to 0,000.
Brandt foresees Bitcoin’s peak to occur in 2025 between late August and early September. The analyst has based his predictions on the cryptocurrency’s previous halving dates, highlighting that this cyclical event tends to continually present an “almost perfect symmetry within past bull market cycles.”
The Bitcoin halving is a four-year cycle event which cuts mining rewards by half, thereby reducing supply and potentially driving up the price due to increased scarcity and heightened demand for the cryptocurrency.
Brandt has suggested a possible correlation
between Bitcoin’s bull runs in the past with the onset of its halving cycle, emphasizing that following each halving year, Bitcoin has witnessed a surge to new all-time highs. More specifically, he pointed out that the number of weeks from Bitcoin’s market bottom to the halving dates was nearly the same duration as the halving dates to the next bull market peak.
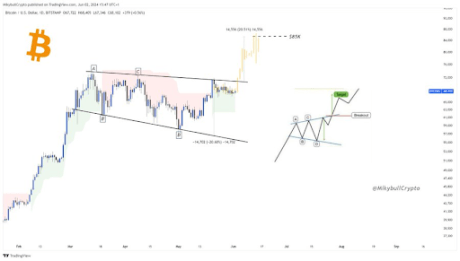
In his blog post, Brandt shared a price chart depicting Bitcoin’s price movements from 2010 to 2025, highlighting the cryptocurrency’s past performances after the halving events. The crypto analyst emphasized that after the halving event in 2012, and 2016, Bitcoin witnessed a significant bull run which pushed its price to new all-time highs.

The most notable bull cycle was seen in 2021 which came after the May 2020 halving event, with Bitcoin’s price surging to a previous all-time high of around ,044. Based on this recurring pattern, Brandt’s optimistic prediction sees Bitcoin potentially reaching as high as 0,000 in the next bull market.
25% Probability That Bitcoin Has Topped For This Cycle
While expressing his bullish outlook for Bitcoin, Brandt also disclosed a more pessimistic assessment of the cryptocurrency’s future price. The analyst has placed a 25% probability that Bitcoin has topped this bull market cycle.
This assessment is based on Bitcoin’s massive rally earlier this year, spurred on by the approval and launch of Spot Bitcoin ETFs. In March 2024, the price of Bitcoin surpassed its previous 2021 high, exceeding ,000 and officially marking a new all-time high.
Following historical trends, Bitcoin typically witnesses a bull rally to new all-time highs after its halving event. However, against the norms, the cryptocurrency experienced a peak above ,000 before its halving event on April 20.
Brandt has disclosed that if Bitcoin fails to reach a new all-time high after its halving event, he expects a price decline towards ,000. The analyst predicts that a drop below ,000 will raise the probability of “Exponential Decay,” implying a long-term downward trend for the cryptocurrency.
Embrace Privacy and Earn up to 150% APY With wZANO-USDT
 Bitcoin.com’s decentralized exchange, Verse DEX, has launched the second wZANO-USDT farm, offering an impressive APY of up to 150%. For full details, including instructions, head over here. This initiative is the continuation of the integration of the privacy-focused ZANO token into the broader Bitcoin.com ecosystem, an essential development for crypto enthusiasts valuing both high yields […]
Bitcoin News
SOL Price Breaks Crucial $150 Level Amid Robinhood’s Solana Staking Debut In Europe
Robinhood Crypto has announced the introduction of a Solana-staking product in Europe, accompanied by a bonus program for new customers.
This development comes as the company faces increased tensions with US regulators, which could potentially lead to legal repercussions. However, the move has propelled Solana’s (SOL) price to surpass the crucial 0 level, indicating a return of bullish momentum in the market.
Solana Staking And Crypto Rewards
According to the announcement, Robinhood unveiled new features for its European customers. These offerings include staking, localized applications, and crypto rewards.
As part of its expansion, Robinhood has launched its first crypto-staking product exclusively for European customers. Through the platform, users can stake their Solana holdings and earn rewards with the ability to unstake their assets at any time.
Additionally, new customers can receive a 10% bonus on their net purchases during their first 30 days on the platform, with the bonus paid out in Circle’s USDC stablecoin. This initiative aims to attract new users and improve their crypto investing experience.
While Robinhood Crypto expands its offerings in Europe, the company faces regulatory challenges in the United States. The US Securities and Exchange Commission (SEC) has issued a Wells Notice to the exchange, indicating the staff’s recommendation for an enforcement action against the platform.
Robinhood expressed disappointment in the SEC’s decision, emphasizing their efforts to seek regulatory clarity and asserting their belief that the listed assets on their platform are not securities.
Vlad Tenev, the CEO of Robinhood, revealed that the company has held over 16 meetings with the SEC. However, these interactions have been largely unsatisfactory, according to Tenev. He expressed the company’s willingness to engage with the SEC in good faith but noted the regulatory body’s lack of reciprocal efforts.
SOL Bulls Eye 0 As Trading Volume Rises
Solana’s native token, SOL, experienced a significant rebound in the past hour, surging from the 0 zone to its current trading price of 3. This price movement holds key significance for bullish investors as they aim to retest the 0 mark previously surpassed in March.
CoinGecko data further reveals a notable increase in SOL’s trading volume, reaching .7 billion in the last 24 hours, representing a 6.6% rise compared to the previous Monday’s trading session.
According to crypto analyst Jesse Olson, Solana has shown strength in its recent price action. Olson notes that Solana successfully hit all four downside targets and exhibited bullish divergence, followed by hitting three upside targets.
The price appears to form a higher low, increasing the probability of reaching “target four,” projected at the 5 mark.
Despite the bullish momentum, SOL faces crucial resistance walls at 7 and 2, which are expected to be significant obstacles toward higher price levels.
On the other hand, the 0 line has served as a key support level for Solana’s price over the past week. SOL’s bullish momentum remains uncertain as it strives to overcome these resistance levels and retest its yearly high of 9.
Featured image from Shutterstock, chart from TradingView.com
SOL Price Regains Strength, Can Solana Reclaim $150 and Continue Higher?
Solana started a fresh increase above the 2 resistance. SOL price is up nearly 8% and might continue to rise if it clears the 0 resistance.
- SOL price recovered higher and tested the 0 resistance against the US Dollar.
- The price is now trading above 52 and the 100 simple moving average (4 hours).
- There was a break above a key bearish trend line with resistance at 4 on the 4-hour chart of the SOL/USD pair (data source from Kraken).
- The pair could clear the 0 resistance unless it fails to stay above 6.
Solana Price Eyes More Upsides
Solana price formed a support base near the 8 level and started a fresh increase. SOL outperformed Bitcoin and Ethereum and moved into a positive zone above the 4 level.
There was a break above a key bearish trend line with resistance at 4 on the 4-hour chart of the SOL/USD pair. The pair even cleared the 50% Fib retracement level of the downward wave from the 4.40 swing high to the 8.00 low.
However, the bears are active near the key hurdle at 0. Solana is now trading above 5 and the 100 simple moving average (4 hours). Immediate resistance is near the 0 level or the 76.4% Fib retracement level of the downward wave from the 4.40 swing high to the 8.00 low.
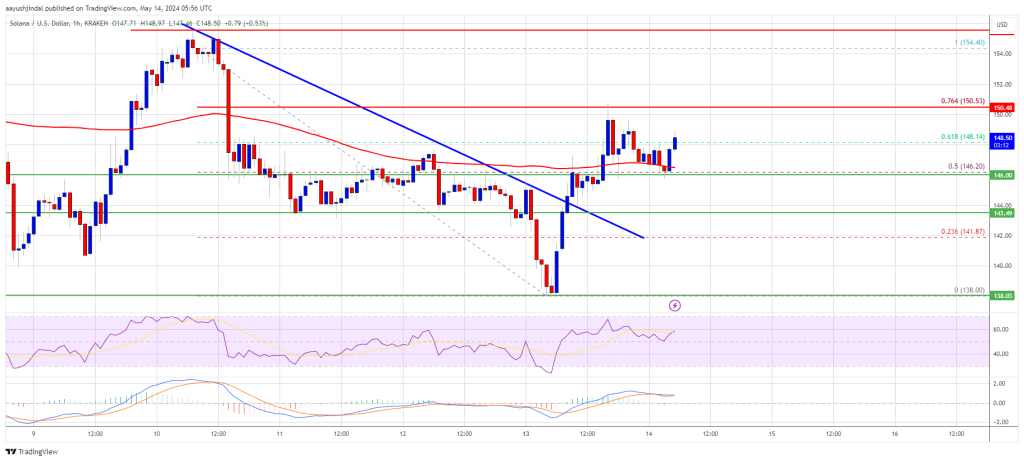
The next major resistance is near the 5 level. A successful close above the 5 resistance could set the pace for another major increase. The next key resistance is near 2. Any more gains might send the price toward the 5 level.
Another Decline in SOL?
If SOL fails to rally above the 0 resistance, it could start another decline. Initial support on the downside is near the 6 level and the 100 simple moving average (4 hours).
The first major support is near the 2 level, below which the price could test 8. If there is a close below the 8 support, the price could decline toward the 5 support in the near term.
Technical Indicators
4-Hours MACD – The MACD for SOL/USD is gaining pace in the bullish zone.
4-Hours RSI (Relative Strength Index) – The RSI for SOL/USD is above the 50 level.
Major Support Levels – 6, and 2.
Major Resistance Levels – 0, 5, and 2.
Uniswap On Arbitrum Nears $150 Billion In Swap Volume
Uniswap, one of the world’s largest decentralized exchanges (DEX) by total value locked (TVL), is approaching a major milestone on Arbitrum, the largest layer-2 by TVL on Ethereum.
According to data from Dune Analytics shared by Uniswap Labs, Uniswap on Arbitrum is on the cusp of surpassing a staggering 0 billion in total swap volume.
Riding The DeFi Boom
As of April 25, Uniswap had facilitated over 6 billion in cumulative swap volume on Arbitrum alone. The number has gradually increased over the past three years since June 2021, when it was deployed on Arbitrum, looking at on-chain data.

By August 2021, Uniswap was processing less than ,000 in swap volume. After that, they steadily picked up momentum throughout the crypto bear run of 2022. Notably, a sharp uptick from October 2023 coincided with the start of the crypto boom that eventually propelled Ethereum to over ,000 in Q1 2024.
The rising swap volume on Arbitrum reflects the increasing preference for Decentralized Finance (DeFi) solutions. As Uniswap on Arbitrum nears 0 billion, more users are increasingly turning to the popular DEX to trade, all without giving up control of their assets.
The surging popularity of Uniswap on Arbitrum can be partly attributed to significantly lower transaction fees compared to the Ethereum mainnet.
Through Arbitrum, the optimistic roll-up solution, swappers enjoy low transaction fees. They can also trade from a scalable environment secured by the Ethereum mainnet.
Ethereum developers recently implemented Dencun, introducing a new transaction format called “blobs.” Because of this, layer-2 solutions can store large chunks of data off-chain, reducing the mainnet bloat. Subsequently, fees have been lowered, drastically enhancing the user experience for Arbitrum and other layer-2 users like Base and Optimism.
Uniswap V4 And United States Wells Notice
Following Dencun’s activation, Uniswap Labs plans to deploy v4. This iteration introduces features like Hooks that developers say will make the DEX even more efficient and flexible. The launch is set for this year.
Though Uniswap V4 is huge for the DEX and DeFi as a whole, the United States Securities and Exchange Commission (SEC) ‘s decision to issue a Wells notice is a setback.
The regulator intends to sue. However, the founder, Hayden Adams, responded in a post on X that they are ready to fight.
Stablecoins Steal The Spotlight: $150 Billion Market Cap, $122 Billion Daily Trades
Stablecoins have recently achieved a significant milestone, surpassing 0 billion in market capitalization, with daily trading volume reaching 2 billion. This achievement marks a notable resurgence and growth in the stablecoin sector, with implications for the broader cryptocurrency ecosystem.
Market Dynamics And Growth Factors
Stablecoins are digital assets designed to maintain a stable value by pegging their price to a reserve asset, such as the US dollar or other fiat currencies. They serve as a crucial bridge between traditional finance and the crypto space, offering stability and liquidity for users and investors.
The recent surge in the stablecoin market can be attributed to several key factors. Firstly, the growing demand for stable assets in the volatile crypto market has driven increased adoption of stablecoins as a safe haven for traders and investors. Additionally, the rise of decentralized finance (DeFi) platforms has fueled the demand for stablecoins as a means of conducting transactions, providing liquidity, and earning yields.
Tether’s Dominance And Market Impact
Tether (USDT), one of the most widely used stablecoins, has played a significant role in driving the growth of the stablecoin market. With a market capitalization exceeding 0 billion, Tether’s dominance underscores its position as a key player in the crypto space.
Undoubtedly dominant in this sector, Tether commands a 70% market share. With a market capitalization of over billion, USD Coin (USDC), the second largest stablecoin, grants Circle’s stablecoin a market share exceeding 20%. At the time of writing, DAI held a 3% market share and .7 billion, placing it in third position.
Tether’s market impact extends beyond its role as a stable asset, as it has faced scrutiny and regulatory challenges due to concerns about its reserve backing and transparency. Despite these challenges, Tether’s resilience and continued dominance highlight the strong demand for stablecoins and their utility in the digital economy.
Crypto Enthusiasts Celebrate Stablecoins’ Rising Market Cap
The crypto community is cheering the rising market cap of stablecoins, seeing it as a sign of coming prosperity.
Total Stablecoin Mcap:
Mar 21st. 7b.
Feb 21st. 8b.
Jan 21st. 3b.
Dec 21st. 0b.
Nov 21st. 7b.
Oct 21st. 4b.it is impossible and stupid to not be bullish on DeFi whilst this chart is just up and to the right for the last 6 months. pic.twitter.com/qkcERkIXi8
— ZeroToTom (@zerototom) March 21, 2024
A growing market cap suggests more money is flowing into crypto, providing much-needed liquidity for trading and potentially pushing prices up. Additionally, stablecoins offer a safe haven during market dips, potentially encouraging more investors to enter the broader crypto market. This increased comfort and investment could fuel the entire market’s growth.
Implications For The Crypto Ecosystem
The surpassing of 0 billion in stablecoin market capitalization signifies a maturing and expanding crypto ecosystem. Stablecoins have become essential infrastructure in the digital economy, enabling seamless transactions, cross-border payments, and financial services innovation.
Featured image from Xverse, chart from TradingView
Meme Coin Presale Trend Goes Wild on Solana: Almost $150 Million Raised
 An investigation carried out by blockchain sleuth Zackxbt has found that the trend where individuals ask for funds on social networks and promote their meme coin launches has grown in popularity. Almost 0 million has been raised on Solana after Book of Meme (BOME), the token that pioneered this trend, launched earlier this month. Meme […]
Bitcoin News
SOL Price Breaks $150 – Why Solana Could Soon Test $180
Solana is gaining bullish momentum above 0. SOL price is showing positive signs, and it could even surpass the 2 resistance in the near term.
- SOL price started a fresh increase from the 8 support against the US Dollar.
- The price is now trading above 0 and the 100 simple moving average (4 hours).
- There is a connecting bullish trend line forming with support at 0 on the 4-hour chart of the SOL/USD pair (data source from Kraken).
- The pair could continue to rally if it clears the 6 and 2 resistance levels.
Solana Price Starts Fresh Rally
Solana price formed a base above the 0 support zone and recently started a fresh increase. There was a decent increase above the 5 and 5 levels.
The price is up nearly 10% and there was a move above the 0 level, like Bitcoin and Ethereum. The bulls pushed the price above the 76.4% Fib retracement level of the downward move from the 2.86 swing high to the 7.25 low.
Solana is now trading above 0 and the 100 simple moving average (4 hours). There is also a connecting bullish trend line forming with support at 0 on the 4-hour chart of the SOL/USD pair.
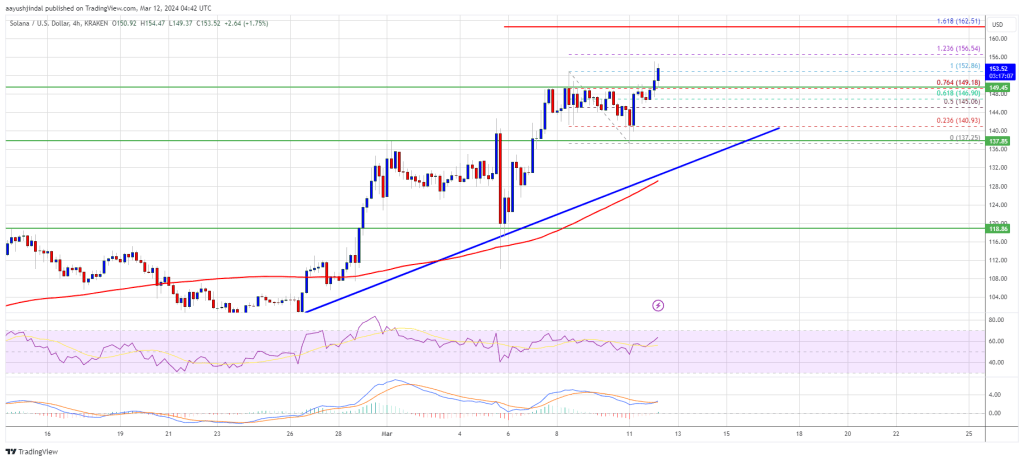
Source: SOLUSD on TradingView.com
Immediate resistance is near the 6.50 level. The next major resistance is near the 2.50 level or the 1.618 Fib extension level of the downward move from the 2.86 swing high to the 7.25 low. A successful close above the 2.50 resistance could set the pace for another major increase. The next key resistance is near 5. Any more gains might send the price toward the 0 level.
Are Dips Limited in SOL?
If SOL fails to rally above the 2.50 resistance, it could start a downside correction. Initial support on the downside is near the 0 level.
The first major support is near the 2.00 level, below which the price could test 8.00 and the trend line. If there is a close below the 8.00 support, the price could decline toward the 8.00 support or the 100 simple moving average (4 hours) in the near term.
Technical Indicators
4-Hours MACD – The MACD for SOL/USD is gaining pace in the bullish zone.
4-Hours RSI (Relative Strength Index) – The RSI for SOL/USD is above the 50 level.
Major Support Levels – 2.80, and 2.50.
Major Resistance Levels – 0, 2, and 8.