 The Fantom Foundation has unveiled a treasury allocation of 200 million FTM, approximately 0 million USD, to expedite the migration of partners to its new Sonic network. This allocation includes native application grants, strategic grants to decentralized applications (dapps), and first-class infrastructure tools and partners for developers and users. The Foundation is said to be […]
Bitcoin News
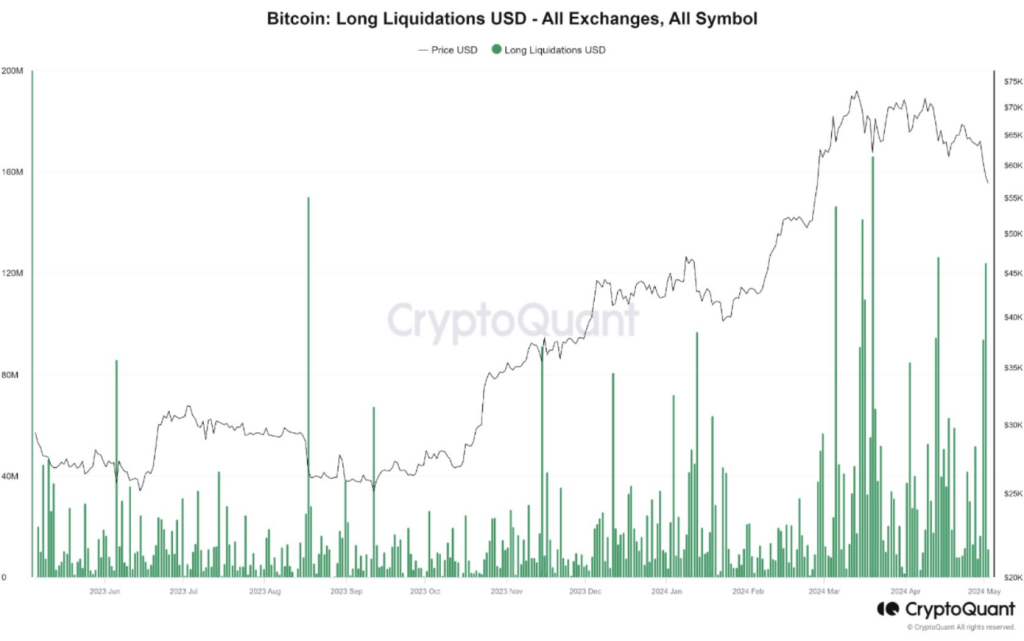
Bitcoin Update: $120 Million Futures Liquidated As Price Takes A Beating
The recent dip in the price of Bitcoin below the ,000 support level has sent jitters through the cryptocurrency market. While the price drop triggered liquidations in futures markets, analysts warn that a more significant decline could be on the horizon in the absence of a full-blown market capitulation.
Measured Retreat, Not Mass Exodus
Following the price drop, CryptoQuant, a cryptocurrency analysis platform, reported roughly 0 million in liquidated long positions (bets that the price would go up). This liquidation is noteworthy, but unlike previous selloffs at the same support level, it doesn’t signal a panicked exodus from investors. Investors seem to be taking a more measured approach, suggesting a possible short-term correction rather than a long-term bear market.
$BTC Futures Market Not Yet Signaling Capitulation
“Given the relatively small amount of long position liquidation and the lack of dramatic negative funding ratios, we believe that a ‘capitulation’ has not yet occurred in the futures market.” – By @MAC_D46035
Link
… pic.twitter.com/xqArLQiITf
— CryptoQuant.com (@cryptoquant_com) May 2, 2024
A Glimmer Of Hope For Long-Term Investors
While the short-term outlook appears cautious, there are reasons for long-term investors to remain optimistic. On-chain metrics, which analyze data directly on the Bitcoin blockchain, offer hints of a potential future upswing.
Metrics like MVRV (Market Value to Realized Value) suggest there’s a chance for an upward move in the larger market cycle. This information empowers strategic investors to view the current situation as a potential buying opportunity, particularly if a significant capitulation event unfolds in the futures market.
Navigating The Bitcoin Maze: Data-Driven Decisions Are Key
The current market volatility presents a complex challenge for investors. Understanding market sentiment is crucial for making informed decisions. The funding rate, an indicator of sentiment in futures contracts, has dipped into negative territory at times.
Traditionally, this suggests a stronger presence of bears (investors betting on a price decline) than bulls. However, the negativity hasn’t reached the extremes witnessed during past significant downturns, leaving the overall sentiment somewhat unclear.
Bitcoin’s Long-Term Narrative Remains Unwritten
Closely monitoring futures markets for signs of capitulation, along with analyzing other market indicators like the funding rate, is essential for success in this dynamic environment. Sharp investors armed with a strategic understanding of market dynamics are likely to profit from any future moves.
Bitcoin’s recent price drop has caused short-term volatility, but the long-term story remains unwritten. While the coming weeks might test investor resolve, those who can analyze market data and make strategic decisions could be well-positioned to capitalize on future opportunities.
Featured image from Pixabay, chart from TradingView
Litecoin Price Prediction: LTC Rally Could Extend To $120
Litecoin price is up over 10% and trading above 5 against the US Dollar. LTC could continue to rise toward the 0 resistance zone in the near term.
- Litecoin is showing positive signs from the support zone against the US Dollar.
- The price is now trading above 5 and the 100 simple moving average (4 hours).
- There is a key bullish trend line forming with support at 1.50 on the 4-hour chart of the LTC/USD pair (data feed from Kraken).
- The price could continue to rise toward the 0 level unless it breaks the 0 support.
Litecoin Price Gains Bullish Momentum
In the past couple of days, Litecoin gained pace and outperformed Bitcoin and Ethereum. LTC price formed a base above the level and started a decent increase.
There was a break above the and resistance levels. The bulls even pushed the price above 0. There was a clear move above the 76.4% Fib retracement level of the downward move from the 5.71 swing high to the .00 low. A new multi-week high was formed at 2.49 and the price is now consolidating gains.
top near .40 before it started a fresh decline.
Litecoin is now trading above and the 100 simple moving average (4 hours). There is also a key bullish trend line forming with support at 1.50 on the 4-hour chart of the LTC/USD pair.
On the upside, immediate resistance is near the 2.50 zone. It is near the 1.236 Fib extension level of the downward move from the 5.71 swing high to the .00 low. The next major resistance is near the 5 level. If there is a clear break above the 5 resistance, the price could start another strong increase.
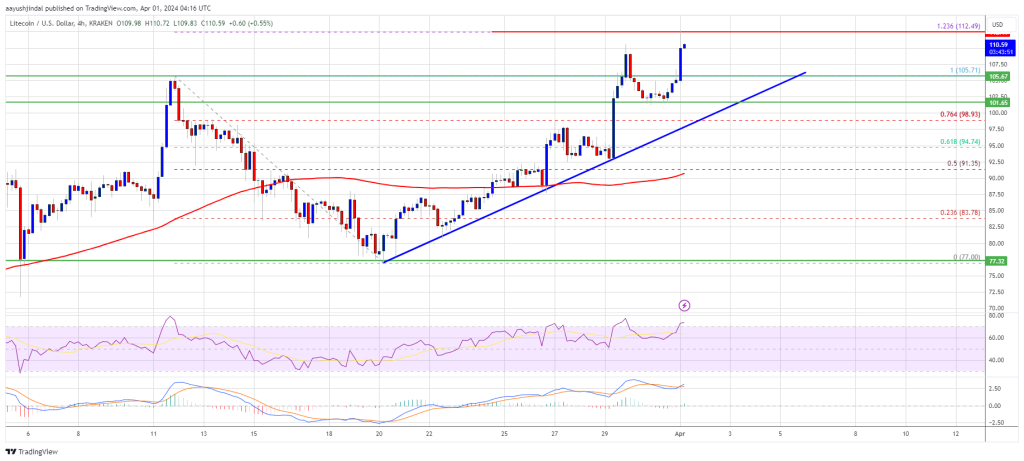
Source: LTCUSD on TradingView.com
In the stated case, the price is likely to continue higher toward the 0 and 2 levels. Any more gains might send LTC’s price toward the 2 resistance zone.
Are Dips Supported in LTC?
If Litecoin price fails to clear the 5 resistance level, there could be a downside correction. Initial support on the downside is near the 5 level.
The next major support is forming near the 0 level, below which there is a risk of a move toward the support. Any further losses may perhaps send the price toward the support.
Technical indicators:
4-hour MACD – The MACD is now gaining pace in the bullish zone.
4-hour RSI (Relative Strength Index) – The RSI for LTC/USD is above the 65 level.
Major Support Levels – 5 followed by 0.
Major Resistance Levels – 5 and 0.
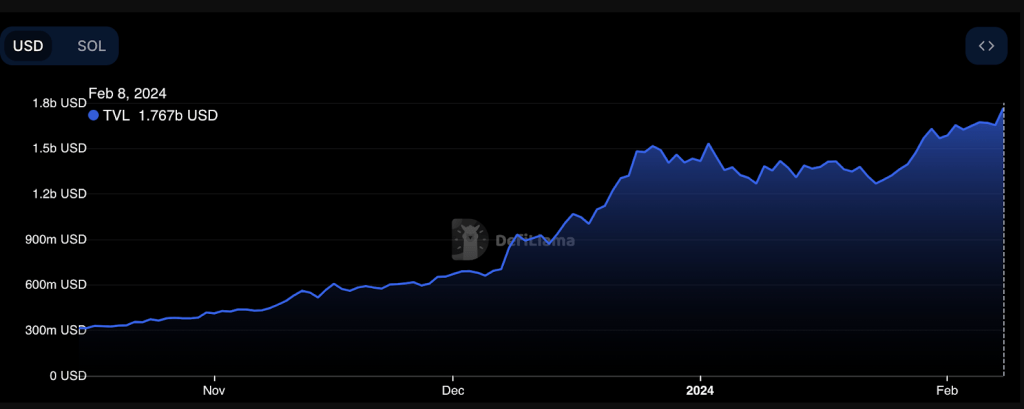
Solana TVL Nears $2 Billion – Will SOL Cruise To $120 Before Valentine’s?
Solana, the high-speed blockchain platform, is back in the green after a rollercoaster week. Its native token, SOL, triumphantly hit the 5 mark today, defying naysayers and sparking renewed optimism. But is this just a fleeting bounce, or the start of a sustained climb towards 0 before Valentine’s Day?
Defi Frenzy Heats Up, Injecting Millions Into Solana
The key driver behind this recent surge seems to be the red-hot DeFi scene on Solana. Total Value Locked (TVL), a metric indicating the combined value of crypto assets deposited in DeFi protocols, has shot up by an impressive 0 million in just 16 days, pushing the network’s TVL at .95 billion.
This influx of capital, primarily directed towards projects like Jito, Kamino, and Blazestake, has fueled demand for SOL, pushing its price upwards.
Not Without Hiccups: Outage Raises Scalability Concerns
However, Solana’s journey hasn’t been entirely smooth sailing. A five-hour network outage on February 6th cast a shadow of doubt on its scalability and reliability. While investors largely held their ground, the incident served as a stark reminder of the challenges facing ambitious blockchain projects.
Technicals Paint A Bullish Picture, But Resistance Looms
Looking at the charts, things appear promising for SOL. The 33.6% price rally over the past two weeks aligns with the rising TVL, suggesting a strong correlation between DeFi activity and token value.
Technical indicators like the upper Bollinger Band point towards a potential resistance zone around 5, the previous local high. If bulls can overcome this hurdle, a push towards 0 could be on the horizon.
While some analysts are bullish, predicting a retest of 0, others urge caution. The crypto market remains inherently volatile, and unforeseen events can quickly alter the course.
Additionally, regulatory developments and broader market trends need to be carefully considered before making any investment decisions.
Solana’s Future: DeFi Ecosystem Holds The Key
Ultimately, the fate of SOL hinges on the continued growth and stability of its DeFi ecosystem. If projects within the network can attract sustained investment and foster user engagement, the positive feedback loop between DeFi activity and token value could propel SOL further upwards.
However, addressing scalability concerns and navigating the ever-evolving regulatory landscape will be crucial for long-term success.
One thing is certain: Solana’s recent price action highlights the growing potential of DeFi and its impact on blockchain platforms. Whether it reaches 0 or not, the story of Solana is far from over, and investors will be watching closely as the DeFi revolution unfolds.
Featured image from VistaCreate, chart from TradingView
SOL Price Faces Big Move – Can Bulls Send Solana To $120?
Solana is attempting a fresh increase from the zone. SOL price could gain bullish momentum if it manages to clear the 0 and 4 resistance levels.
- SOL price started a fresh decline from the 6 resistance against the US Dollar.
- The price is now trading above and the 100 simple moving average (4 hours).
- There was a break below a key bullish trend line with support at 0 on the 4-hour chart of the SOL/USD pair (data source from Kraken).
- The pair could start another increase if it surpasses the 0 and 4 levels.
Solana Price Faces Key Test
Solana price started a fresh decline after it struggled to clear the 6 level like Bitcoin at ,800. There was a clear move below the 2 and 0 support levels.
Besides, there was a break below a key bullish trend line with support at 0 on the 4-hour chart of the SOL/USD pair. However, the bulls were active near the level and the 100 simple moving average (4 hours). The price is now attempting a fresh increase above the level.
The price retested the 0 zone and the 50% Fib retracement level of the downward move from the 6.41 swing high to the .95 low. SOL is now trading above and the 100 simple moving average (4 hours).
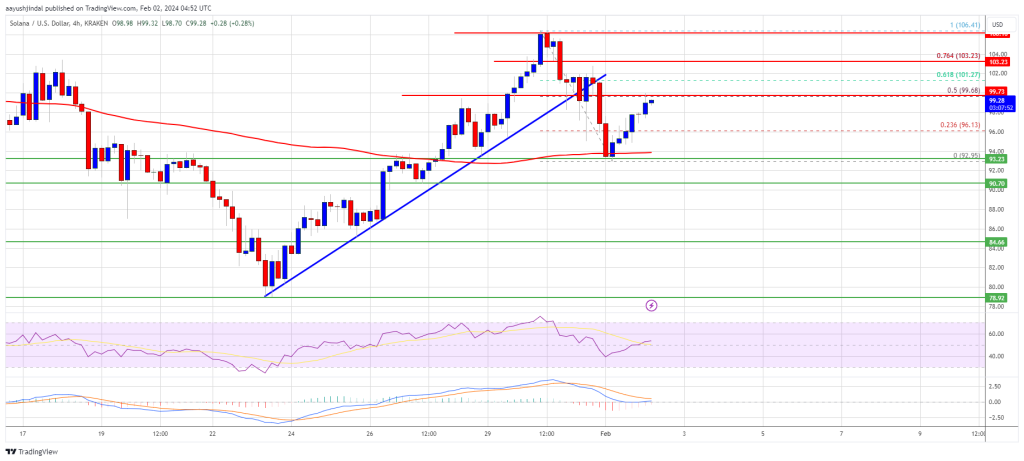
Source: SOLUSD on TradingView.com
Immediate resistance is near the 0 level. The next major resistance is near the 4 level or the 76.4% Fib retracement level of the downward move from the 6.41 swing high to the .95 low. A successful close above the 4 resistance could set the pace for another major increase. The next key resistance is near 2. Any more gains might send the price toward the 0 level.
Another Decline in SOL?
If SOL fails to rally above the 0 resistance, it could start another decline. Initial support on the downside is near the level and the 100 simple moving average (4 hours).
The first major support is near the level, below which the price could test . If there is a close below the support, the price could decline toward the support in the near term.
Technical Indicators
4-Hours MACD – The MACD for SOL/USD is gaining pace in the bullish zone.
4-Hours RSI (Relative Strength Index) – The RSI for SOL/USD is above the 50 level.
Major Support Levels – , and .
Major Resistance Levels – 0, 4, and 2.
Whales, Fresh Wallets Accumulating, Maker (MKR) Spikes 120% In 3 Months
On-chain data reveals that whales and new wallets are scooping more Maker (MKR), which seems to be propping the token, fanning demand. As of September, MKR is one of the top-performing tokens, adding roughly 120% in three months from June 2023 lows.
When writing, MKR is changing hands above ,300 and inching closer to July 2023 highs. Notably, MKR is up 14% in the past week of trading, driving market cap above .27 billion and trading volume by 36% on the last day.
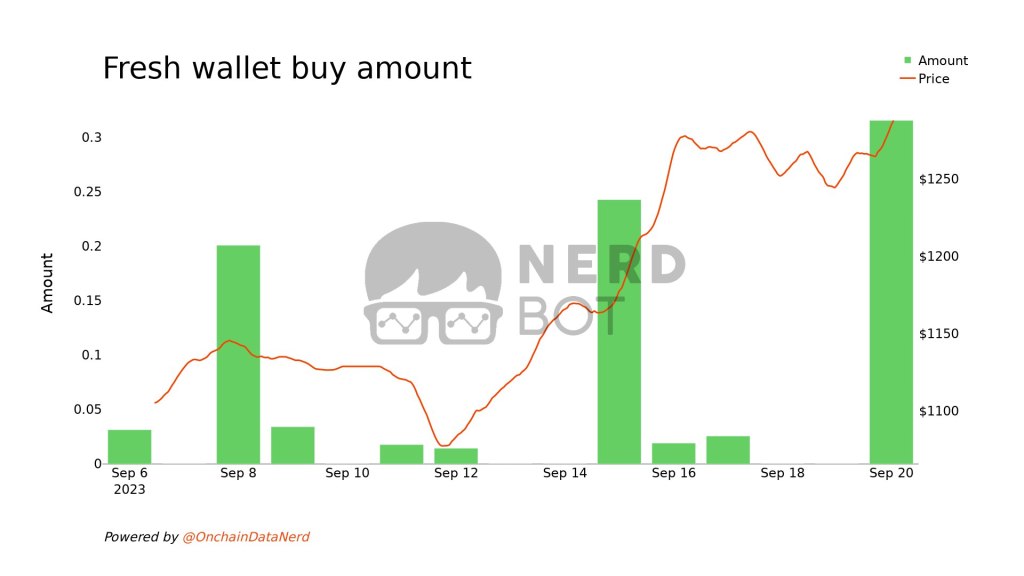
Whales And Fresh Wallets Buying Maker (MKR)
Trackers note that in the last week of trading, a whale, “0xad0”, bought 1261 MKR worth .62 million at an average price of ,290. Moreover, looking at the trends, whale and fresh wallet activities have been heightened over the previous week. With more accumulation, the token has been tracking higher in tandem.
Parallel data from Lookonchain confirms this development, especially from early September. Earlier this month, a whale sold .13 million of Ethereum and bought an equal amount in MKR on Binance.
This transaction comes a day after another entity moved .3 million of MKR from Binance. However, while whales appear to be loading up more MKR, Vitalik Buterin, the co-founder of Ethereum, sold his stash of MKR for ETH on September 2.
Maker Finance is a decentralized lending and borrowing platform on Ethereum. As of September 20, the protocol had a total value locked (TVL) of over .8 billion, according to DeFiLlama. More data shows that the platform held 9.56 million of MKR, its native token, and different stablecoins worth .58 million.
DAI Yield Rising, New Burning Structure Implemented Fueling Bulls
MakerDAO, a decentralized autonomous organization (DAO), manages DAI, an algorithmic stablecoin that passes yield to the holder. Holders of MKR, the native token of Maker, can also vote on proposals.
Following the brief USDC depegging in March 2023, the DAO reduced its reliance on the USDC, a centralized fiat-backed stablecoin. In early August, the community also voted to temporarily increase the DAI Savings Rate (DSR) from 3.19% to 8%, incentivizing users to mint DAI via the Spark Protocol.
Besides changes to the DSR, MakerDAO also introduced an improved smart burn mechanism where collateralized debt positions (CDPs) to back circulating DAI can be closed freely without causing stablecoin shortages in the market. In this new arrangement, circulating MKR would be bought and burned independent of CDP closure, allowing the protocol to be more flexible in light of market changes.
However, with this, every burning reduced circulating supply, which has supported prices as price action revealed.
Litecoin Price Prediction: Bullish Break To $120 Still In Sight
Litecoin price extended its increase above the zone against the US Dollar. LTC is rising and might attempt a fresh rally above the 0 resistance.
- Litecoin started a fresh increase above the zone against the US Dollar.
- The price is now trading above and the 100 simple moving average (4-hours).
- There is a key bullish trend line forming with support near .50 on the 4-hours chart of the LTC/USD pair (data feed from Kraken).
- The price could start another rally if there is a clear move above the 0 resistance.
Litecoin Price Outperforms Bitcoin
This past week, litecoin price formed a support base above the level against the US Dollar. LTC price started a steady increase above the resistance zone, outperforming bitcoin and ethereum.
The bulls were able to push the price above the resistance. A new yearly high was formed near .72 and the price is now consolidating gains. It is trading near the 23.6% Fib retracement level of the recent increase from the .98 swing low to .72 high.
Litecoin price is now trading above and the 100 simple moving average (4-hours). There is also a key bullish trend line forming with support near .50 on the 4-hours chart of the LTC/USD pair.
Source: LTCUSD on TradingView.com
On the upside, an immediate resistance is near the .75 level. The next major resistance is near the 0 level. If there is a clear break above the 0 resistance, the price could start a strong increase. In the stated case, the price is likely to continue higher towards the 8 and 5 levels. Any more gains might send ltc price towards the 0 resistance zone.
Dips Limited in LTC?
If Litecoin price fails to clear the 0 resistance level, there could be a downside correction. An initial support on the downside is near the .50 level.
The first major support is forming near the level or the 76.4% Fib retracement level of the recent increase from the .98 swing low to .72 high or the trend line. Any further losses may perhaps send the price towards the support.
Technical indicators:
4-hours MACD – The MACD is slowly losing pace in the bullish zone.
4-hours RSI (Relative Strength Index) – The RSI for LTC/USD is above the 50 level.
Major Support Levels – .50 followed by .00.
Major Resistance Levels – .75 and 0.00.
Axie Infinity Sales Record A Massive Slump, Losing Over $120 Million
Before now, Axie Infinity had maintained a solid foothold in the non-fungible token (NFT) space. Through massive sales, it stood as one of the leading and most successful NFT collectibles. The network had recorded almost .08 billion in sales volume. But June 2022 sales seem to be a mockery of its feats over the past year.
Sky Mavis, a Vietnamese studio, launched Axie Infinity in March 2018. It’s an online video game based on NFTs. The platform has gained popularity from using Ethereum-based tokens through its gaming economy. The gaming project runs on the Ronin blockchain.
Related Reading | Wall Street Investors Expect Bitcoin To Hit ,000, Is This Possible?
The whole crypto industry keeps receiving blows, topped by discouraging news such as Coinbase selling users’ Geo data, making people even more suspicious about the market, and the NFT space looks no different.
The platform centers on using Axies, the Pokemon-Esque creators. In the game, players could receive Axies, the virtual pets, and subsequently breed and raise them for future use. They serve as formidable tools in gaming battles for players. Once the players advance in their skills and levels, they would possibly get rewards.
The NFT collectible then witnessed a drastic drop in its June sales volume. The main influencing factor is the prevailing crypto bear market that has crippled the majority of activities in the industry. Hence, there is an overall reduction in NFT investment choices from different angles.
June’s record from the recent Research for Axie Infinity placed the sales volume at about .18 million. The value is a considerable gap between its May volume of about .09 million. Comparing the two months indicates that June’s volume declined by 55% from May’s sales volume.
A general review of NFT monthly sales volume in 2022 shows June’s sales as the lowest. Its drop marks the first time since Feb 2021 for Axie Infinity to get a monthly book lower than million. This is after the collectible recorded .67 million in Feb 2021.
Axie Infinity NFT Collectibles Record A Drop-In June Sales Volume
The negative trend is not just peculiar to Axie Infinity only. The NFT industry has June’s sales as the lowest for almost all collections. Some of them include Mutant Ape Yacht Club, CryptoPunks, Bored Ape Yacht Club, Moonbirds, NBA Top Shot, Meebits, and other collections that recorded low June sales volumes including Otherdeeds, Art Block, Azuki, etc.
Observing the reduced number of unique buyers for the Axie Infinity NFT in June 2022 shows more details about the drop. First, it explains the dip in transactions with the NFT collections. For June, its unique buyers were 52,507 with about 307,431 transactions.
However, the NFT collection had hit its monthly high in sales for 2022 in January. It recorded about 314,642 unique buyers with 1,296,870 transactions. Also, by the end of January, Axie Infinity had almost 6.49 million of sales volume. With its drop in June, the NFT collectible records a yearly low slump of 3.32 million from its January high.
Related Reading | Bitcoin Daily Exchange Net Flows Shows Sell-Offs Have Not Subsided
Also, Axie Infinity has an average sales value for both January and June to be .54 and .34, respectively. A comparison indicates a drop of about 89% between the months.
Daily chart shows 1% growth on the day chart | Source: AXSUSD on TradingView.com
Featured image from Pexels, charts from TradingView.com
NewsBTC
Celsius Beats Down Liquidation Price With $120 Million In Loan Repayments
Celsius has been at the center of most crypto controversies in the last month. The lending platform had had to pause withdrawals, transfers, and swaps on its platform, citing extreme market conditions as the reason, but that was only the beginning of its troubles. However, Celsius looks to be taking it on the chin because contrary to what others have done, the platform has made moves to pay down its debts and has now beaten down its liquidation price by more than 200%.
Celsius Pays 0 Million In Loans
The beginning of the week came with good news for the Celsius lending platform which had been able to put more money towards its loans. Previously, the company had added 7,000 BTC that had brought its liquidation price down to ,582 but remained at risk given the volatile nature of bitcoin. That is why the company has continued to add to its position to beat down the liquidation price to save the platform.
Related Reading | Mounting Support For Bitcoin At ,000 As Market Ushers In A New Week
Over the weekend, it was reported that Celsius had padded up its position once more, and in a series of repayments since July 1st, the lending platform has paid a cumulative 2.8 million. The latest of these payments had been the most prominent with the platform paying million in DAI stablecoin towards its loans. This payment had come hours after another significant repayment of million in DAI stablecoins.
As it stands, Celsius has managed to beat its liquidation price down to ,967, a more comfortable point for the lending protocol and its users who are still hoping to get back their coins that are now stuck on the platform. Celsius’s outstanding loans now sit at million with an overcollaterization ratio above 577%.
CEL token trading at .89 | Source: CELUSD on TradingView.com
Will Users Get Their Coins Back?
Celsius is yet to address users on if they will be getting their funds which are stuck on the platform back. There is a good portion of the market that has considered these coins lost, but with Celsius’ multiple loan repayments, it continues to spark hope in the hearts of investors that they would be able to one day withdraw assets again.
Related Reading | Active Ethereum Addresses Touch 2020 Levels, Will Price Follow?
Users have reported that the lending protocol has continued to pay rewards on their holdings despite not being able to withdraw. Its native token, CEL, had seen a significant run-up after suffering a terrible loss following the announcement of blocked withdrawals.
Its last communique with the public had been through a Medium post where the platform announced that it continues to work towards stabilizing liquidity and restoring operations. The blog post did not contain information about when it will be restoring withdrawal options. However, it did state that it continues “to take important steps to preserve and protect assets and explore options available to us.”
Featured image from Reuters, chart from TradingView.com
Follow Best Owie on Twitter for market insights, updates, and the occasional funny tweet…