 According to metrics, the prediction market Polymarket has experienced notable volume over the past few weeks, with the firm reporting it accrued over 0 million in June and .2 million on the day the 2024 presidential candidates Donald Trump and Joe Biden debated on stage. The Rising Influence of the Prediction Market Polymarket Polymarket has […]
Bitcoin News
Dogecoin Derivatives Volume Jumps 111% As Open Interest Spikes, But What About Price?
A number of Dogecoin metrics have turned bullish in the last few days, showing increased interest from investors. This ranges from the meme coin’s daily derivatives trading volumes to its open interest seeing a significant increase. However, in the midst of this, the Dogecoin price has remained limp, sparking worries among investors.
Dogecoin Derivatives Volume And Open Interest See Increase
One of the major Dogecoin metrics that has seen a significant increase recently is its derivatives trading volume. The trend began on Monday when the derivatives trading volume saw a 60% uptick. However, it seems DOGE traders are far from done as the volume has almost doubled since that time.
According to data from Coinglass, the Dogecoin derivatives trading volume is up 111% in the last day alone. This has pushed the derivatives trading volume to .85 billion, a significant increase from the .99 billion that was recorded on Monday.
The launch of Dogecoin futures contracts by Coinbase, the leading crypto exchange in the United States, may have something to do with this. Following the launch on April 1, 2024, the meme coin has seen increased interest in its derivatives products, which explains the increase in the volume.
However, the derivatives trading volume is not the only thing that has seen an uptick during this time. As Coinglass data shows, the Dogecoin open interest has also risen significantly during this time. It has seen an approximately 12% increase in the last day to touch above 0 million.
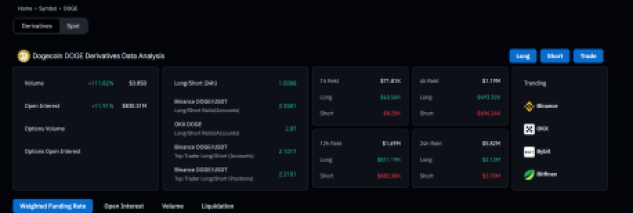
Despite this increase in the Dogecoin open interest, it is still a long way from its all-time high of .91 billion that was recorded on March 29. So, the current open interest of 0 million represents an over 50% decline from its all-time high. At the same time, the DOGE price is still struggling, showing a disconnect between the rise in metrics and the price of the meme coin.
DOGE Price Doesn’t Respond To Bullish Metrics
The Dogecoin price has remained muted during this time, even with the increased momentum. The total daily trading volume of the meme coin is up 128% in the last day. However, its price has barely moved 4%, even amid the meme coin craze sparked by the GameStop (GME) 100% rally.
DOGEs price has barely moved during this time and the resistance at .15 is waxing stronger. This suggests that the focus is no longer on Dogecoin during meme coin craze and rather on newer counterparts such as Solana-based GME and AMC, which have seen incredible rallies in the last day.
At the time of writing, the DOGE price is trending at .49, with a 3.48% increase in the last day. However, in the longer time frame, the meme coin is struggling with 5.79% and 4% losses on the weekly and monthly charts, respectively.
Polkadot (DOT) Circulating Market Cap Rockets To $8.3 Billion, Registers Massive 111% Growth
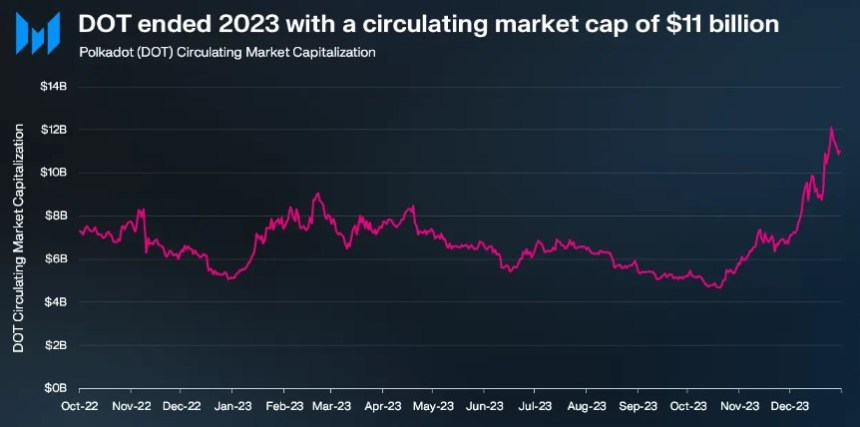
Polkadot, the computing platform known for its interoperability and scalability, has shown remarkable growth in key metrics during the latter part of 2023, as outlined in a recent report by Messari.
Outpacing Crypto Market Growth
According to Messari’s findings, Polkadot’s circulating market cap experienced a remarkable 111% quarter-on-quarter (QoQ) growth, reaching an impressive .38 billion.
This growth outpaced the overall crypto market’s growth of 54% during the same period. Furthermore, Polkadot’s year-on-year (YoY) change reached 94%, solidifying its position among the top 15 crypto projects by market capitalization.
In terms of revenue, Polkadot witnessed a substantial surge of 2,880% QoQ, generating .8 million in Q4 2023. This surge was primarily attributed to the significant rise in extrinsic, driven by the introduction of Polkadot Inscriptions.
Messari suggests that even excluding the four-day spike from the Inscriptions, Polkadot’s revenue would have doubled from the previous quarter. It is worth noting that Polkadot’s revenue tends to be relatively lower compared to its competitors due to the structural design of its network.
Polkadot Witnesses Significant Increase In Active Addresses
Following the launch of OpenGov – the governance module and framework within the network – in June, the Polkadot Relay Chain experienced a surge in account activity, largely due to increased governance participation.
Because the Relay Chain is critical in facilitating governance processes, it experienced a spike in active addresses on October 24, when users claimed their locked DOT tokens from the first batch of parachain auctions held two years earlier.
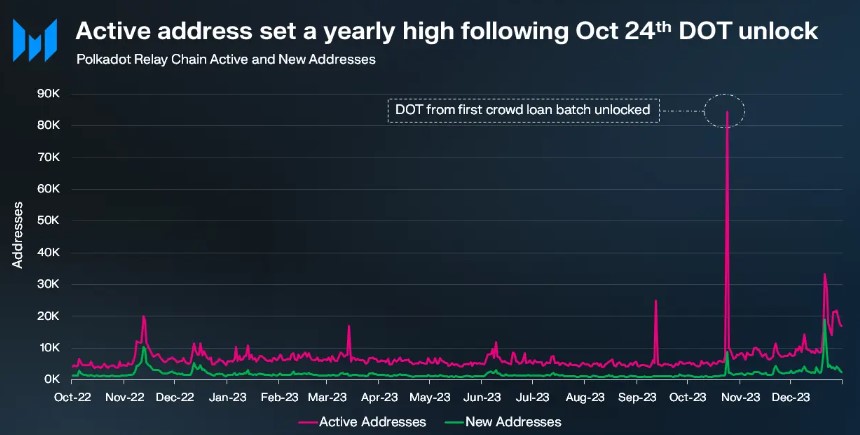
Throughout Q4, the Polkadot Relay Chain averaged over 10,000 daily active addresses, representing a substantial 90% QoQ increase. Excluding the October 24th activity related to DOT token claiming, the average number of active addresses still saw a significant 70% rise in QoQ, reaching 9,000.
Additionally, Cross-Chain Message (XCM) transfers on the platform increased by 150% QoQ, reaching an all-time high of 133,000. The total number of active XCM channels nearly tripled in 2023, reaching 203 by the end of the year.
According to Electric Capital’s rankings, Polkadot has 800 full-time and 2,100 total developers, making it one of the largest crypto ecosystems in developer participation.
DOT Price Shows Mixed Performance
Despite notable growth in key metrics demonstrating the network’s expansion, the price of Polkadot’s native token, DOT, has not followed suit and has even experienced declines over longer time frames despite positive developments.
Currently, DOT is trading at .7420, representing a slight 0.3% price increase in the past twenty-four hours, coupled with a 9% year-to-date gain.
However, over the past fourteen and thirty days, the token has recorded a 6% and 22% price drop, highlighting the absence of bullish momentum and catalysts that could propel DOT to higher levels.
Although it reached a 19-month high of .5711 on December 26, the subsequent price drop has led DOT to a critical juncture, potentially erasing its gains over the past year.
If the current level and its nearest support at .3229 fail to halt further price declines, DOT could potentially drop to the .4830 level, which serves as the next major support in the token’s 1-day chart.
Conversely, if DOT surpasses its upper resistance at .0392, the next objective would be to break the short-term downtrend structure, facing the .5332 resistance and another resistance at .1631. This would pave the way for another consolidation phase at its 19-month high.
Featured image from Shutterstock, chart from TradingView.com
Coinbase’s L2 Blockchain Base Skyrockets 111% in 41 Days, Overtaking Solana in TVL

According to statistics, Coinbase’s Layer two (L2) blockchain, built on Ethereum and using Optimism’s open-source OP Stack, has grown significantly in the past 41 days. Since August, when the platform had a total value locked (TVL) of 5 million, the figure has increased 111% to 0 million.
Layer Two Base Chain Sees Continued Growth
The L2 blockchain crafted by Coinbase is now the ninth-largest blockchain in terms of TVL by network. It has surpassed Solana in terms of TVL as defillama.com statistics show Base’s TVL is 0.29 million while Solana’s is 0.43 million.
Base is also above Cronos, Kava, Defichain, Bitcoin, Fusion, Pulsechain, and Cardano in terms of TVL size. Base’s value locked is around 0.96% of the .14 billion TVL across the entire decentralized finance (defi) ecosystem.
Data from Dune Analytics indicates that since the L2 launch, Base has bridged a total of 6.81 million, with 143,467 ether making up 54.4% or 2.19 million of that value. Approximately 115,993,548 USDC stablecoins have been bridged, accounting for 27.2% of the assets moved to Base.
Additionally, 25,276 CBETH, Coinbase’s wrapped ether derivative token, represented 10% of the total value bridged to Base over time. Other cryptocurrencies bridged include DAI, CRVUSD, THALES, and CRV.
There are 123 protocols on the Base L2 chain, and Base boasts about 61,319 active users. The decentralized exchange, Aerodrome, holds the distinction of having the largest total value locked on Base at 4.2 million.
Friend.tech follows with a total value locked of .08 million, while Stargate, present on 10 other unique blockchains, has .6 million. Curve Finance, which also operates on Base, reported a total value locked of approximately .6 million as of Sept. 21.
In the realm of non-fungible tokens, 177,717 Base users have minted a total of 58,970,276 NFTs to date. Dappradar metrics indicate that dapp volumes on Base have settled .33 billion in value since the L2’s inception.
What do you think about Base’s growth over the past 41 days? Share your thoughts and opinions about this subject in the comments section below.
Bitcoin (BTC) Is Parabolic, Prices Up 111% Year-To-Date
- Bitcoin (BTC) parabolic, adds 41.5 percent
- Strong Bitcoin fundamentals rewinding last year’s losses
The deteriorating global economy, prospect of central banks intervening, and the entry of whales through institutional investment could explain the parabolic rise of Bitcoin’s prices. At over ,800, BTC is up 41.5 percent in the last week and poised to register more gains.
Bitcoin Price Analysis
Fundamentals
Visibly, Bitcoin’s rally is stretching superlatives. Analysts say the recent price eruption has been dizzying. Well, true to their observations, this surge has everyone talking about Bitcoin. If anything, this is the necessary fuel for further price spikes as retail traders angle for gains. Spectacular as it is, explanations remain banal.
For whatever reasons, there are no concrete illustrations. Presently, speculation is rife that there are whales behind this price roll. Because of this superb jump, that could be one of the many reasons. After all, institutional grade investors are flocking in en masse.
By readjusting their portfolios and slotting in Bitcoin and other promising crypto assets, there is support of prices. Then again, global economic doldrums have traditional investors jittery. As observed, Bitcoin and gold prices are printing new highs and unexpectedly, fluctuating in synchrony.
If anything, this shows that investors have choices. Even so, Bitcoin, given their history of enormous volatility, is visible considering large price swings of the last few days. With a market cap exceeding 225 billion and trading around Feb 2018 highs, the sentiment is quickly shifting.
Since investors are optimistic, there is a feeling of “Fear of Missing Out” forcing speculators and holders to ramp up, even if buying bits of this scarce digital gold.
Candlestick Arrangement
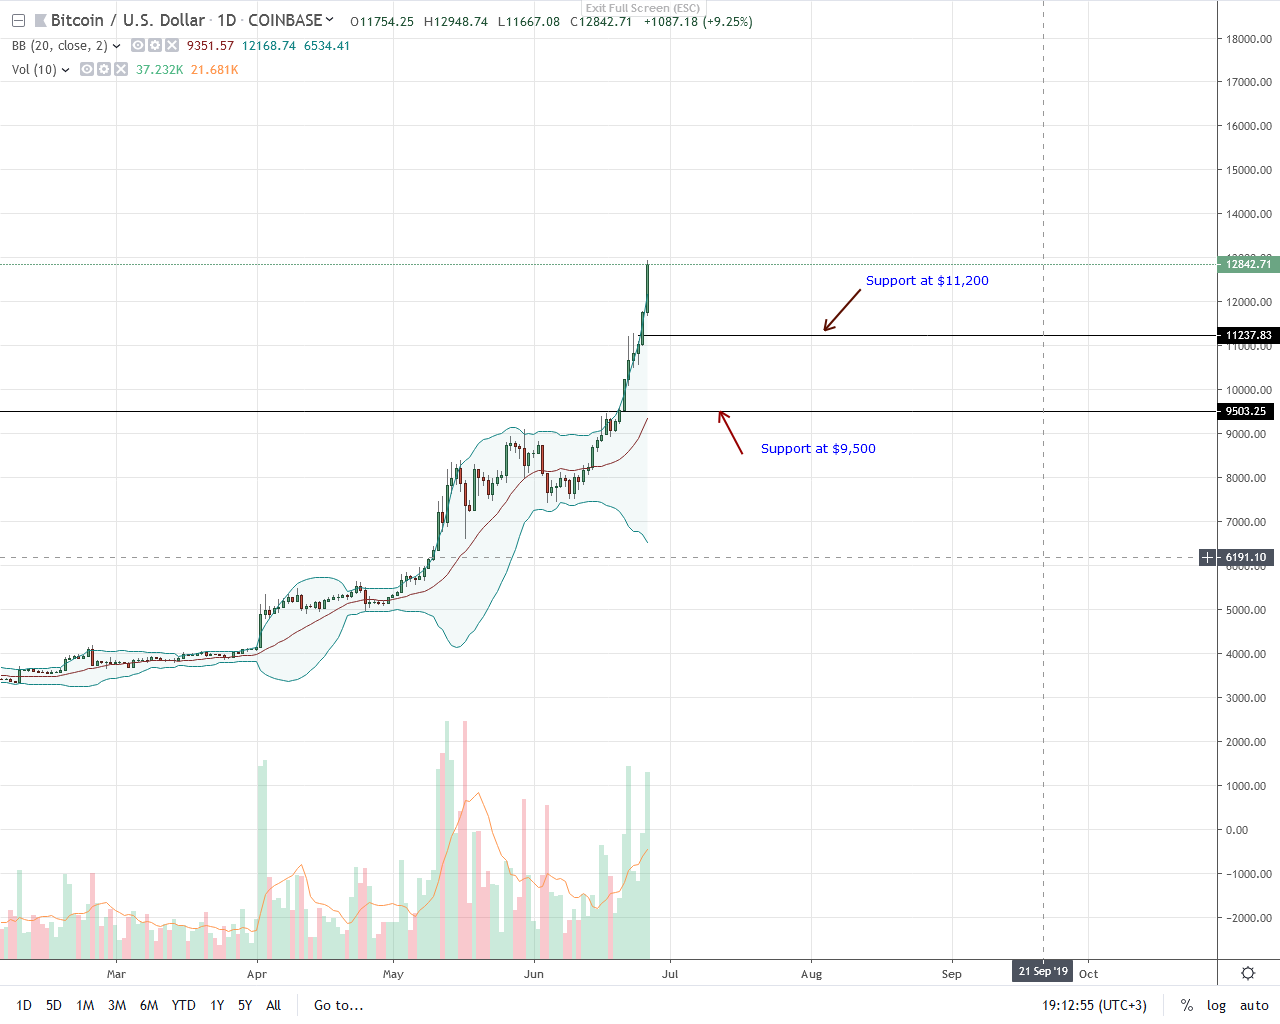
At the time of writing, Bitcoin is trading 41.48 percent higher from last week’s close. Retesting ,000, bulls are back with a vengeance. From this, there is a window for traders to buy the dips since BTC is within a bullish breakout pattern following the obliteration of ,000.
At this pace, odds are bulls will blast past ,000 satiating investors who held through last year’s biting winter. Although prices may cool off in a normal retracement from the upper Bollinger Band (BB), that will form the springboard for further price spikes.
If prices drop, allowing re-entry, possible supports will be at ,500 and ,200. From there, ideal targets will be at ,000 and later ,000.
Technical Indicators
Bitcoin’s price expansion is parabolic. Marking bulls are swelling trading volumes in the last week following the break out above ,000.
Chart courtesy of Trading View. Image Courtesy of Shutterstock
The post Bitcoin (BTC) Is Parabolic, Prices Up 111% Year-To-Date appeared first on NewsBTC.
Dutch Man Arrested for $111 Million Fake Mining Scheme
n nn nn On March 21, 2019, Dutch news outlet NL Times reported that Berry van M., a 33-year-old Dutch businessman and the operator of now-defunct trading platform Koinz Trading, has been arrested on charges of deceiving investors with a bogus bitcoin mining scheme.The report claims that van M. was the director of companies that sold computers for mining Bitcoin since 2017 and that he managed the computers in a so-called mining farm. He convinced investors that the
CryptScout #BitFeed RSS – Bitcoin and Cryptocurrency News 24/7