 Robert Kiyosaki advises selling bitcoin amid its crash, yet plans to buy more, likening his approach to Warren Buffett’s “buy and hold forever” strategy. Vivek Ramaswamy’s chances of becoming Trump’s vice presidential pick have surged by 1,100% on Polymarket. Ripple CEO Brad Garlinghouse criticizes SEC Chair Gary Gensler, warning his actions could affect the election. […]
Bitcoin News
Vivek Ramaswamy’s VP Prospects Spike 1,100% on Prediction Market Polymarket
 Following speculation that former President Donald Trump might select Republican Vivek Ramaswamy as his vice presidential candidate, Ramaswamy’s chances have significantly increased on prediction platforms like Polymarket. Over the last three days, his odds have jumped by 1,100%. Ramaswamy Gains Momentum in VP Stakes on Prediction Markets On Tuesday, the internet buzzed with ongoing speculation […]
Bitcoin News
Shiba Inu Price Could Skyrocket By 1,100%, Predicts Analyst
In an analysis, Moataz “Eljaboom” Elsayed, a crypto analyst and Forbes 40 under 40 nominee, has forecasted a significant surge in the value of Shiba Inu (SHIB). According to Elsayed, the meme-based cryptocurrency is poised for a potential increase that could see its value reach .00024, marking an unprecedented 1,105% gain from its current levels.
Shiba Inu Price Set To Skyrocket 1,100%?
In a review of SHIB’s price activity on the weekly chart (SHIB/USDT), Elsayed pinpointed a repeating pattern that initially occurred during the second quarter of 2021, shortly after Binance, a major crypto exchange, began trading SHIB. According to him, Shiba Inu’s historical data is exhibiting a pattern that, if repeated, will propel its price to new heights. He noted that the cryptocurrency experienced a notable rise to .00005 during the week of May 10, 2021, following its listing on Binance.
Elsayed’s analysis draws attention to a critical period in SHIB’s market behavior. After reaching a high of .00005, the token underwent a correction, settling below a pivotal support range of .00001784 to .00001995 for nearly 120 days. However, a subsequent breakout occurred in October 2021 as the broader bull market gained momentum, catapulting SHIB by 343.64% from its support level to a peak of .00008854.
History Is Repeating Itself
#SHIB pic.twitter.com/zeeXVWhpKZ
— Elja (@Eljaboom) June 8, 2024
The subsequent correction and entry into a bear market, exacerbated by the collapse of the Terra ecosystem in May 2022, saw SHIB prices fall below key support levels. It remained subdued under these levels for 658 days, struggling to surpass the .00001 mark. Yet, a resurgence in March of this year saw SHIB soar by more than 370% to a yearly high of .00004567.
Building on this data, Elsayed anticipates a similar, if not more pronounced, trajectory for SHIB in the near future. He estimates that this next breakout could propel SHIB’s price to .0002404, effectively increasing its market capitalization to 1.6 billion. Given the cyclical nature of the crypto market, such could be on the cards, according to the crypto analyst.
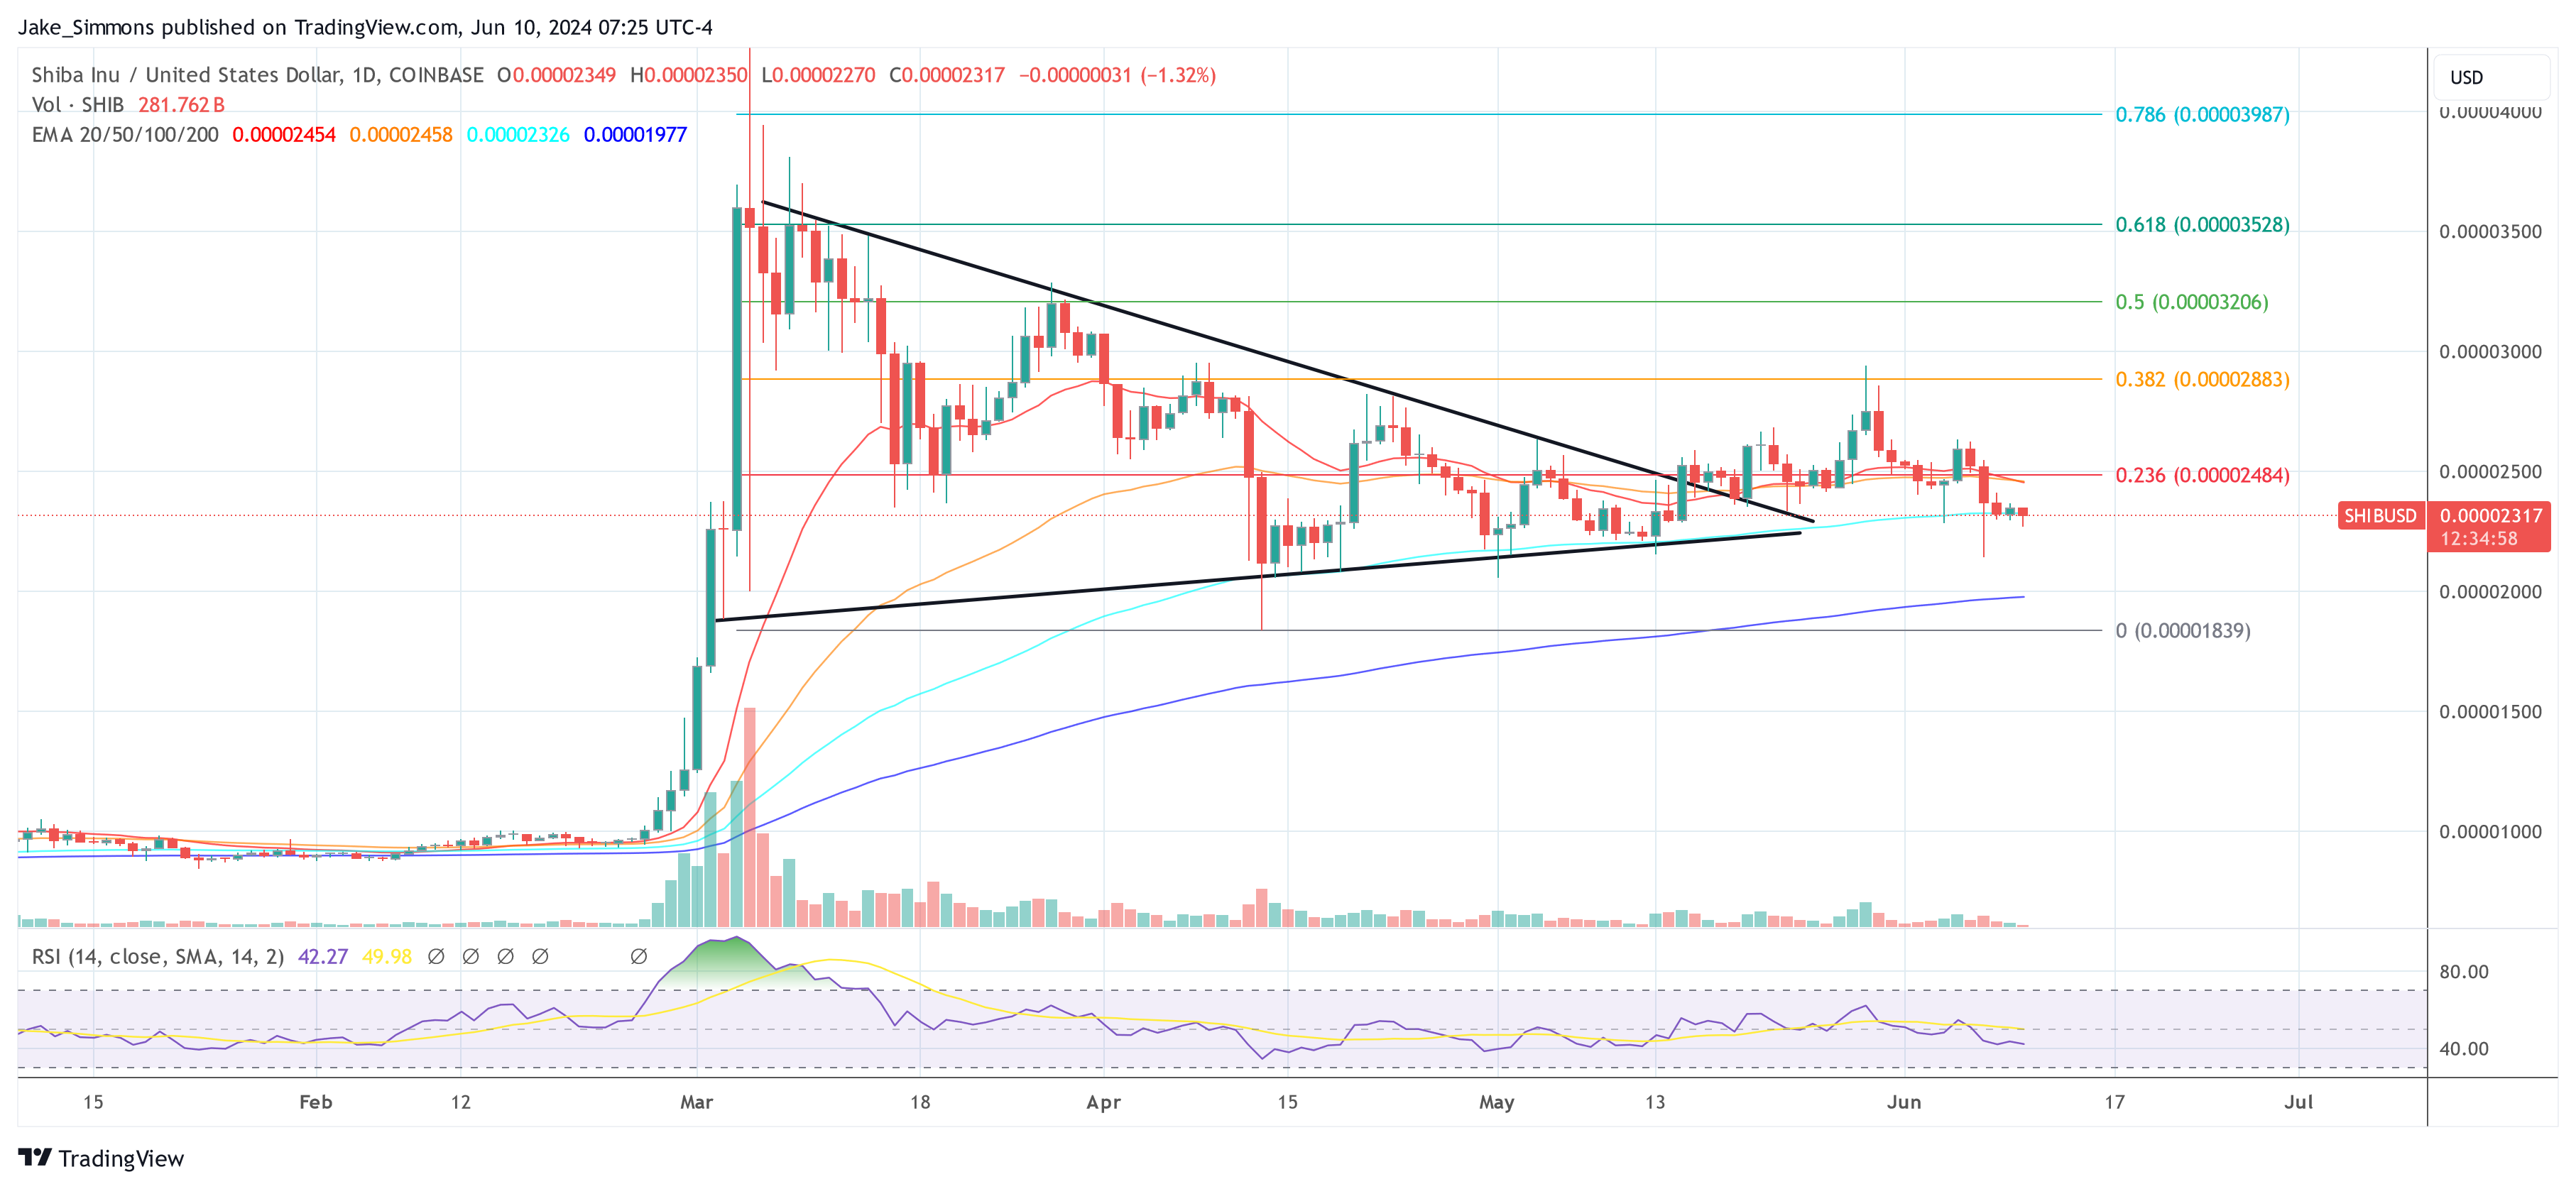
In the daily SHIB/USD chart, Shiba Inu’s price is currently in a consolidation phase, following a significant rally to this year’s high in early March. Despite breaking out of a symmetrical triangle pattern in mid-May, SHIB failed to sustain a close above the 0.382 Fibonacci retracement level of .00002883.
Subsequent to this rejection, the price fell below the 0.236 Fibonacci level and is now struggling to establish support at the 100-day Exponential Moving Average (EMA). Maintaining a daily close above .00002326 is critical to prevent a potential further decline towards the 200-day EMA at .00001977.
Analyst Who Predicted Solana’s 1,100% Move Reveals Where The Altcoin Is Headed Next
Crypto analyst Javon Marks has provided insights into the future trajectory of Solana (SOL) after it hit a 1,100% return. The analyst is known to have called the crypto token’s previous high correctly, which is one reason his latest prediction is worth keeping an eye on.
Solana Could Rise To As High As 3
Marks mentioned in an X (formerly Twitter) post that despite its recent pullback, Solana’s price may be getting ready for another price rally. He noted that a move of over 54% may already be in the pipeline and that such a price move could open up room for another run of over 93%, which would send Solana to 3.
Related Reading: Cardano Ready For 15x Move, Crypto Analyst Reveals The Major Drivers

Marks predicted last year that Solana would climb above 0, which it eventually did this year, peaking at a year-to-date (YTD) high of 2. Although the crypto token has dropped significantly from that price level, Marks’ recent prediction confirms that Solana’s run isn’t done yet and will still surpass its current all-time high (ATH) of 0.
Solana rising to 3 looks more feasible considering that crypto analysts like Altcoin Sherpa have predicted that the crypto token could rise above 0 by year-end. Crypto analyst Hansolar also predicted that Solana could climb to 0 in this market cycle. Meanwhile, Crypto YouTuber Jake Gagain predicted that Solana will rise to 0, although he mentioned that it will likely happen in 2025.
SOL Could Become The Third-Largest Crypto Token
Solana’s rise to as high as 0 could lead to the crypto token becoming the third largest crypto asset by market cap, only behind Bitcoin and Ethereum. This is possible, as a rise to 0 is almost double Solana’s current ATH. Crypto analyst Chris O also previously predicted that this would likely happen as he predicted Solana and ADA would battle for the position.
Meanwhile, asset manager Franklin Templeton also sounded confident in Solana’s potential to become the third-largest cryptocurrency. In a recent analysis, the asset manager highlighted the factors that could lead to this development. One is Solana’s technology, which they think will be perfect for the sectors that will drive the next wave of crypto adoption.
Franklin Templeton also alluded to the upcoming airdrops on the Solana network, which could bring more liquidity into the ecosystem and possibly cause a surge in Solana’s price, just like when the Jito and Pyth airdrops occurred. The asset manager also noted that meme coin activity on the network isn’t slowing, which could contribute to Solana’s rise to becoming the third-largest cryptocurrency.
Solana has become the foremost network for trading meme coins, which has led to an influx of new investors into the ecosystem. Therefore, a sustained network expansion will likely reflect positively on Solana’s price sooner or later.
At the time of writing, Solana is trading at around 4, up in the last 24 hours, according to data from CoinMarketCap.
XRP Price Set To Skyrocket 1,100% On This Signal: Crypto Analyst
In crypto trading, history often repeats itself, or at least rhymes. That’s why it can be crucial to spot historically important price signals and patterns. A recent technical analysis by Egrag Crypto has spotlighted such a pattern for XRP, indicating a possible massive price increase.
This analysis hinges on the observation of a bullish crossover between the 21 Exponential Moving Average (21 EMA) and the 55 Moving Average (55 MA) in the 2-week chart of XRP/USD. Egrag states, “XRP Rockets: 21 EMA & 55 MA Signal Explosion: Let’s decode the XRP trajectory – my focus? Just two pivotal weekly candles after the crossover between 21 EMA & 55MA.”
Will The XRP Price Soar To ?
The chart provided by Egrag Crypto highlights the XRP price movements in the two distinct scenarios when this rare bullish signal occurred. The first bullish crossover of the 21 EMA and 55 MA in the 2-week chart occurred in March 2017 (scenario A). Following this signal, the XRP price saw “two striking 2-week candles. The initial one surged by around 90%, trailed by an electrifying 1100% spike,” Egrag remarked.
For the second time in the history of the XRP price, the signal flashed at the end of December 2020. This time, the XRP rose by 100% in the first candle, succeeded by an 84% surge in the second 2-week candle which marked a collective 200% upswing.
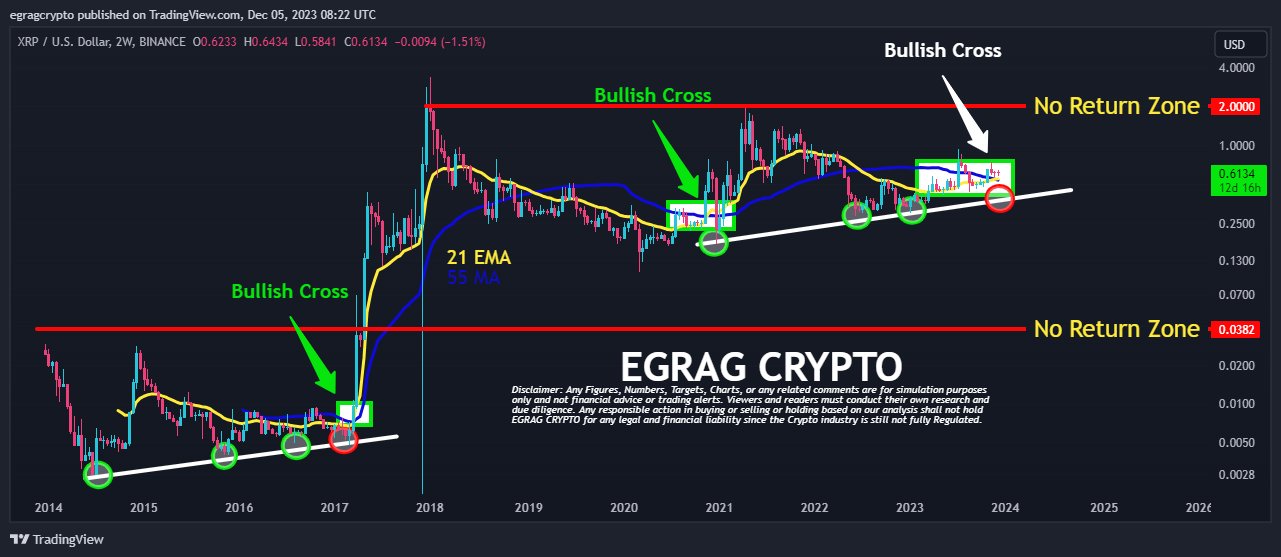
According to the crypto analyst, there’s a high probability that these scenarios will repeat themselves. “Drawing parallels from past bullish runs, my opinion syncs with historical data,” Egrag remarked.
Notably, the chart of Egrag also features an ascending trend line, a bullish indicator, which XRP has tested twice, as shown by the two green circles in mid-2022 and early 2023. These taps on the trend line are critical, as they suggest that each touch is a test of support where the price finds enough buyers to begin a new upward movement.
The analyst speculates that XRP could dip slightly more to tap the ascending trend line a third time, which could be a precursor to a significant price rally. This potential third tap on the trend line is viewed as a buying opportunity that could precede a considerable price surge.
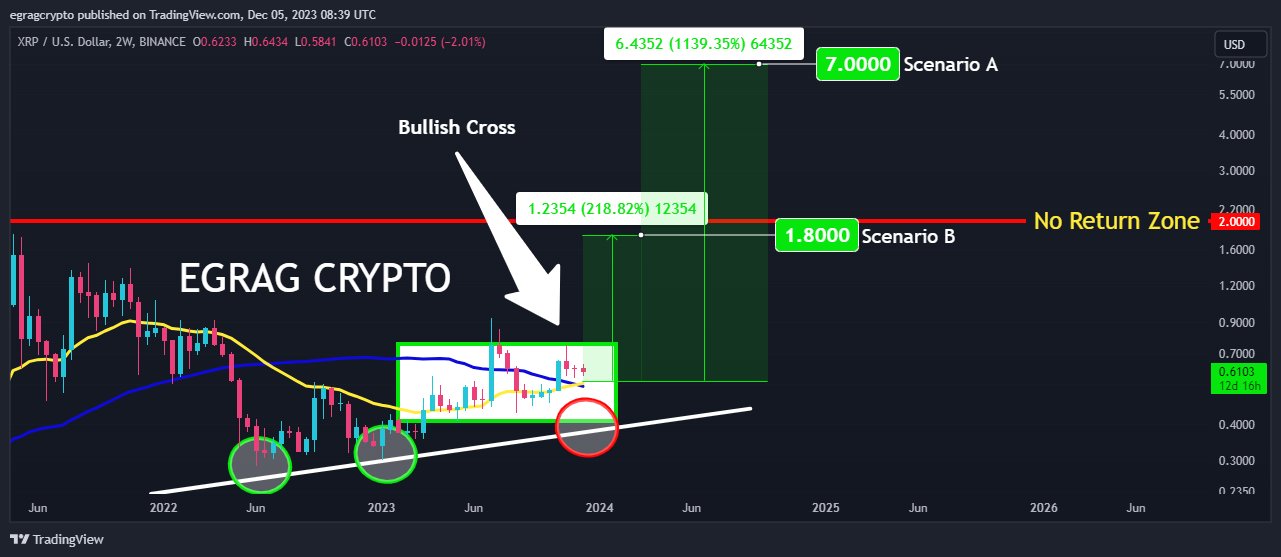
Following this third retest of the trend line, Egrag expects two possible scenarios based on the bullish crossover of the 21 EMA and 55 MA. In scenario A, the crypto analyst envisions a dramatic rise in the XRP price, projecting a target of .00, which would represent a staggering increase of 1,139.35% from the current price.
Scenario B suggests a more conservative target of .80, which would still be an impressive gain of 218.82%. The “No Return Zone,” marked in red at the .80 level, is set just above scenario B’s target. It indicates a critical threshold that could either act as a resistance zone or confirm a strong bullish momentum if the price sustains above it.
Broader Market Forces
The crypto analyst is also aware that the Bitcoin price traditionally plays a major role for altcoins such as XRP. He therefore notes on the current market conditions, “eyes fixed on BTC as the majority anticipates a K-K peak, potentially followed by a pullback, igniting a widespread alt season. Yet, what’s intriguing? A scenario where BTC skyrockets to ATH, retraces, and unleashes a truly wild alt season.”
The analyst’s perspective leans towards an initial spike to between to , followed by a significant retracement, and then an even more substantial rise to the levels of to . On being queried about the extent of the expected retracement from the – range, Egrag Crypto answered an “aggressive .3-1.5” drawdown.
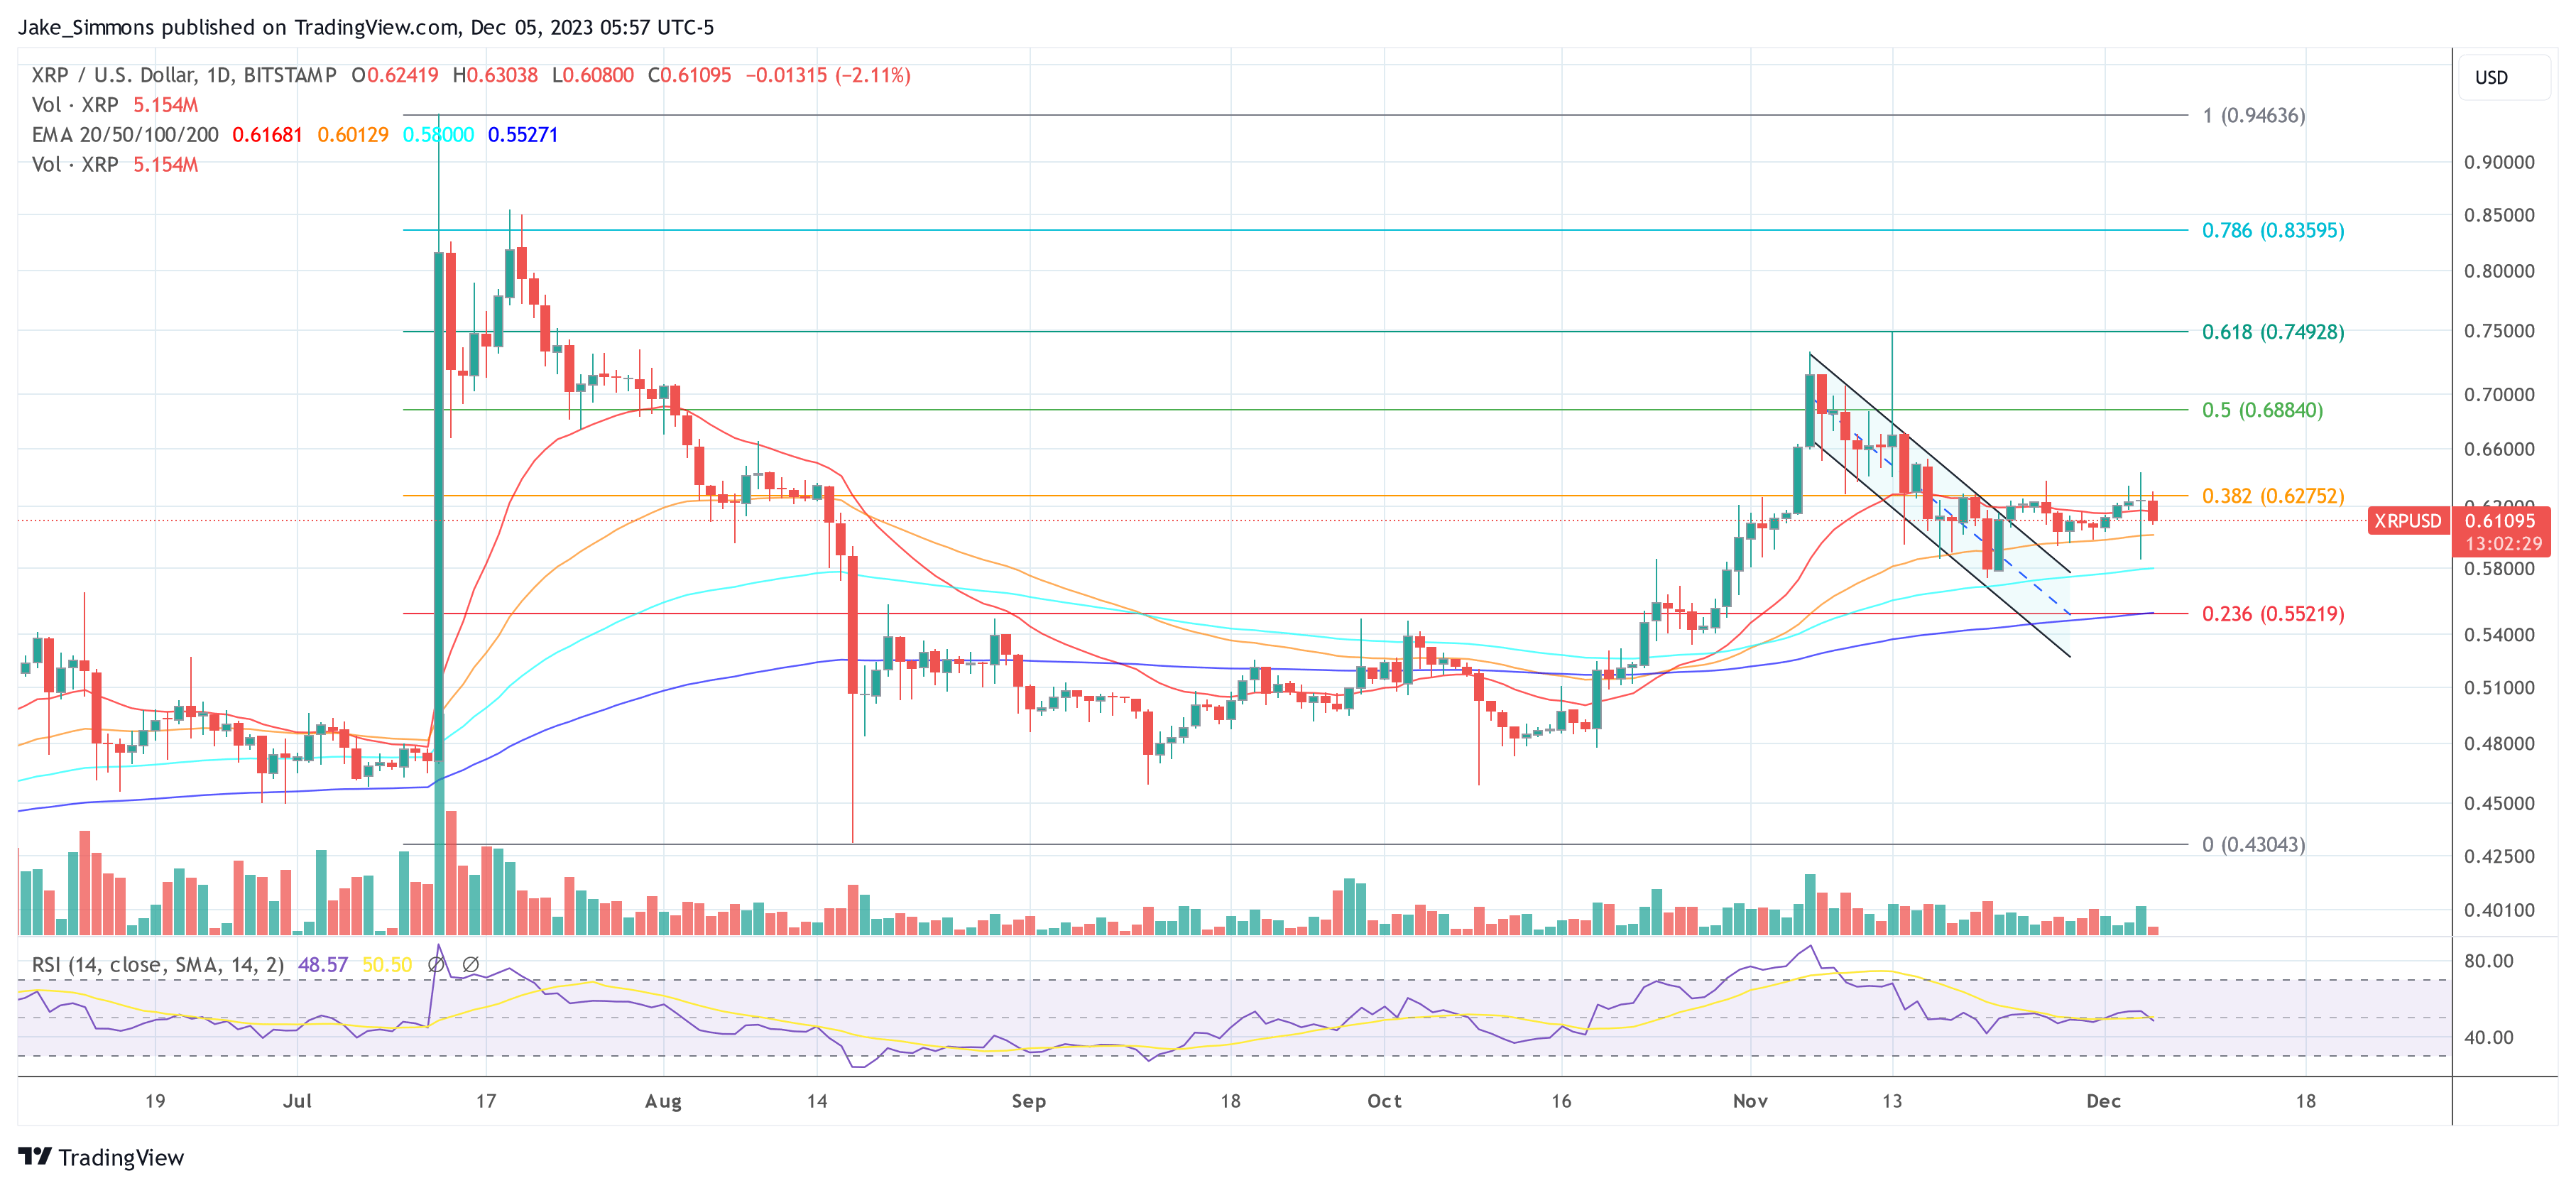
At press time, XRP traded at .61095.
SHIB Burn Rate Jump 1,100% Amid Expectations Of Shibarium Relaunch
Off the back of the much-anticipated Shibarium launch, the SHIB burn rate has seen a tremendous rise. This surge in the burn rate comes despite the Layer 2 blockchain running into problems on the day of its launch last week, and still being in private mode. But while it could point to renewed vigor among the meme coin’s investors, something else seems to be driving this accelerated burn rate.
SHIB Burn Rate Is Up 1,108% In One Day
According to data from Shiba Inu burn tracking website Shibburn, there has been a remarkable increase in burn rate in the last 24 hours compared to the prior day. In total, there have been over 1.046 billion tokens burned, which translates to a 1,108.78% increase during this timeframe.
This is in stark contrast to the previous day’s figures which came out at around 100 million tokens burned. However, while the jump in burn rate is interesting, the address doing most of the SHIB burn is even more interesting.
Looking at the burn addresses posted by Shibburn, one address keeps popping up and that is the 0x4be2 address. A quick look on-chain revealed that this address is actually the contract address for the MARSWAP (MSWAP) token.
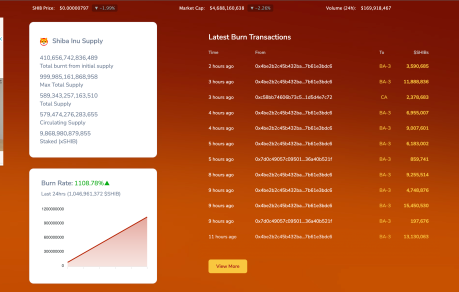
This token seems to dedicate a portion of fees generated from transactions toward SHIB burn and as it gains popularity, the number of SHIB tokens being burned has jumped. So far, Marswap accounts for about 40% of burnt tokens. But a single address, 0xcf6d, which is the ShibaSwap LP Token (SSLP) contract address, burned 418,719,732 tokens in what has been the single largest burn event in the last day.
How Is The Token Price Responding?
Despite the marked increase in the SHIB burn rate, the price of the meme coin has not responded as positively as expected. The token price seems to be keeping in line with the general crypto market sentiment and continues to trade in the red.
Although there has been a small shift in the last hour at the time of this writing, with SHIB’s price moving up a meager 0.16%, its price is still taking losses of 1.48% on the daily chart. Even more concerning is its significant loss of 21.94% on the weekly chart. Given this trend, it is unlikely that SHIB will make a break from the market and rally. Rather, a recovery from here will follow a Bitcoin rise.
However, one event that could trigger a recovery is the Shibarium relaunch. According to lead developer Shytoshi Kusama, the layer 2 network could be gearing up for a relaunch in the coming days.
Ethereum Price Signals Bearish Moves, Test of $1,100 Seems Possible
Ethereum is still showing bearish signs below the ,200 zone against the US Dollar. ETH could continue to move down below the ,180 support zone.
- Ethereum is attempting a minor upside correction towards the ,200 barrier.
- The price is now trading below ,200 and the 100 hourly simple moving average.
- There was a break above a key bearish trend line with resistance near ,195 on the hourly chart of ETH/USD (data feed via Kraken).
- The pair remains at a risk of a larger decline towards the ,100 level or even ,000.
Ethereum Price Struggles
Ethereum price remained stable near the ,180 level. ETH formed a base and started a minor upside correction from ,180, similar to bitcoin.
The price was able to climb above the ,185 and ,190 levels. There was a break above a key bearish trend line with resistance near ,195 on the hourly chart of ETH/USD. The pair even climbed above the 23.6% Fib retracement level of the key decline from the ,232 swing high to ,180 low.
However, the bears are active below the ,220 level. Ether price is now trading below ,200 and the 100 hourly simple moving average.
An immediate resistance is near the ,205 level and the 100 hourly SMA. It is near the 50% Fib retracement level of the key decline from the ,232 swing high to ,180 low. The next major resistance is near the ,212 level. The first major resistance is near ,230.
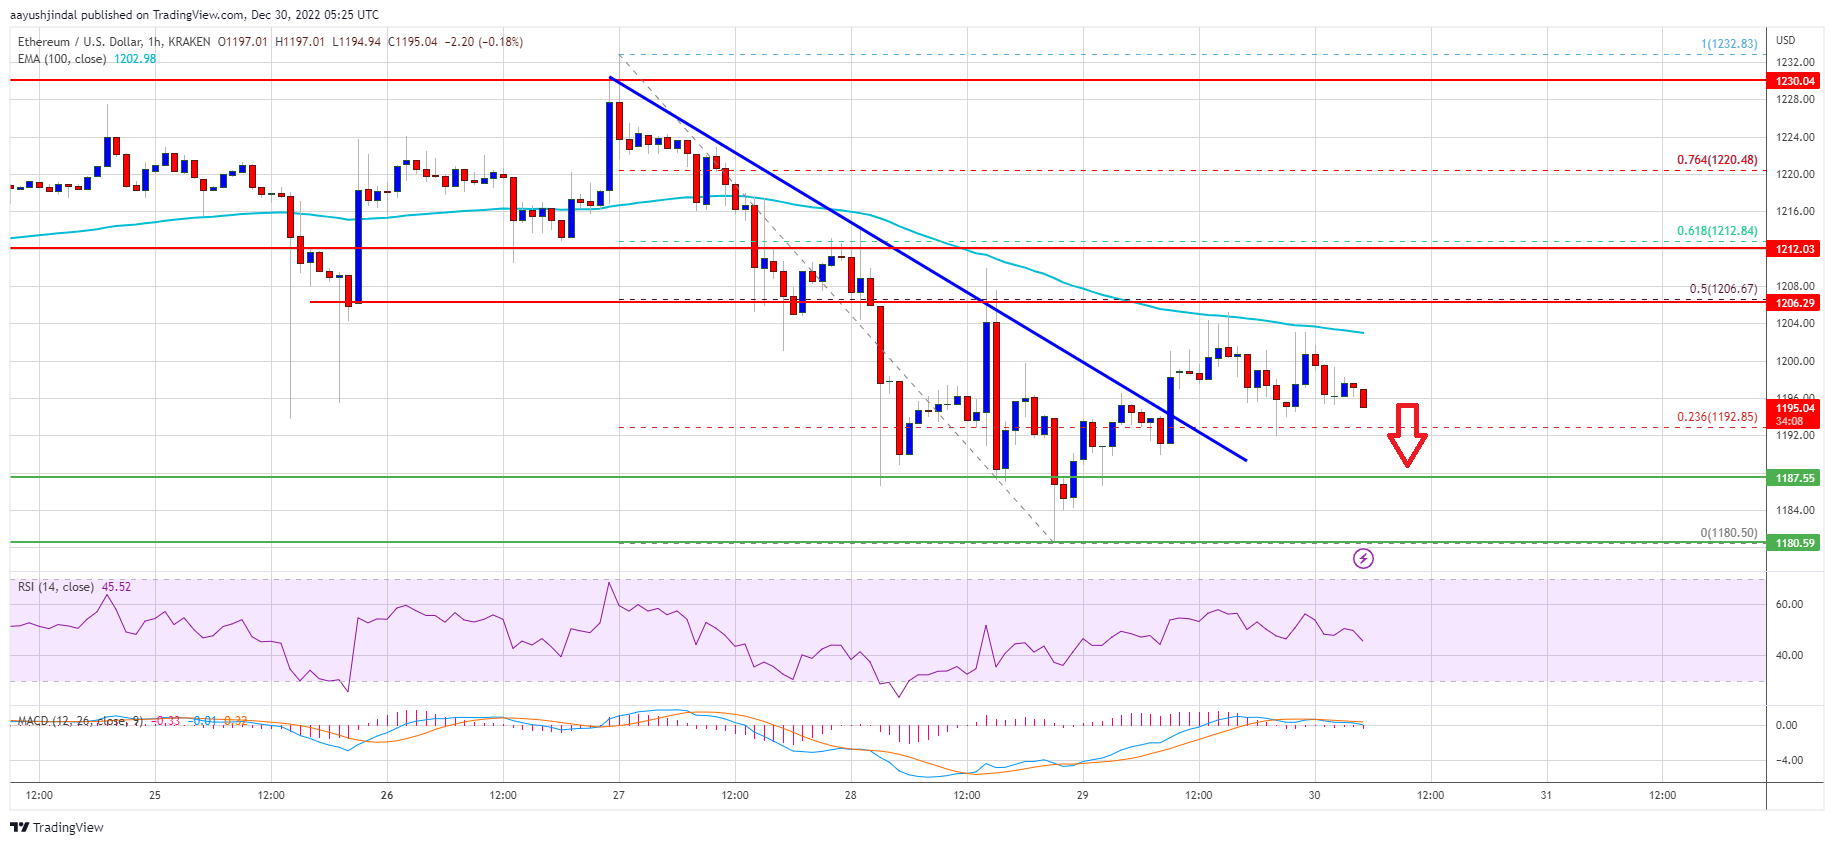
Source: ETHUSD on TradingView.com
A close above the ,230 resistance could start a decent upward move. In the stated case, the price may perhaps rise towards the ,250 resistance. The next major resistance could be ,265, above which the price might rise towards the ,300 resistance zone.
Fresh Decline in ETH?
If ethereum fails to climb above the ,220 resistance, it could start another drop. An initial support on the downside is near the ,188 level.
The next major support is near the ,180 level. A downside break below ,180 might send the price towards the ,120 support. Any more losses might call for a test of the ,100 zone.
Technical Indicators
Hourly MACD – The MACD for ETH/USD is now gaining momentum in the bearish zone.
Hourly RSI – The RSI for ETH/USD is now below the 50 level.
Major Support Level – ,180
Major Resistance Level – ,220
Ethereum Bounces Off $1,100 But Not In A Safe Zone; Here Is Why
- ETH’s price reclaims its demand zone of ,200 as price bounces to a region of ,250 despite market turmoil.
- ETH’s price continues to show strength after a bearish downtrend with the market’s current state, as things look uncertain for most traders and investors.
- ETH’s price bounces from a low of ,100 on the daily timeframes as the price aims for a recovery toward the 50 Exponential Moving Average (EMA)
In the last few days, the crypto market has seen some drastic shift in sentiment, with Ethereum (ETH) and the price of other altcoins battling for survival after the news that Binance would not be taking over FTX after conducting due diligence. Previous weeks saw the price of Ethereum (ETH) perform well, rallying from a low of ,300 to a high of ,680. Most altcoins trend higher as many produced gains of over 200%, including DOGE rallying from a region of .55 to a high of .15, with many hoping for more recovery bounce. Still, these expectations were cut short by the uncertainty surrounding the crypto market, leading to much fear about where the market is headed. (Data from Binance)
Ethereum (ETH) Price Analysis On The Weekly Chart
The past few days have been filled with so much turbulence in the crypto space as many altcoins have struggled to show strength after losing their key support holding off price decline.
The current uncertainty surrounding the market has resulted in reluctance on the part of traders and investors to make altcoin purchases, as there is no assurance if they would be heading up any time soon.
The news of Binance rescuing the situation by taking over FTX led to so much tension as the crypto space remains unsettled, leading to most altcoins suffering in price, including the price of ETH.
The price of ETH saw its price decline to a weekly low of ,100 before bouncing off this region, showing some great strength to a region of ,300 as the price aims to break higher. The price of ETH needs to rally to a region of ,450, acting as a demand zone to remain safe from sell-off.
Weekly resistance for the price of ETH – ,500.
Weekly support for the price of ETH – ,100.
Price Analysis Of ETH On The Daily (1D) Chart

The price of ETH remains considerably strong in the daily timeframe as the price trades above ,200 support after bouncing off from the region of ,100, which saw ETH losing its demand zone to the bears.
If the price of ETH breaks above ,500, we could see more rallies for ETH price; a break below a region of ,100 would lead to more sell-offs for ETH.
Daily resistance for the ETH price – ,500.
Daily support for the ETH price – ,100.
Featured Image From zipmex, Charts From Tradingview
NewsBTC
Core Scientific Confirms selling 1,100 Bitcoin In August, What Was Its Impact?
While the current quarter in the crypto market has been bad for many companies as Bitcoin dropped, it has been successful for some. Core Scientific has proven that market lows can be beneficial if the right opportunity is identified.
The U.S-based crypto mining company produced 1,334 BTC in August and sold over 1,125 Bitcoin for .9 million in approximate.
According to Core Scientific’s August Production and Operational updates, it operated 25,451 ASIC servers for colocation and self-mining. Also, data shows that the hash rate produced was about 21.54EH/s (hash rate per second).
Core Scientific confirmed that August was a highly successful one for the firm. It increased its self-mining hashrate by utilizing thousands of new ASIC servers.
Core Scientific Mints 1,334 Bitcoin via 17,000 New Servers
The firm’s CEO, Mike Levitt, said that their total hashrate and self-mining hashrate are the largest operating capacity of any listed company in North America.
The firm revealed that it deployed about 17,000 new ASIC servers in August. The massive deployment resulted in the generation of 1,334 Bitcoin. The company stated its plan to deploy 43,000 ASIC servers before the end of 2022.
In August, Core Scientific got about million by selling 1,125 BTC at an average price of ,014 per coin. By the end of August, it held 1,409 BTC, which is approximately million at today’s market price and approximately .2 million in cash.
Core Scientific is among the biggest publicly traded blockchain computing data center providers and miners of digital assets in North America. The company has operated blockchain computing data centers since 2017. It uses its facilities and intellectual property portfolio for collocated digital asset mining and self-mining.
To enter the National Association of Securities Dealers Automated Quotation (NASDAQ), it struck a .3 billion SPAC (Special Purpose Acquisition Company) deal with Power and Digital Infrastructure Acquisition Corp.
CORZ shares Drop By 85% During The Bear Market
In 2021 when Core Scientific joined the global online marketplace, its stocks (CORZ) were around . Recently, because of the bear market, the stock value dropped. According to Yahoo Finance, the CORZ shares were trading at .32 but went down to .09 on November 15.
The decline of more than 85% in the CORZ shares followed the Bitcoin 70% price decline. Following the price chart, Bitcoin price went down from .557 on November 15, 2021, to ,767.
Bitcoin trades in the green zone l Source: BTCUSDT on TradingView.com
In August, Core Scientific reportedly severely powered down Texas and other data center operations. This reduced the August energy grid to 11,057 megawatts hours.
The Company’s data center facilities in Georgia, Kentucky, North Carolina, and North Dakota still operate at full capacity. It is still building additional capacity in Texas.
Featured image from Pixabay, charts TradingView.com
NewsBTC
Ethereum Breaches $1,600, How Soon Will Touch $1,100?
Ethereum has fallen below its ,600 support level and has displayed bearish sentiment on the chart. Broader market weakness has also contributed to Ethereum’s current price action.
Bitcoin had fallen to the ,000 price mark and altcoins depicted similar price movements.
Ethereum over the last 24 hours depicted some minor appreciation on the chart. The altcoin’s technical outlook remained bearish.
Buying strength had fallen over the past two days and at press time the coin ‘s movement was dominated by sellers.
Continued selling pressure can pull ETH to the ,100 price level before it starts to pick up momentum again.
In case the bulls find their way back into the market, ETH might continue to consolidate on its chart and then try to rise.
Buying strength also has to recover significantly for Ethereum to invalidate the bearish thesis. Over the last week, Ethereum lost 4% of its market value.
Ethereum Price Analysis: Four Hour Chart
Ethereum was priced at 72 on the four hour chart | Source: ETHUSD on TradingView
ETH was exchanging hands at 72 at the time of writing. After Ethereum witnessed a sharp fall, it tried to recover slowly but bearish pressure was still strong in the market.
Overhead resistance for the altcoin was at ,542 and a current fall in price will drag ETH to ,260.
For bearish thesis to be negated Ethereum has to trade above the ,600 price mark for longer than a few trading sessions. If buying strength doesn’t display consistency then Ethereum can fall to ,100 in just a matter of time.
The volume of ETH traded in the last session rose which indicated that buying strength struggled to move north on the chart.
Technical Analysis
Ethereum pictured recovery in buying strength on the four hour chart | Source: ETHUSD on TradingView
The altcoin over the last 24 hours registered some increase in price, although technical outlook was bearish, buying strength tried to recover.
The Relative Strength Index was below the half-line but over the last trading sessions, there was an uptick in the indicator.
This meant that buying strength was recovering on the four hour chart.
Despite the recovery, the price of the altcoin was below the 20-SMA line, a reading below the 20-SMA line points towards sellers driving the price momentum in the market.
Related Reading | Shiba Inu Whales Trading Volume Surges 640% As SHIB Holds Critical Support
Ethereum displayed sell signal on the four hour chart | Source: ETHUSD on TradingView
The fall in price can be directly tied to a sell signal. The Moving Average Convergence Divergence depicts price momentum and reversals in the same.
MACD underwent a bearish crossover and flashed red signal bars which are tied to sell signal for the coin.
Directional Movement Index presents price direction and where the coin is headed next. DMI was negative as the -DI line was above the +DI line.
The Average Directional Index (Red) was below the 20 mark which meant that the current price action was losing steam.
Related Reading | TA: Ethereum Recovery Faces Major Hurdle, Risk of Fresh Decline Exits
Featured image from UnSplash, chart from TradingView.com
NewsBTC