 Curve DAO’s (CRV) price increased over 10% early Wednesday, hitting .35 and marking a 41% increase from its low since a recent liquidation crisis involving its founder. On-chain data revealed significant accumulation of CRV by whales this week, with reports indicating a particular increase in purchasing during the post-liquidation price dip. This resurgence in CRV’s […]
Bitcoin News
ADA Price Prediction – 10% Surge In Two Days, Bulls Aim For $0.35
Cardano (ADA) started a fresh increase above the .30 resistance. ADA is outperforming Bitcoin and might aim for a move toward the .35 resistance.
- ADA price regained strength for a move above the .265 and .280 levels against the US dollar.
- The price is trading above .30 and the 100 simple moving average (4 hours).
- There is a key bullish trend line forming with support near .3050 on the 4-hour chart of the ADA/USD pair (data source from Kraken).
- The pair must stay above the .308 support to start a fresh increase in the near term.
Cardano Price Regains Strength
After a couple of swing moves, Cardano was able to gain strength for a move above the .28 resistance. It rallied above the .30 resistance to move further into a positive zone. It is up over 10% in two days, outperforming Bitcoin and Ethereum.
A new multi-week high is formed near .3295 and the price is now consolidating gains. There was a minor correction below the 23.6% Fib retracement level of the upward move from the .2847 swing low to the .3295 high.
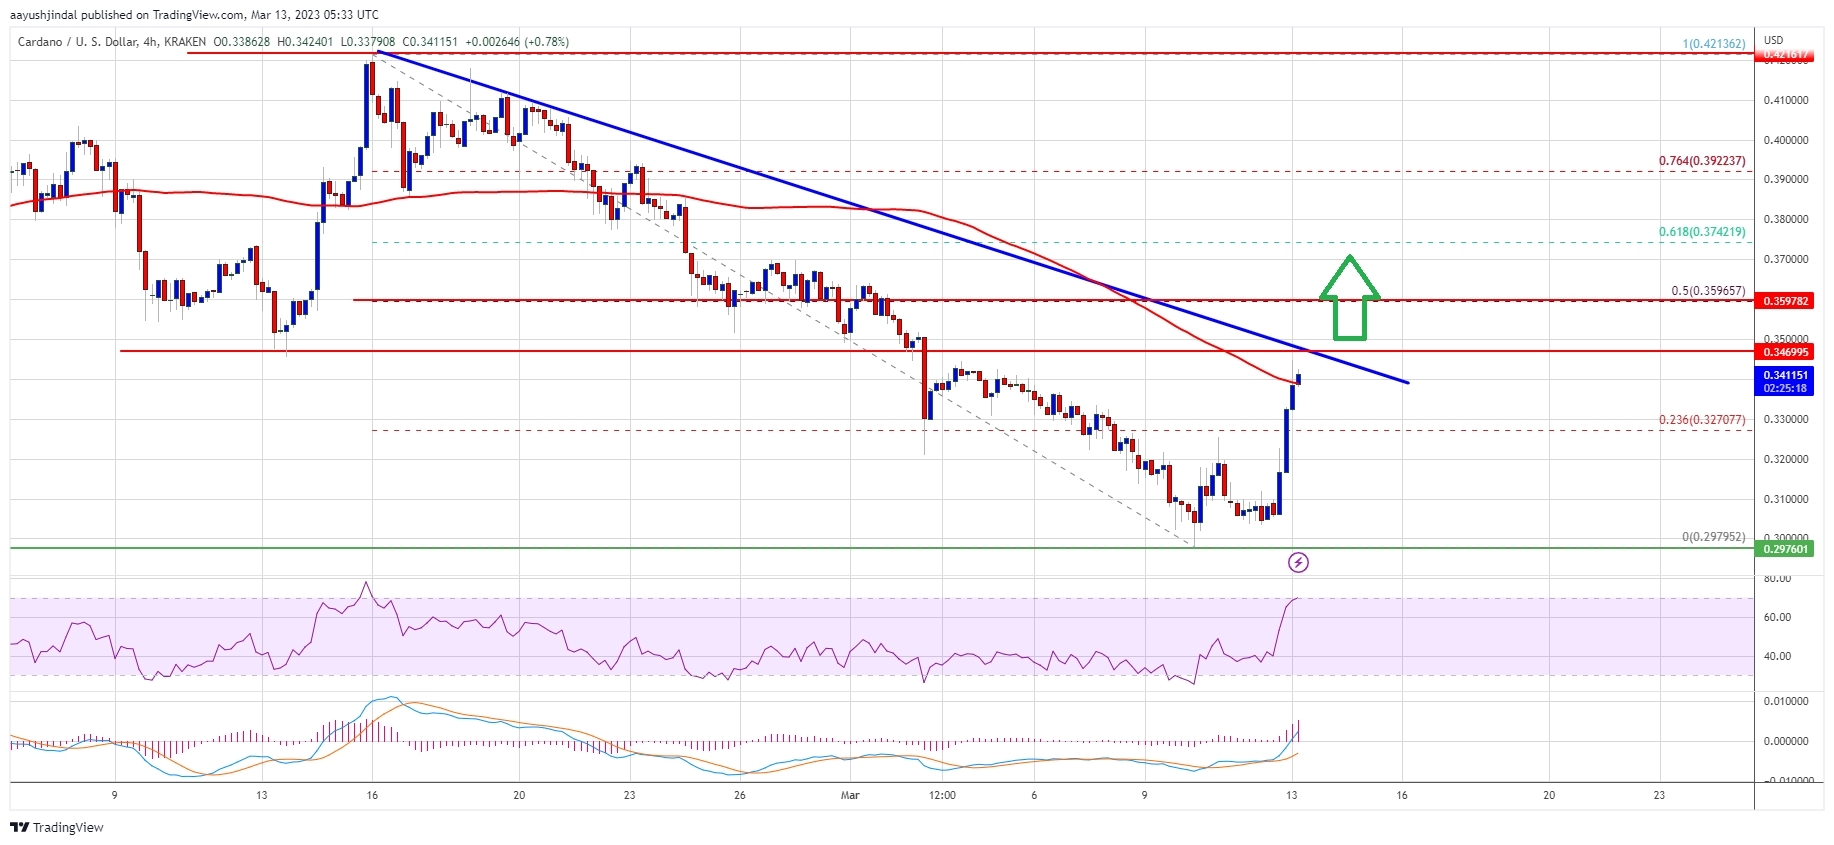
ADA is now trading above .30 and the 100 simple moving average (4 hours). There is also a key bullish trend line forming with support near .3050 on the 4-hour chart of the ADA/USD pair. The trend line is close to the 50% Fib retracement level of the upward move from the .2847 swing low to the .3295 high.
Source: ADAUSD on TradingView.com
On the upside, immediate resistance is near the .3280 zone. The first resistance is near .332. The next key resistance might be .350. If there is a close above the .350 resistance, the price could extend its rally. In the stated case, the price could rise toward the .385 resistance zone.
Are Dips Supported in ADA?
If Cardano’s price fails to climb above the .328 resistance level, it could continue to move down. Immediate support on the downside is near the .310 level.
The next major support is near the .308 level and the trend line. A downside break below the .308 level could open the doors for a sharp fresh decline toward .285. The next major support is near the .274 level.
Technical Indicators
4 hours MACD – The MACD for ADA/USD is losing momentum in the bullish zone.
4 hours RSI (Relative Strength Index) – The RSI for ADA/USD is now above the 50 level.
Major Support Levels – .310, .308, and .285.
Major Resistance Levels – .328, .332, and .350.
Cardano (ADA) Price Rally Reaches Crucial Juncture, $0.35 Is The Key
Cardano’s price started a fresh increase above the .32 resistance. ADA rise further if it clears the .350 resistance zone.
- ADA price is gaining bullish momentum above the .320 support against the US dollar.
- The price is trading above .320 and the 100 simple moving average (4-hours).
- There is a crucial bearish trend line forming with resistance near .348 on the 4-hours chart of the ADA/USD pair (data source from Kraken).
- The pair could continue to move up if it clears the .35 resistance zone.
Cardano’s Price Surges 10%
After a steady decline, cardano’s price found support near the .298 zone. The price traded as low as .2979 and recently started a decent increase.
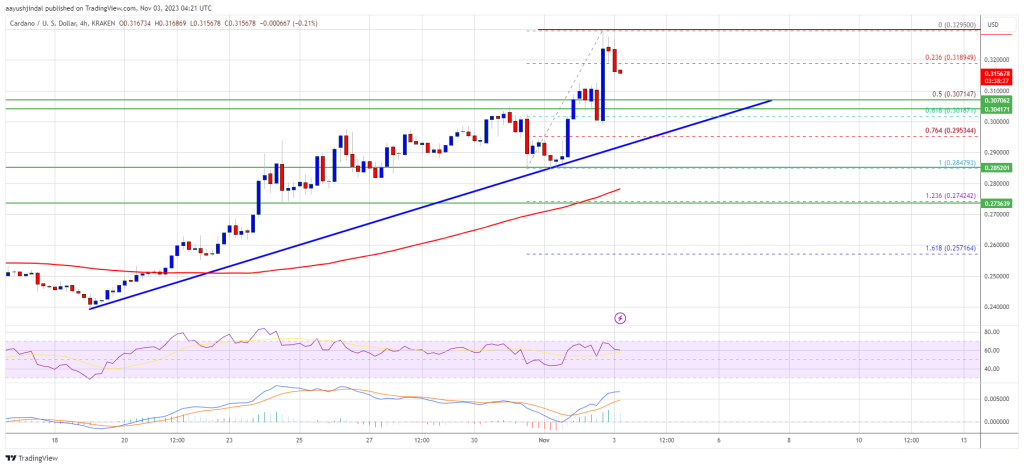
There was a clear move above the .315 and .320 resistance levels. The bulls pumped the price above the 23.36% Fib retracement level of the main drop from the .4213 swing high to .2979 low. The price even surpassed the .3300 resistance zone.
ADA price is now trading above .320 and the 100 simple moving average (4-hours). Today, the price is up around 10% and showing positive signs, similar to bitcoin and ethereum.
On the upside, an immediate resistance is near the .348 zone. There is also a crucial bearish trend line forming with resistance near .348 on the 4-hours chart of the ADA/USD pair. The next major resistance is forming near the .36 zone. It is near the 50% Fib retracement level of the main drop from the .4213 swing high to .2979 low.
Source: ADAUSD on TradingView.com
If there is an upside break above the .350 and .360 resistance levels, the price could start a strong increase. In the stated case, the price could rise steadily towards the .40 level. An intermediate resistance might be .42.
Dips Limited in ADA?
If cardano’s price fails to climb above the .348 and .350 resistance levels, it could start a fresh decline. An immediate support on the downside is near the .330 level.
The next major support is near the .320 level. A downside break below the .320 level could open the doors for a fresh decline towards .300. The next major support is near the .288 level.
Technical Indicators
4-hours MACD – The MACD for ADA/USD is gaining momentum in the bullish zone.
4-hours RSI (Relative Strength Index) – The RSI for ADA/USD is now above the 50 level.
Major Support Levels – .330, .320 and .300.
Major Resistance Levels – .348, .350 and .360.
Cardano Finds Breathing Room At $0.35 Support – Is This Enough For ADA?
Cardano is somehow keeping in-step with cryptocurrency frontrunners Bitcoin and Ethereum, sitting on price increase on its intraday chart.
- Cardano failed to hold the .41 crucial support range and settle to the new support marker of .36
- ADA is forecasted to trade from $.0403 to .416 in the coming days
- Cardano addresses grow despite bearish market sentiments
Tracking from Coingecko shows the smart contract token is trading at .371, raising its price by almost 1% during a 24-hour period.
The altcoin, however, continues to struggle as it remains in the red zone on its 7-day and 14-day metrics, going down by 7.6% and 13.3%, respectively.
Investors, holders and traders are keeping close watch on the price movement of the crypto as it tries to bounce back after failing to sustain the .41 crucial support marker.
At first it appeared the asset was in for another steep fall, but it managed to cling into a new support range which could prove to be significant in determining the trend of its next price rally.
Cardano Hangs On To .35 Support
As seen from Cardano’s trading chart, the Bollinger band (blue line) continued to drop as ADA failed to hold the critical .41. It only stopped upon reaching the .35 marker.
Source: TradingView
Meanwhile, the crypto’s Relative Strength Index (RSI) tallied a low value of 23.4 which indicated Cardano was in oversold position and is primed for a price uptick.
If ADA manages to sustain its new support marker, a surge ranging from .403 to .416 will likely to happen over the next few days, enabling the token to start its own recovery along with other members of the crypto space.
However, if Cardano fails to hold this position again, bears will be given opportunity to gain profit as ADA will likely fall all the way to .336.
ADA Addresses Grow Despite Weak Value
In September 2021, Cardano managed to hit an all-time high value of .09. The crypto, however, already lost 80% of that value and continues to struggle to get even just to marker.
But despite the immense price tanking that the asset continues to experience since hitting its ATH, retail investors seem to be unfazed.
In fact there is a noticeable increase of ADA addresses, indicating the crypto is still commanding interest among participants in crypto space.
Holders of 100 to 1,000 Cardano tokens are now accounting for 1.15% of the network’s circulating supply, going up by 0.23% from the previous tally of 0.92%.
Meanwhile, an almost identical increase is also observed to holders of 1,000 to 10,000 ADA coins which grew by 0.59%.
ADA market cap at billion on the daily chart | Featured image from Shutterstock, Chart: TradingView.com
Disclaimer: The analysis represents the author’s personal views and should not be construed as investment advice.
NewsBTC
Charted: Ripple (XRP) Signaling Bullish Breakout, Why It Could Retest $0.35
Ripple is holding gains above .2800 against the US Dollar. XRP price is likely to accelerate higher towards .3500 once it clears the .3100 resistance zone.
- Ripple is showing a few positive signs above .2800 and .2680 against the US dollar.
- The price is facing a major hurdle at .3100, but it is above the 100 simple moving average (4-hours).
- There is a key contracting triangle forming with resistance near .3000 on the 4-hours chart of the XRP/USD pair (data source from Kraken).
- The pair is likely to accelerate higher towards .3500 once it clears .3100.
Ripple’s XRP Price is Showing Positive Signs
There was a sharp increase in ripple’s XRP price after it broke the .3000 resistance. The price climbed above the .3100 and .3200 resistance levels, but it struggled near the .3300 level.
A high was formed near .3302 before the price corrected lower. It broke the .3100 support and even spiked below .3000. However, the bulls defended the .2800 zone and the 100 simple moving average (4-hours). A low is formed near .2811 and the price is currently consolidating in a range.
It recovered above the 23.6% Fib retracement level of the downward move from the .3302 high to .2811 low. There is a key contracting triangle forming with resistance near .3000 on the 4-hours chart of the XRP/USD pair.
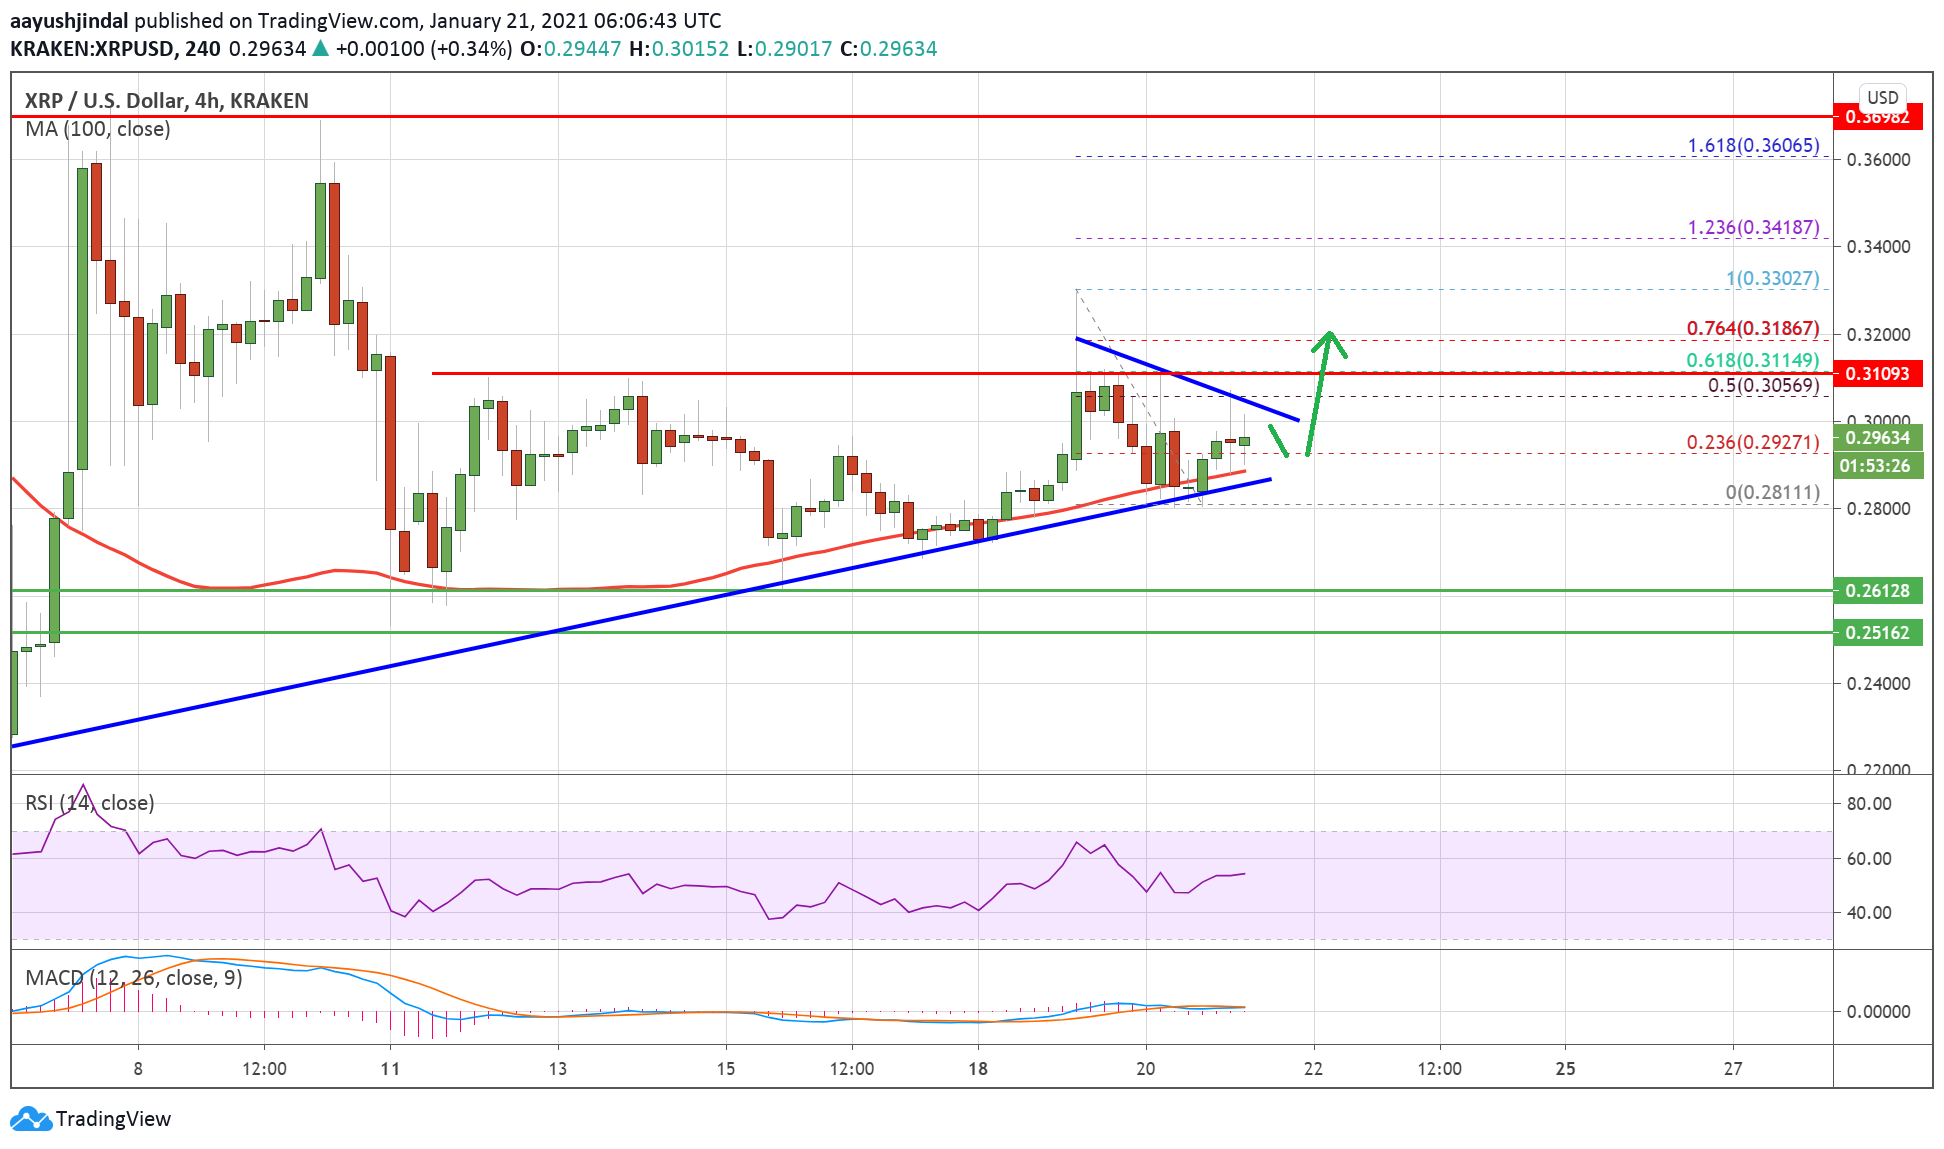
Source: XRPUSD on TradingView.com
The triangle resistance is close to the 50% Fib retracement level of the downward move from the .3302 high to .2811 low. A successful break above the triangle resistance may possibly call for a break above the .3100 resistance.
A successful close above .3000 and .3100 could open the doors for a steady increase. The next hurdle could be .3300, above which the price could test .3500.
Fresh Dip in XRP?
If ripple fails to break the .3000 and .3100 resistance levels, it could correct lower. The first major support is near the .2880 zone and the 100 SMA (H4).
A downside break below the triangle trend line, .2850, and the 100 SMA (H4) could accelerate losses. In the stated case, the price could decline sharply towards the .2600 support zone in the near term.
Technical Indicators
4-Hours MACD – The MACD for XRP/USD is showing positive signs in the bullish zone.
4-Hours RSI (Relative Strength Index) – The RSI for XRP/USD is now above the 50 level.
Major Support Levels – .2880, .2850 and .2600.
Major Resistance Levels – .3000, .3100 and .3500.
Charted: Ripple (XRP) Eyes Fresh Rally To $0.35, Dips Remain Supported
Ripple started a strong recovery wave above the .3000 and .3100 levels against the US Dollar. XRP price is currently correcting gains from .3700, but dips remain limited.
- Ripple rallied above the .3200 and .3500 resistance levels against the US dollar.
- The price tested the .3700 zone before correcting lower, but it settled above the 100 simple moving average (4-hours).
- There is a major bearish trend line forming with resistance near .3480 on the 4-hours chart of the XRP/USD pair (data source from Kraken).
- The pair is holding a key support near the .3000 and .2800 levels.
Ripple’s XRP Price is Holding Gains
In the past two days, ripple’s XRP price saw a sharp increase above the .2500 resistance level. The bulls gained strength, resulting in a sharp upward move above the .3000 barrier.
The price even surged above the .3200 level and settled above the 100 simple moving average (4-hours). The price nuked the .3500 level before the bears took a stand near the .3700 zone. There were two attempts by the bulls to gain momentum above .3700, but they failed.
A swing high was formed near .3700 before the price started a downside correction (similar to bitcoin). The price traded below the .3500 level. There was also a break below the 23.6% Fib retracement level of the upward wave from the .2190 swing low to .3700 swing high.
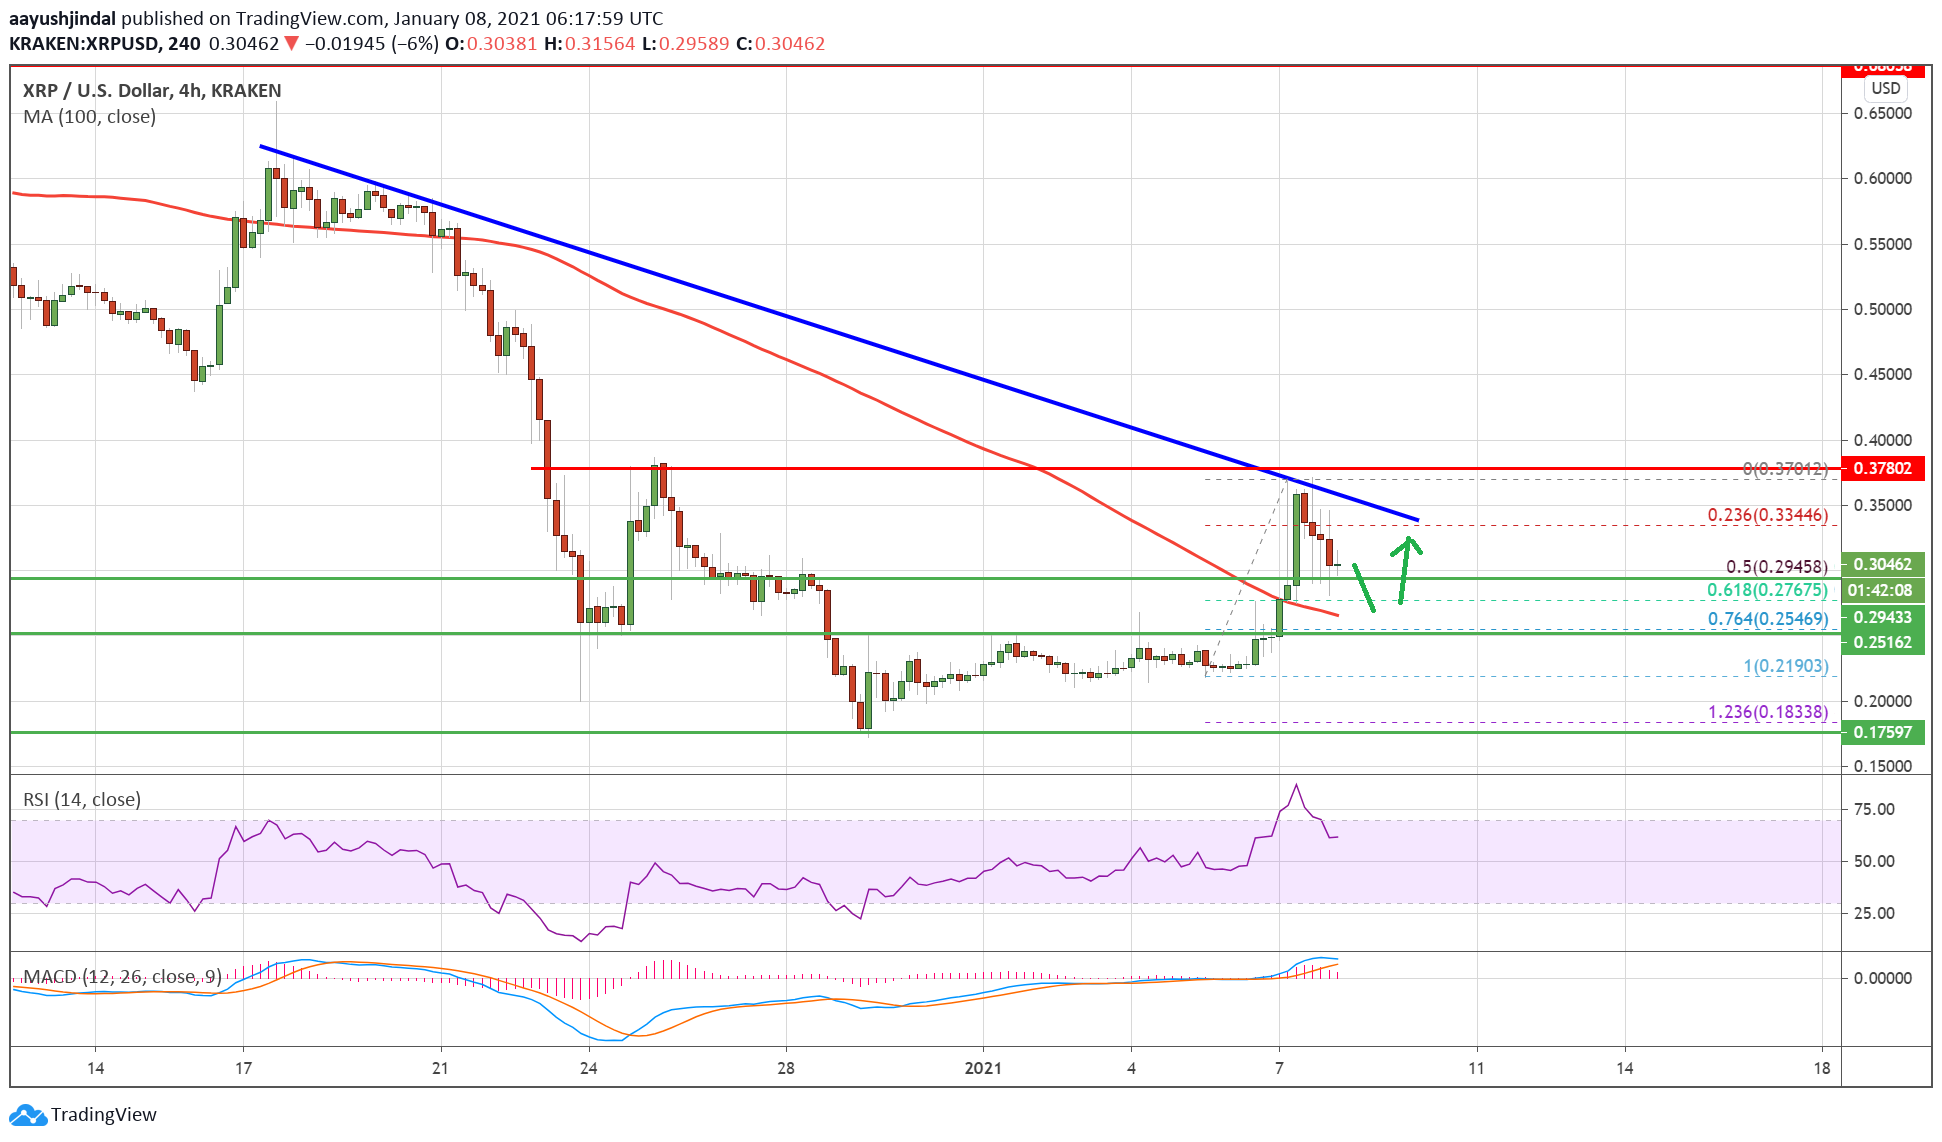
Source: XRPUSD on TradingView.com
There is also a major bearish trend line forming with resistance near .3480 on the 4-hours chart of the XRP/USD pair. On the downside, the .3000 and .2950 levels are important supports.
The 50% Fib retracement level of the upward wave from the .2190 swing low to .3700 swing high is also near .2950. Any more losses could lead the price towards the main .2500 support level and the 100 simple moving average (4-hours).
More Gains in XRP?
If ripple remains stable above the .2950 level, there are chances of a fresh increase. An initial resistance on the upside is near the .3250 level.
The main resistance is now near .3500. A close above the .3500 resistance zone could pump the price towards the .3700 and .3800 levels in the near term.
Technical Indicators
4-Hours MACD – The MACD for XRP/USD is losing momentum in the bullish zone.
4-Hours RSI (Relative Strength Index) – The RSI for XRP/USD is correcting lower towards the 50 level.
Major Support Levels – .3000, .2950 and .2550.
Major Resistance Levels – .3250, .3450 and .3500.
Ripple (XRP) Approaching Next Crucial Break: Here’s Why $0.35 Holds Key
Ripple surged higher and climbed above the .3200 resistance area against the US Dollar. However, XRP price is now facing a strong resistance near the .3400-.3500 area.
Ripple price surged to a new 2020 high at .3399 before correcting lower against the US dollar.
The price is now consolidating gains above the .3150 support area.
There is a major contracting triangle forming with resistance near .3310 on the hourly chart of the XRP/USD pair (data source from Kraken).
The price could either surge above .3400 or it might start a significant correction below .3000.
Ripple Price Facing Key Hurdles
In the past two days, ripple saw a sharp increase in buying interest above the .2900 resistance. As a result, XRP rallied above the .3000 and .3200 resistance levels.
Moreover, there was a close above the .3200 level and the 100 hourly simple moving average. Finally, the price tested a major resistance area near .3400-.3500 (as discussed in yesterday’s post using the daily chart).
Ripple faced a strong selling interest near .3400 and a new 2020 high was formed near .3399. Recently, there was a downside correction below the .3300 area. The price even broke the 23.6% Fib retracement level of the upward move from the .2998 low to .3399 high.
There were a couple of spikes below .3200, but the price remained well bid above .3200. More importantly, there is a major contracting triangle forming with resistance near .3310 on the hourly chart of the XRP/USD pair.
Ripple Price
Therefore, ripple seems to be facing a lot of hurdles on the upside, starting with .3310 and up to .3500. A successful daily close above the .3500 level could initiate a long term uptrend towards .4000 or even .5000.
Key Uptrend Supports
The first key support is near the triangle lower trend line at .3200. It also coincides with the 50% Fib retracement level of the upward move from the .2998 low to .3399 high.
If the price fails to stay above the .3200 support, it could start a downside extension. In the mentioned case, the first target for the bears could be .3080.
However, the main support is near the .3000 level, below which there is a risk of a drop towards the .2920 support or the 100 hourly SMA.
Technical Indicators
Hourly MACD – The MACD for XRP/USD is slowly moving in the bearish zone.
Hourly RSI (Relative Strength Index) – The RSI for XRP/USD is still above the 50 level, with positive signs.
Major Support Levels – .3200, .3080 and .3000.
Major Resistance Levels – .3310, .3400 and .3500.
NewsBTC
Ripple (XRP) Rallies 20% To Hit $0.33 But $0.35 Region Could Be Game Changer
Ripple rallied around 20% and it broke the key .3000 resistance against the US Dollar. XRP price is now approaching the .3400-.3500 resistance, where it could face a strong selling interest.
Ripple price surged above .3000 and .3200 to move into an uptrend against the US dollar.
The price is up close to 20% and it tested the .3400 resistance area.
Earlier, there was a break above a major bearish trend line with resistance near .2460 on the daily chart of the XRP/USD pair (data source from Kraken).
The main hurdle for the bulls is near the .3500 area (a multi touch zone and a key pivot area).
Ripple Price Rally Facing Hurdles
After forming a support base above .1800, ripple started a strong rise in Jan 2020 against the US Dollar. XRP broke many hurdles near .2000 and .2200 to move into a positive zone.
More importantly, the bulls were able to lead the price above the .2400 resistance area and the 100-day simple moving average. It opened the doors for more gains above the .2500 resistance.
Besides, there was a break above a major bearish trend line with resistance near .2460 on the daily chart of the XRP/USD pair. Finally, ripple surged more than 20% in the past three days and broke many important hurdles, including .3000.
Ripple Price
Besides, there was a break above the 76.4% Fib retracement level of the key downward move from the .3143 high to .1726 low. It is now trading nicely above the .3143 swing high.
However, there is a strong resistance waiting on the upside near .3500 (a multi touch zone and a key pivot area). Additionally, the 1.236 Fib extension level of the key downward move from the .3143 high to .1726 low is near .3480.
Therefore, ripple price is likely to face a strong selling interest near the .3500 resistance area. If the bulls overcome .3500, it could open the gates for a push towards .4000 in the coming days.
Resistance Turned Support
If there is a downside correction, ripple remains well supported near the .3150 level (the recent breakout resistance zone).
The main support is now near the .3000 area, below which there is a risk of a larger downside correction towards the .2680 level. Overall, the price is approaching a significant resistance at .3500, where the bulls are likely to struggle.
Technical Indicators
Daily MACD – The MACD for XRP/USD is gaining momentum in the bullish zone.
Daily RSI (Relative Strength Index) – The RSI for XRP/USD is currently well above the 60 level.
Major Support Levels – .3150, .3000 and .2680.
Major Resistance Levels – .3400, .3500 and .4000.
NewsBTC
Cardano Price Technical Analysis – ADA/USD Bearish Below $0.35
Key Highlights
- ADA price is struggling to recover and it recently declined below the .3200 level against the US Dollar (tethered).
- There is a major declining channel forming with resistance at .3205 on the hourly chart of the ADA/USD pair (data feed via Bittrex).
- The pair is currently correcting higher, but it may face a lot of resistance near .3250 and .3500 in the near term.
Cardano price declined further against the US Dollar and Bitcoin. ADA/USD is currently trading well below the .3500 level and in a bearish zone.
Cardano Price Decline
There was no major recovery in ADA price above the .3600 level against the US Dollar. The price did not move above the .4000 resistance and declined once again. During the recent slide, it broke the .3500 and .3300 support levels. It even traded below .3200 to test the .3000 area. A low was formed at .2995, and the price is currently consolidating losses around the .3000 level.
It is testing the 23.6% Fib retracement level of the last drop from the .3866 high to .2995 low. It seems like the price may find it hard to break the .3200 and .3300 resistance levels in the short term. There is also a major declining channel forming with resistance at .3205 on the hourly chart of the ADA/USD pair. The channel resistance at .3205 is near the 23.6% Fib level. If there is a break above .3205, the price may correct further higher. The next major resistance is near .3430 and the 50% Fib retracement level of the last drop from the .3866 high to .2995 low.

On the downside, the .3000 level is a major support. If the price fails to stay above .3000, it could even trade back towards the .2500 level in the near term.
Hourly MACD – The MACD for ADA/USD is slowly recovering and is showing positive signs.
Hourly RSI – The RSI for ADA/USD is moving higher towards the 45-50 levels.
Major Support Level – .3000
Major Resistance Level – .3500
Charts courtesy – Cryptowat, Bittrex
The post Cardano Price Technical Analysis – ADA/USD Bearish Below .35 appeared first on NewsBTC.