 The European Central Bank announced cuts of 0.25% (or 25 basis points) on three of its main interest rates: the main refinancing operations, the marginal lending facility, and the deposit facility. President Christine Lagarde emphasized that future decisions regarding additional cuts will depend on market reactions and evolving data. European Central Bank Cuts Interest Rates […]
Bitcoin News
Dogecoin Price Pumps To $0.20, Can DOGE Bulls Send It To $0.25
Dogecoin is up over 100% against the US Dollar. DOGE rallied toward the .20 resistance and might continue to rise toward the .225 resistance.
- DOGE extended its rally above the .150 resistance against the US dollar.
- The price is trading above the .180 level and the 100 simple moving average (4 hours).
- There is a connecting bullish trend line forming with support at .1620 on the 4-hour chart of the DOGE/USD pair (data source from Kraken).
- The price could extend its rally above the .200 and .2120 resistance levels.
Dogecoin Price Surges Over 100%
In the past few sessions, Dogecoin price started a strong increase above the .10 resistance. DOGE cleared many hurdles near .1250 to enter a positive zone.
It even broke the .150 resistance and outperformed Bitcoin and Ethereum. It is up over 100% in a few sessions and traded close to the .20 resistance. A new multi-week high was formed near .992 and the price is now correcting gains.
The price is well above the 23.6% Fib retracement level of the recent rally from the .1250 swing low to the .1992 high. DOGE is also trading above the .180 level and the 100 simple moving average (4 hours).
There is also a connecting bullish trend line forming with support at .1620 on the 4-hour chart of the DOGE/USD pair. The trend line is near the 50% Fib retracement level of the recent rally from the .1250 swing low to the .1992 high.
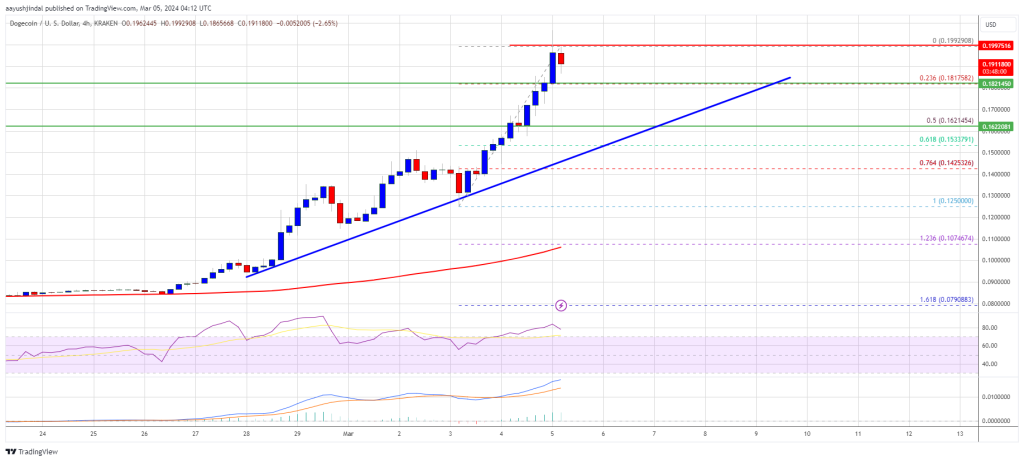
Source: DOGEUSD on TradingView.com
On the upside, the price is facing resistance near the .1980 level. The next major resistance is near the .20 level. A close above the .20 resistance might send the price toward the .2250 resistance. The next major resistance is near .2320. Any more gains might send the price toward the .250 level.
Downside Correction in DOGE?
If DOGE’s price fails to gain pace above the .20 level, it could start a downside correction. Initial support on the downside is near the .182 level.
The next major support is near the .1620 level or the trend line. If there is a downside break below the .1620 support, the price could decline further. In the stated case, the price might decline toward the .1350 level.
Technical Indicators
4 Hours MACD – The MACD for DOGE/USD is now gaining momentum in the bullish zone.
4 Hours RSI (Relative Strength Index) – The RSI for DOGE/USD is now in the overbought zone.
Major Support Levels – .1820, .1620 and .1350.
Major Resistance Levels – .1980, .20, and .2250.
Federal Reserve Raises Benchmark Interest Rate by 0.25%, Disinflationary Process ‘Early,’ Says Powell
The U.S. Federal Reserve raised its benchmark federal funds rate by 0.25% on Wednesday after markets priced in near 100% certainty the Federal Open Market Committee (FOMC) would codify the quarter-point increase. The FOMC statement further detailed that ongoing rate increases are anticipated to bring inflation down to the target range of 2%.
FOMC Outlines Expectations for Future Rate Hikes
The central bank of the United States raised the federal funds rate on Wednesday, increasing it by 0.25% to the current range of 4.5% to 4.75%. The FOMC detailed in a statement that indicators show there has been “modest growth in spending and production” and job gains have been “robust in recent months.” However, the committee says that while inflation has dropped, it “remains elevated,” and it believes the conflict in Ukraine is “causing tremendous human and economic hardship.”
“The committee seeks to achieve maximum employment and inflation at the rate of 2 percent over the longer run,” the FOMC statement details. “In support of these goals, the committee decided to raise the target range for the federal funds rate to 4-1/2 to 4-3/4 percent. The committee anticipates that ongoing increases in the target range will be appropriate in order to attain a stance of monetary policy that is sufficiently restrictive to return inflation to 2 percent over time.”
The federal funds rate has been increased eight consecutive times and is now at its highest level in about 15 years. The Federal Open Market Committee has stated that “ongoing increases” would be appropriate at every meeting since March. Market analysts and investors have shown conflicting signals over the Fed rate hikes, with some expecting the central bank to soften its stance, and others anticipating that Jerome Powell will continue to raise the benchmark interest rate. The Fed’s rate hike on Wednesday was the smallest since March 2022.
On Wednesday, Powell said that monetary tightening will continue “until the job is done” and added that the “disinflationary process that is now underway is really in its early stages.” The crypto economy appeared unfazed by the Fed’s decision on Wednesday, and prices jumped 0.9% higher after Powell’s comments. Bitcoin (BTC) rose 1.4% and ethereum (ETH) jumped more than 2% higher.
After sliding during the early morning trading sessions on Wednesday, U.S. stocks regained most of the losses following the Federal Open Market Committee statement. All four U.S. benchmark equity indexes are in the green as Wednesday’s closing bell nears. Precious metals such as gold and silver also saw gains, with gold up 0.79% and silver up 0.72% following the Fed’s statement.
What are your thoughts on the Federal Reserve’s decision to raise the benchmark interest rate and how will it affect the economy in the long run? Let us know your thoughts about this subject in the comments section below.
Ocean Protocol (OCEAN) Breaks Out With Bullish Bias, Will $0.25 Play Out?
- OCEAN’s price shows strength as it bounces from a downtrend range price rallied to a high of .18 with eyes set on .25.
- OCEAN could rally more as the price creates more bullish bias breaking out of its descending triangle with good volume as the price could rally to .25.
- OCEAN’s price remains strong on the daily timeframe above the 50 Exponential Moving Average (EMA) as the price aims for more rallies.
Ocean Protocol (OCEAN) has had a tough time this year as the price has maintained a downtrend, but the price of OCEAN could be set for a change as Ocean Protocol breaks out of its daily descending triangle with good volume. The past few days have seen the crypto market has looked more decent, with the likes of Bitcoin (BTC) and Ethereum (ETH) showing some great price movement in recent times. OCEAN’s price rallied from .15 to a region of .184 as the price aims to take the market by its horn. (Data from Binance)
Ocean Protocol (OCEAN) Price Analysis On The Weekly Chart.
In recent times, Ocean Protocol (OCEAN) has struggled to regain its bullish momentum as the price has had a more quiet time ranging in a weekly low of .15; despite the uncertainty that has befallen the crypto space, the price of OCEAN held its ground as price defended its key support area of .15.
OCEAN’s price had yet to replicate its rally that took the price of OCEAN to an all-time high of before it faced rejection to trend higher.
After trading in a range for weeks as the price continued to look difficult to trade due to little to no volume to push the price higher as the price continued to look stagnated, the price of OCEAN finally showed some movement, with the crypto market looking more encouraging in recent times.
Weekly resistance for the price of OCEAN – .25.
Weekly support for the price of OCEAN – .15.
Price Analysis Of OCEAN On The Daily (1D) Chart

In the daily timeframe, the price of OCEAN continues to show a more bullish scenario as the price rallied to a high of .185 after breaking out its descending triangle with good volume. However, the price of OCEAN could face resistance to the trend to a region of .3.
The price of OCEAN needs to break and hold above .185 for the price to trend higher to a region of .25, which is a key supply zone for most traders.
The Fibonacci retracement (Fib) value of 38.2% indicates OCEAN’s price faced a rejection to trend higher as the price tried to break above this key value. The price of .184 corresponds to the Fib value of 38.2%. If the price of OCEAN closes above this level, we could see a rally to .25.
Daily resistance for the OCEAN price – .25.
Daily support for the OCEAN price – .16
Featured Image From zipmex, Charts From Tradingview
NewsBTC
Charted: Ripple (XRP) Holds Strong, Bulls Could Aim Fresh Test of $0.25
Ripple found support near .2320 and recovered higher above .2380 against the US Dollar. XRP price is consolidating gains and it could rally towards .2500.
- Ripple recovered nicely above the .2350 and .2380 resistance levels against the US dollar.
- The price is now trading above the .2400 resistance and the 100 hourly simple moving average.
- There was a break above a key bearish trend line with resistance near .2400 on the hourly chart of the XRP/USD pair (data source from Kraken).
- The pair is likely to continue higher if it clears the .2420 resistance zone.
Ripple Price is Showing Positive Signs
This past week, we saw a sharp decline in ripple below the .2400 support area. XRP price even broke the .2350 support and the 100 hourly simple moving average. It traded as low as .2310 and recently started a solid recovery wave.
There was a break above the .2350 and .2380 resistance levels. The price even climbed above the 50% Fib retracement level of the downward move from the .2472 high to .2310 low.
More importantly, there was a break above a key bearish trend line with resistance near .2400 on the hourly chart of the XRP/USD pair. The price is now trading above the .2400 resistance and the 100 hourly simple moving average.
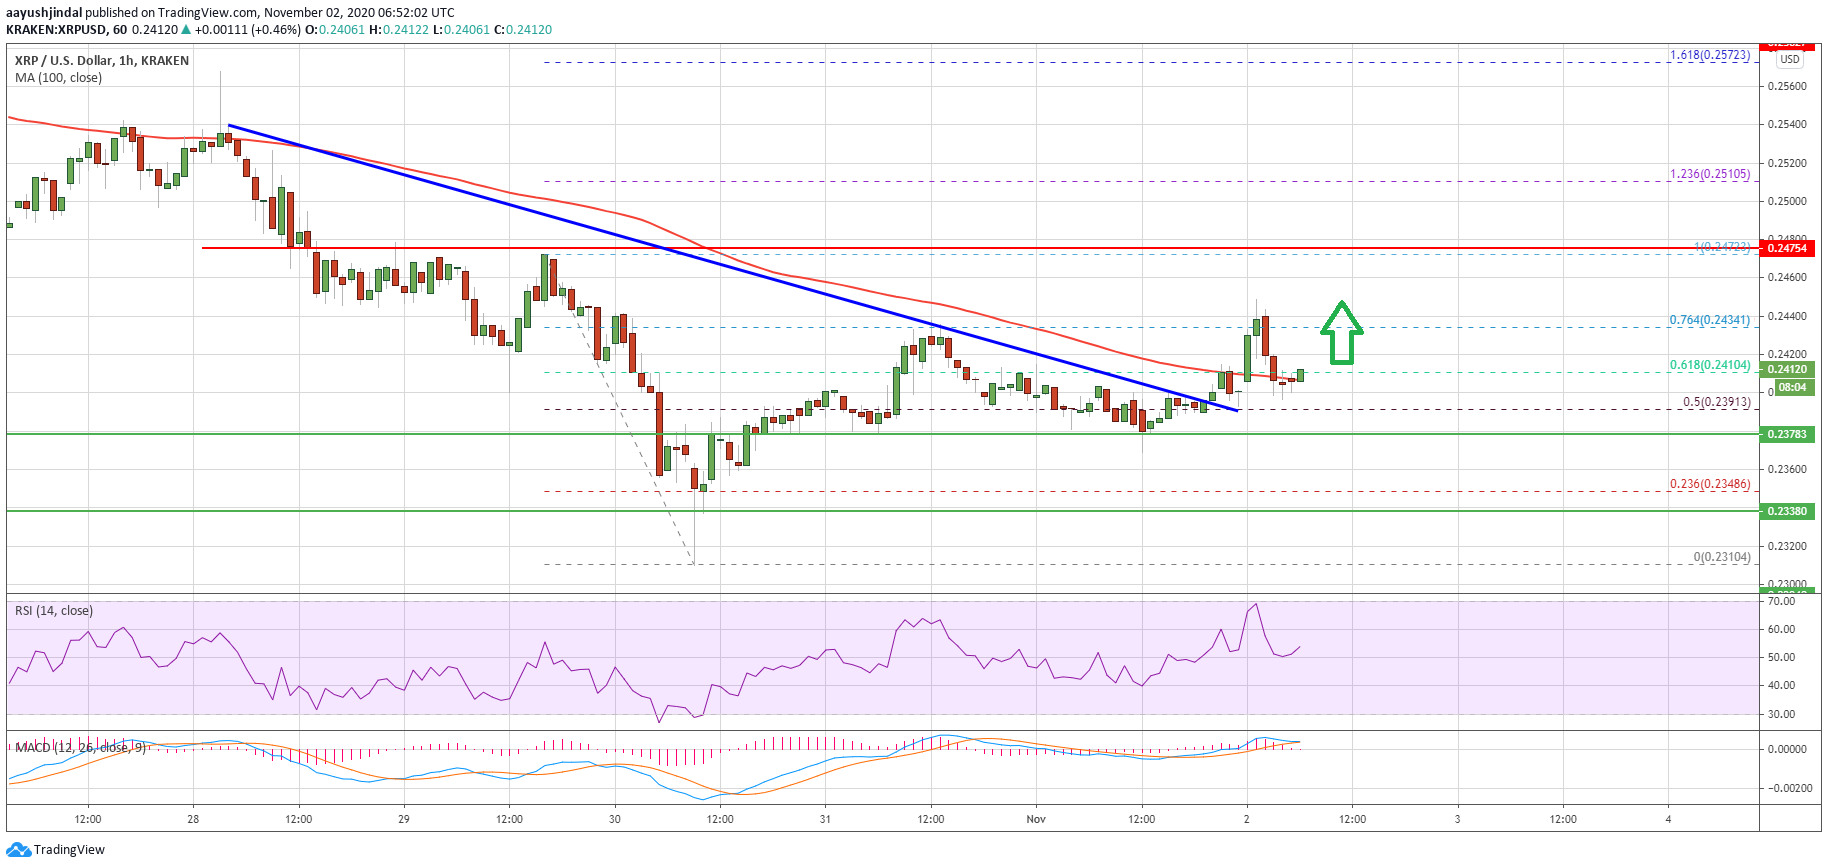
Source: XRPUSD on TradingView.com
An initial hurdle on the upside is near the .2420 level. The next resistance is near the 76.4% Fib retracement level of the downward move from the .2472 high to .2310 low. If there is a clear break above the .2420 and .2450 resistance levels, there is a risk of more upsides towards the .2480 and .2500 resistance levels.
Key Supports For XRP
The first key support for ripple is near the .2400 level and the broken trend line. The next key support is forming near the .2380 zone.
A successful break below the .2380 support level could put a lot of pressure on the bulls. In the stated case, the price may possibly revisit the .2320 support zone.
Technical Indicators
Hourly MACD – The MACD for XRP/USD is losing momentum in the bullish zone.
Hourly RSI (Relative Strength Index) – The RSI for XRP/USD is currently riding and it is above the 50 level.
Major Support Levels – .2400, .2380 and .2320.
Major Resistance Levels – .2420, .2450 and .2500.
Key Reasons Why Ripple (XRP) Price Could Surge Past $0.25
Ripple is recovering above the .2450 resistance against the US Dollar. The current technical structure suggests XRP price is likely to surge above .2500 and .2550.
- Ripple is slowly gaining bullish momentum above the .2450 resistance against the US dollar.
- The price is trading near the .2500 resistance, but it is above the 100 hourly simple moving average.
- There is a key bullish trend line forming with support near .2470 on the hourly chart of the XRP/USD pair (data source from Kraken).
- The pair could accelerate higher if it clears the .2500 and .2550 resistance levels.
Ripple Price Likely To Accelerate Higher
In the past three sessions, there was a decent recovery in ripple above the .2400 level. XRP price broke the .2450 resistance level and the 100 hourly simple moving average to start the current recovery.
There was a break above the 50% Fib retracement level of key decline from the .2535 swing high to .2380 swing low. The price is now testing the .2480 and .2500 resistance levels.
The 76.4% Fib retracement level of key decline from the .2535 swing high to .2380 swing low is also near the .2500 level. More importantly, there is a key bullish trend line forming with support near .2470 on the hourly chart of the XRP/USD pair.
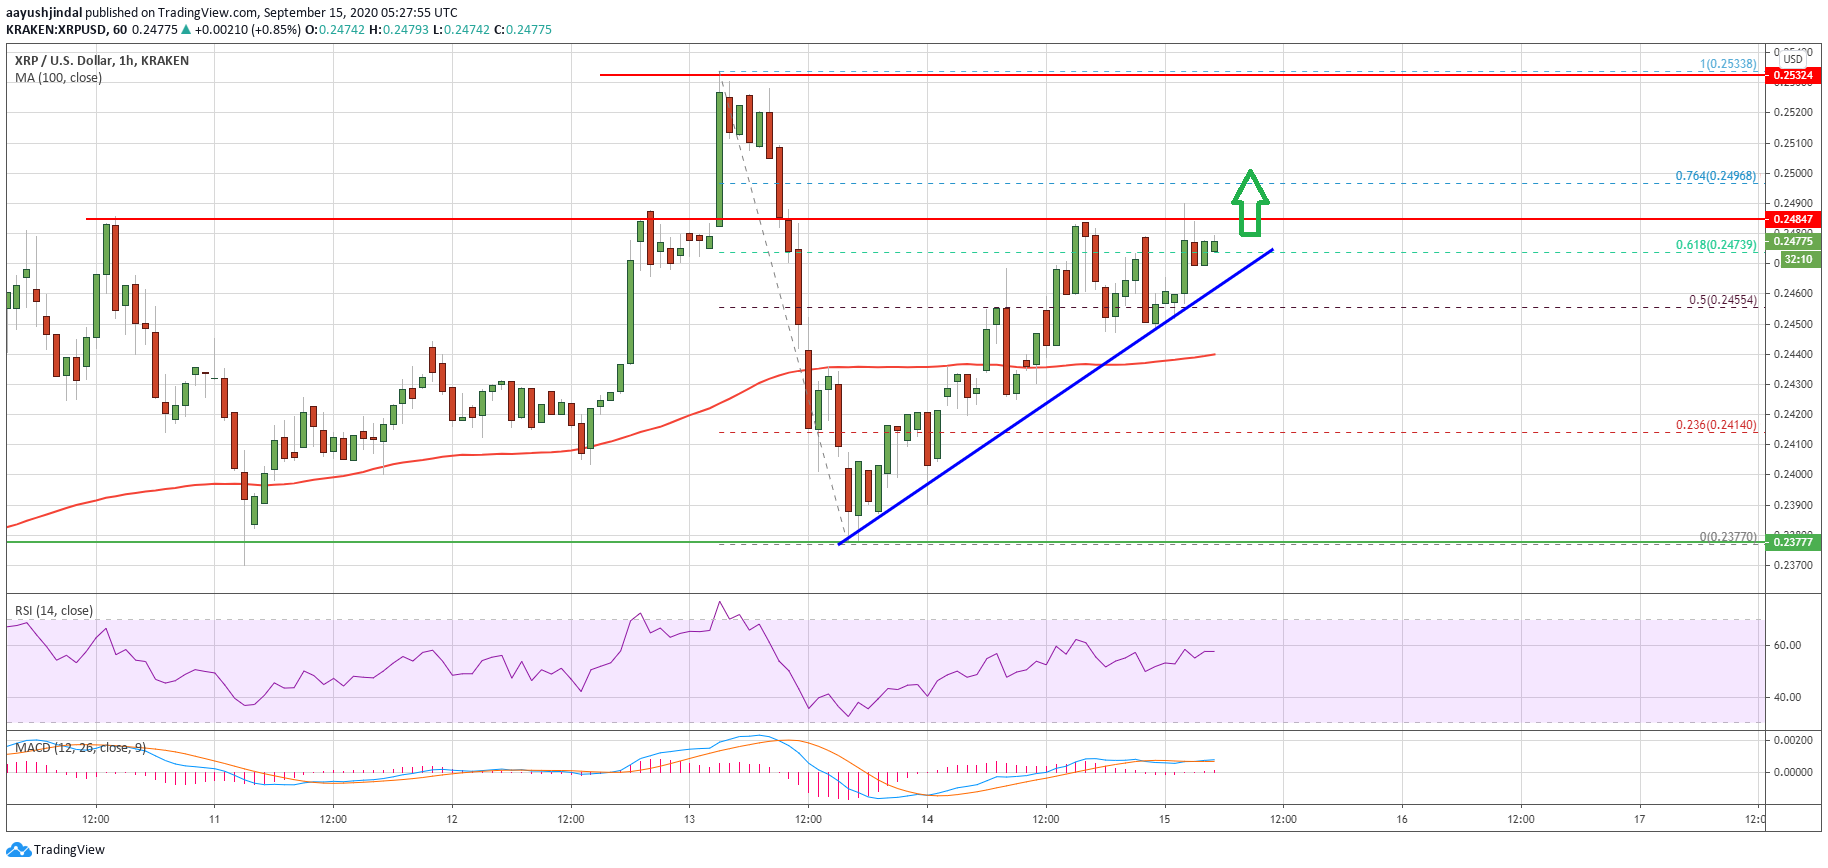
Ripple price trades above .2450. Source: TradingView.com
The current price action is positive, a close above the 100 hourly SMA, and the recent rise in bitcoin, bitcoin cash and ethereum are key reasons why ripple price might continue to rise above the .2480 and .2500 levels.
The next resistance is near the .2550 level. A successful close above the .2550 zone could open the doors for a strong rise towards the .2650 and .2700 resistance levels in the near term.
Another Failure in XRP?
If ripple fails to clear the .2480 and .2500 resistance levels, there could be a bearish reaction. An initial support on the downside is near the trend line at .2470.
The main support is forming near the .2440 level and the 100 hourly simple moving average. A downside break below the .2440 support and the 100 hourly simple moving average could lead the price towards the .2380 support zone in the near term.
Technical Indicators
Hourly MACD – The MACD for XRP/USD is slowly gaining momentum in the bullish zone.
Hourly RSI (Relative Strength Index) – The RSI for XRP/USD is currently well above the 50 level with positive signs.
Major Support Levels – .2470, .2440 and .2380.
Major Resistance Levels – .2480, .2500 and .2550.
$0.22: Ripple (XRP) Bears Aim Big After Recent Slide Below $0.25
Ripple declined heavily along with bitcoin and ethereum against the US Dollar. XRP price even broke the .2500 support zone and it is currently correcting losses.
- Ripple is down over 10%, and it broke the .2620 and .2550 levels against the US dollar.
- The price traded to a new weekly low at .2372 and it is now well below the 100 hourly simple moving average.
- There is a major bearish trend line forming with resistance near .2560 on the hourly chart of the XRP/USD pair (data source from Kraken).
- The pair could correct a few points, but it is likely to face hurdles near .2550 and .2560.
Ripple Price Tumbles Below .2500
The recent decline in Ethereum and bitcoin dragged ripple lower below the .2650 support. XRP extended its decline below the .2550 support zone and settled well below the 100 hourly simple moving average.
The bears even pushed the price below the .2500 support zone. The price traded to a new weekly low at .2372 and it is now correcting higher. There was a break above the .2450 resistance, plus the 23.6% Fib retracement level of the recent decline from the .2674 high to .2372 low.
The first key resistance is near the .2500 and .2520 levels. The 50% Fib retracement level of the recent decline from the .2674 high to .2372 low is also near .2525.
Ripple price trades below .2500. Source: TradingView.com
More importantly, there is a major bearish trend line forming with resistance near .2560 on the hourly chart of the XRP/USD pair. A clear break above the .2500 and .2560 resistance levels is must for a decent recovery wave in the coming days.
The next key resistance is near the .2660 level, above which the bulls are likely to aim a test of the .2750 resistance in the near term.
More Downsides in XRP?
If ripple fails to recover above the .2500 resistance or the trend line, the price is likely to continue lower below the .2450 and .2440 levels.
The next major support is near the recent low and .2380, below which the price is likely to accelerate lower towards the .2320 support or even the .2200 pivot level.
Technical Indicators
Hourly MACD – The MACD for XRP/USD is slowly losing momentum in the bearish zone.
Hourly RSI (Relative Strength Index) – The RSI for XRP/USD is correcting higher towards the 40 level.
Major Support Levels – .2440, .2400 and .2380.
Major Resistance Levels – .2500, .2550 and .2560.
XRP‘s “False Move” Could Lead it to $0.25 Despite Macro Strength
XRP has been struggling to maintain the upwards momentum that it incurred just over a week ago.
The cryptocurrency met insurmountable resistance within the lower-.30 region that slowed its ascent, subsequently causing it to break back into the upper-.20 region.
From this point on, it has been stuck in a firm consolidation phase, with its price action moving in close tandem to that of Bitcoin and Ethereum.
This has exposed it to some heightened turbulence in recent weeks, but it has continued maintaining some stability within the upper-.20 region.
Analysts are now noting that the token may be well-positioned to see significantly further upside in the long-term, but its short-term situation remains somewhat precarious.
One trader explained that the recent push past .30 marked a “false move” that is likely to result in a further drawback.
He believes that this could lead it as low as .25 in the near-term.
XRP Struggles to Gain Momentum as Analysts Eye Short-Term Downside
At the time of writing, XRP is struggling to garner any momentum as its price hovers below its key resistance at .30.
This is around the price at which it has been trading throughout the past week, although it did attempt to break above .30 this past weekend.
This attempt allowed to token to rally as high as .31 before it lost its momentum and faced a massive influx of selling pressure.
From this point, its price slid down to lows of .27. It has been consolidating ever since.
Analysts are now noting that this price action may have marked a “false move” that suggests further downside is imminent in the near-term.
One trader is now setting his sights on .25.
“XRP (USDT) update – breakout was a “False move”, 25 cents seems reasonable, lower range of high wave spinning top,” he said while pointing to the chart seen below.

Image Courtesy of Cheds. Chart via TradingView.
Why the Token’s Macro Technical Outlook Remains Bright
Despite showing signs of short-term weakness, XRP’s macro technical outlook is still bright.
As reported by NewsBTC yesterday, one analyst believes that the cryptocurrency is poised to explode towards .93 in the coming weeks due to a plethora of different factors. He explained:
“XRP Thread: TLDR: It’s going to .93c most likely… Breaking a 950 day down trend. Price is where the 17′ bull rally took off from and just reclaimed a major historical support level all with confluence of the 200D EMA on the BTC pair. The volume is also suggesting a reversal. There is a higher low on the chart finally.”

Image Courtesy of Pentoshi. Chart via TradingView.
If XRP does face heightened selling pressure that leads it to plunge towards .25, a strong bounce here could mark the start of its next leg higher.
Featured image from Unsplash.
Charts from TradingView.
Ripple (XRP) Nosedives 8%, Technicals Indicate A Drop To $0.25
Ripple failed to clear the .3000 barrier and started a strong decline against the US Dollar. XRP price is down over 8% and it seems like the bears are aiming a test of the .2500 support.
- Ripple is declining and it is now trading well below the .3000 level against the US dollar.
- The price is currently approaching the .2750 support and the 100 SMA (H4).
- There is a key bearish trend line forming with resistance near .2980 on the 4-hours chart of the XRP/USD pair (data source from Kraken).
- The pair could decline further if there is a close below the .2750 and .2720 support levels.
Ripple Price Is Showing Bearish Signs
After a couple of failed attempts to clear the .3000 resistance, ripple started a fresh decline. The price broke the .2920 support level to move into a short-term bearish zone.
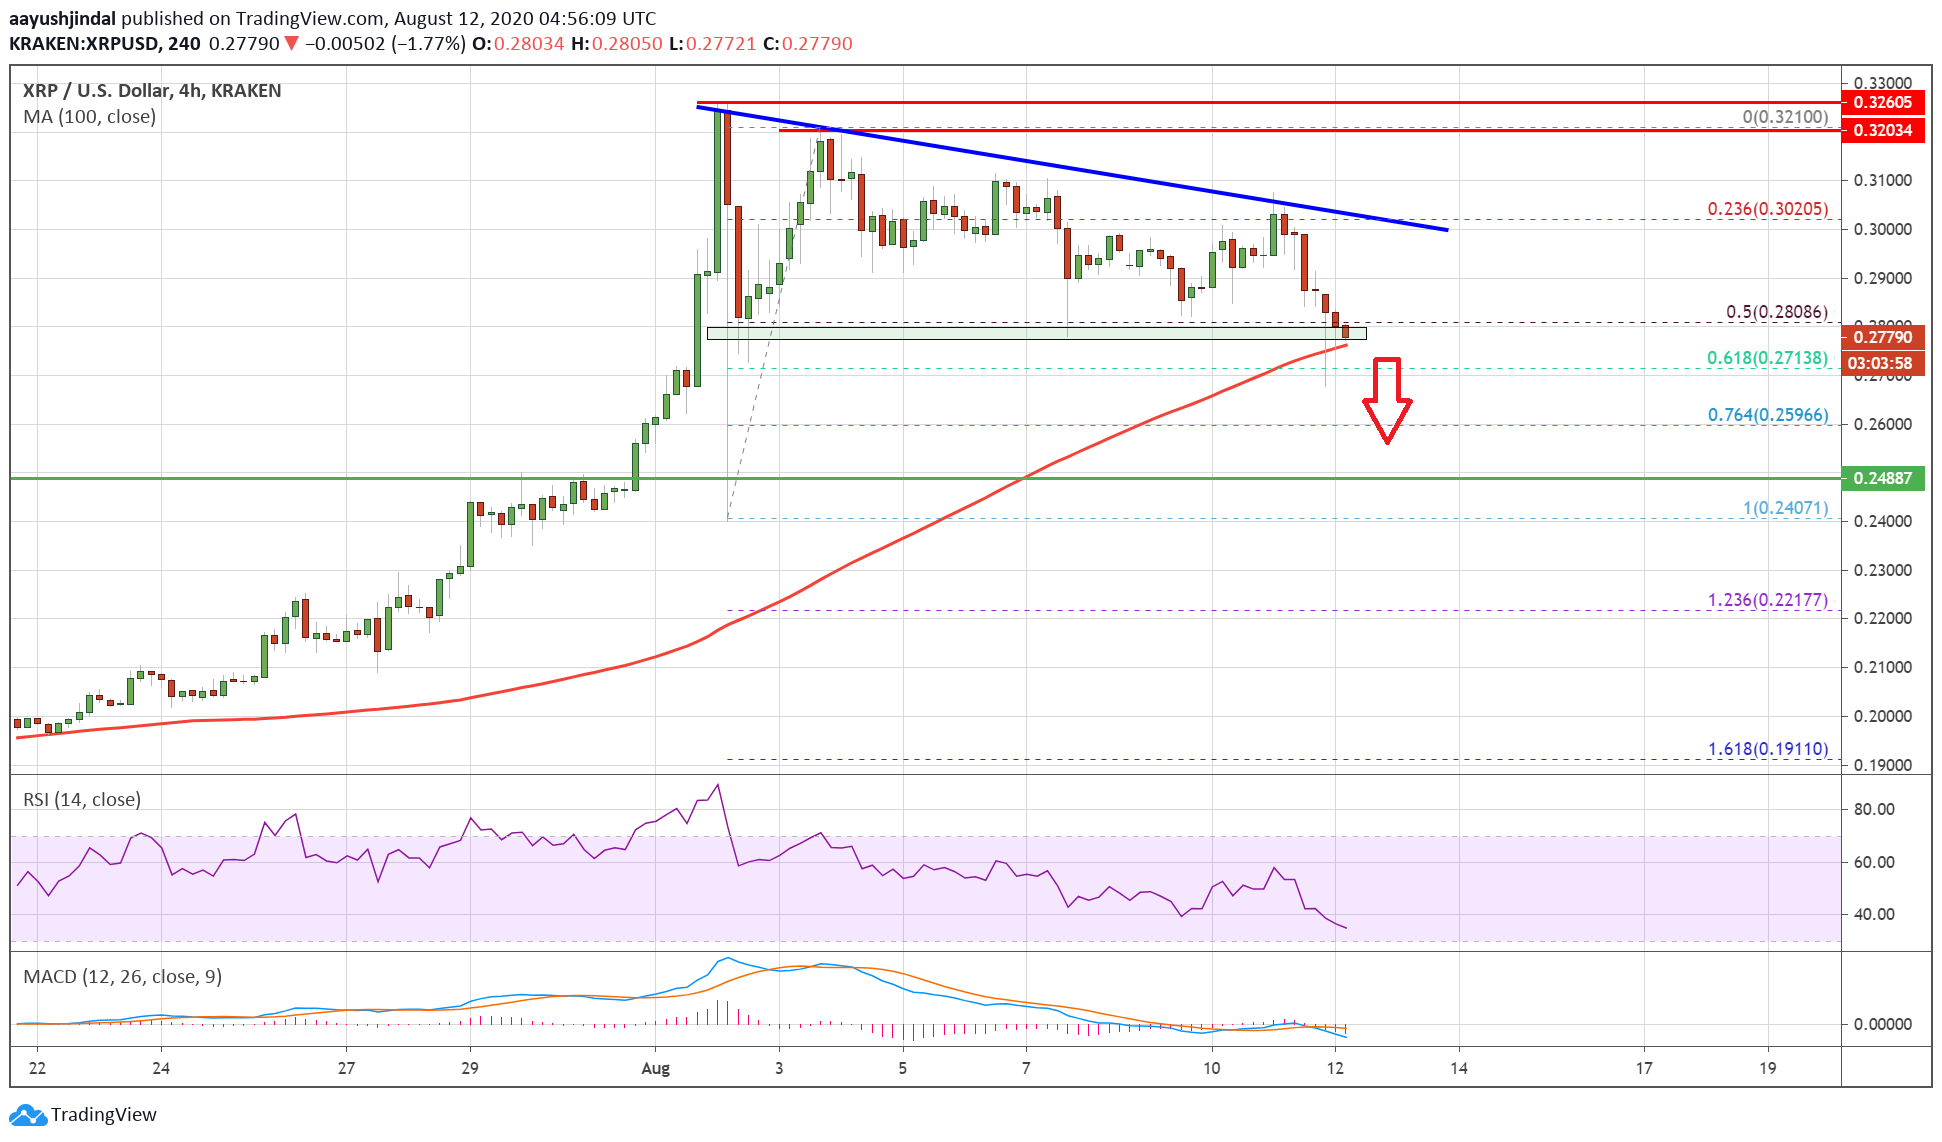
The bears gained strength and the price declined below the key .2850 support levels. The price even traded below the 50% Fib retracement level of the upward move from the .2407 low to .3210 high.
Moreover, there is a key bearish trend line forming with resistance near .2980 on the 4-hours chart of the XRP/USD pair. Ripple price is now trading near the .2780 level and the 100 simple moving average (4-hours).
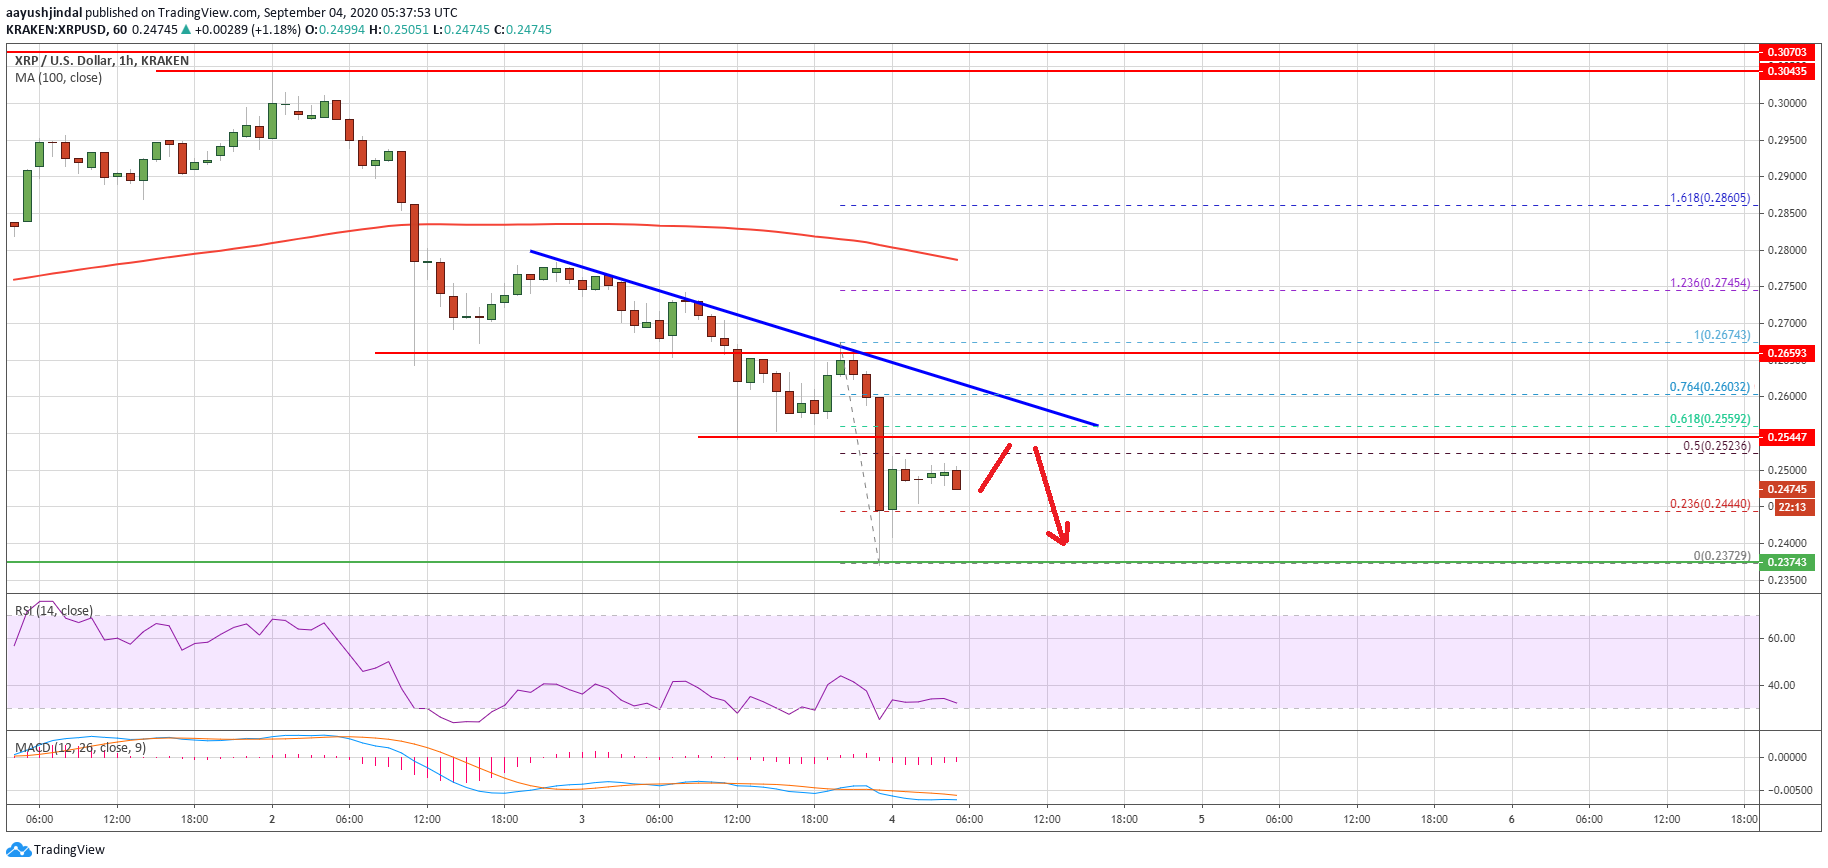
Ripple (XRP) price trades below .2850. Source: TradingView.com
If there is a downside break, the price could continue to move down towards the .2720 support. The 61.8% Fib retracement level of the upward move from the .2407 low to .3210 high is also near the .2715 level.
A downside break below the .2720 and .2700 support levels, the price could continue to move down. The next major support is seen near the .2500 level (the last major breakout zone). Ant further losses may perhaps push the price back into a bearish zone.
Reversal in XRP?
If ripple stays above the 100 SMA (H4) or the .2720 support zone, the price could start a fresh increase. The first major resistance zone is near the .2850 level.
The main hurdle is still near the .3000 level and the bearish trend line. A successful close above the .3000 level is needed for a strong upward move in the coming sessions.
Technical Indicators
4-Hours MACD – The MACD for XRP/USD is now gaining strength in the bearish zone.
4-Hours RSI (Relative Strength Index) – The RSI for XRP/USD is now well below the 50 level.
Major Support Levels – .2750, .2720 and .2500.
Major Resistance Levels – .2850, .2920 and .3000.
Ripple (XRP) Nosedives 8%, Technicals Indicate A Drop To $0.25
Ripple failed to clear the .3000 barrier and started a strong decline against the US Dollar. XRP price is down over 8% and it seems like the bears are aiming a test of the .2500 support.
- Ripple is declining and it is now trading well below the .3000 level against the US dollar.
- The price is currently approaching the .2750 support and the 100 SMA (H4).
- There is a key bearish trend line forming with resistance near .2980 on the 4-hours chart of the XRP/USD pair (data source from Kraken).
- The pair could decline further if there is a close below the .2750 and .2720 support levels.
Ripple Price Is Showing Bearish Signs
After a couple of failed attempts to clear the .3000 resistance, ripple started a fresh decline. The price broke the .2920 support level to move into a short-term bearish zone.
The bears gained strength and the price declined below the key .2850 support levels. The price even traded below the 50% Fib retracement level of the upward move from the .2407 low to .3210 high.
Moreover, there is a key bearish trend line forming with resistance near .2980 on the 4-hours chart of the XRP/USD pair. Ripple price is now trading near the .2780 level and the 100 simple moving average (4-hours).
Ripple (XRP) price trades below .2850. Source: TradingView.com
If there is a downside break, the price could continue to move down towards the .2720 support. The 61.8% Fib retracement level of the upward move from the .2407 low to .3210 high is also near the .2715 level.
A downside break below the .2720 and .2700 support levels, the price could continue to move down. The next major support is seen near the .2500 level (the last major breakout zone). Ant further losses may perhaps push the price back into a bearish zone.
Reversal in XRP?
If ripple stays above the 100 SMA (H4) or the .2720 support zone, the price could start a fresh increase. The first major resistance zone is near the .2850 level.
The main hurdle is still near the .3000 level and the bearish trend line. A successful close above the .3000 level is needed for a strong upward move in the coming sessions.
Technical Indicators
4-Hours MACD – The MACD for XRP/USD is now gaining strength in the bearish zone.
4-Hours RSI (Relative Strength Index) – The RSI for XRP/USD is now well below the 50 level.
Major Support Levels – .2750, .2720 and .2500.
Major Resistance Levels – .2850, .2920 and .3000.