Ethereum price recovered all losses and climbed above ,050. ETH outperformed Bitcoin and might aim for more gains above the ,120 resistance.
- Ethereum remained strong above ,930 and started a fresh increase above ,000.
- The price is trading above ,020 and the 100-hourly Simple Moving Average.
- There was a break above a major bearish trend line with resistance near ,980 on the hourly chart of ETH/USD (data feed via Kraken).
- The pair is up over 5% and the bulls could aim for more upsides above ,100.
Ethereum Price Turns Green
Ethereum price remained well-bid above the ,930 support after a steady decline post report of Binance settlement. ETH formed a base and started a strong increase above the ,000 resistance.
There was a break above a major bearish trend line with resistance near ,980 on the hourly chart of ETH/USD. The pair gained strength and climbed above the ,020 resistance. It gained over 5% and outperformed Bitcoin. Finally, it tested the ,100 zone.
A high is formed near ,092 and Ethereum is now consolidating gains. It is testing the 23.6% Fib retracement level of the upward move from the ,930 swing low to the ,092 high.
It is well above ,020 and the 100-hourly Simple Moving Average. On the upside, the price is facing resistance near the ,080 zone. The first key resistance is near the ,120 level. A clear move above the ,120 level could spark another strong increase.
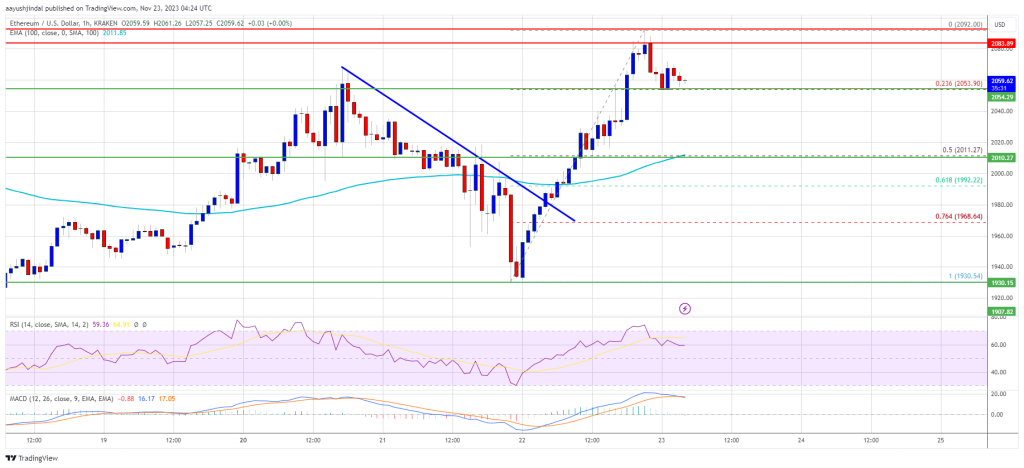
Source: ETHUSD on TradingView.com
The next resistance is near ,200, above which the price could aim for a move toward the ,250 level. Any more gains could start a wave toward the ,320 level.
Another Downside Correction in ETH?
If Ethereum fails to clear the ,120 resistance, it could start a fresh decline. Initial support on the downside is near the ,050 level. The next key support is ,000 or the 50% Fib retracement level of the upward move from the ,930 swing low to the ,092 high.
The main support is now near ,980. A downside break below the ,980 support might trigger more losses. In the stated case, Ether could drop toward the ,920 support zone in the near term.
Technical Indicators
Hourly MACD – The MACD for ETH/USD is losing momentum in the bullish zone.
Hourly RSI – The RSI for ETH/USD is now above the 50 level.
Major Support Level – ,000
Major Resistance Level – ,120