Ethereum formed a short-term top near 0 and started a sharp decline against the US Dollar. ETH price is correcting gains and it could revisit the 0 support zone.
- Ethereum started a downside correction after it failed to stay above the 0 support.
- The price traded below the 0 support and the 100 hourly simple moving average.
- There was a break below a major declining channel with support near 5 on the hourly chart of ETH/USD (data feed via Kraken).
- The pair tested the 7 level and it seems like there are chances of more downsides.
Ethereum Price Corrects Lower
After forming a short-term top near the 0 level, Ethereum started a sharp downside correction. ETH settled below the 0 level and it failed to stay above the 0 support level.
A clear break below the 0 support level sparked a strong decline (similar to bitcoin). Ether price declined heavily below the 0 support and it even settled well below the 100 hourly simple moving average. There was also a break below a major declining channel with support near 5 on the hourly chart of ETH/USD.
The price declined below the 0 support and traded as low as 7. It is currently recovering higher and trading above the 5 level. Ether is testing the 23.6% Fib retracement level of the recent decline from the 5 swing high to 7 low.
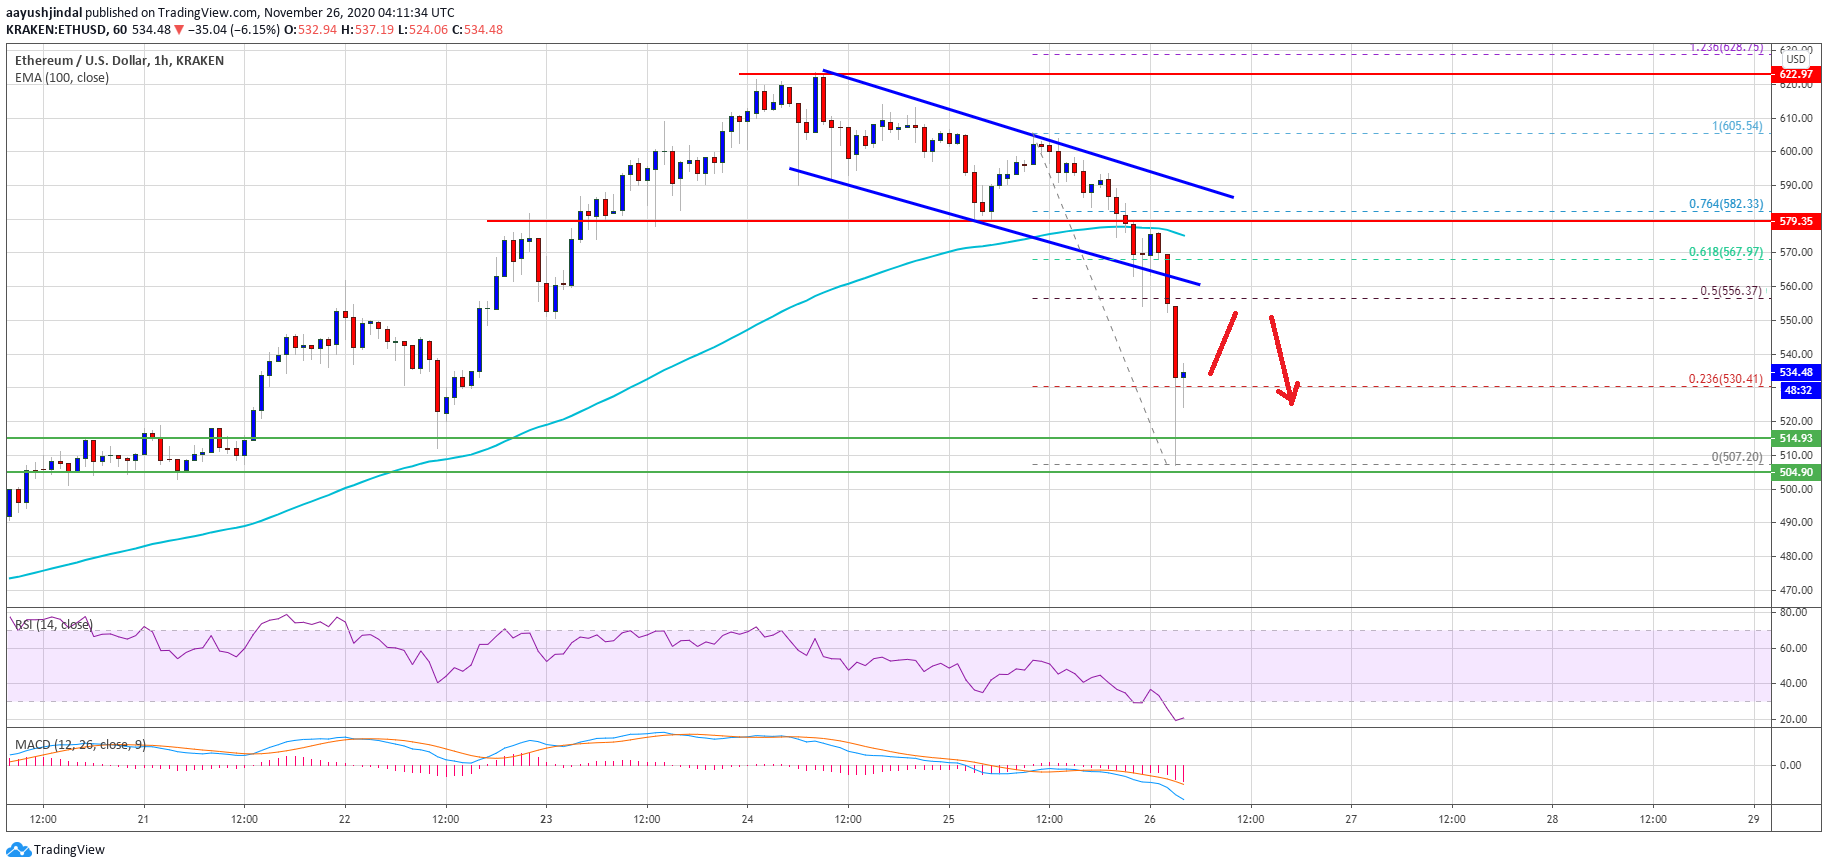
Source: ETHUSD on TradingView.com
On the upside, there is a major resistance forming near the 0 and 5 levels. The 50% Fib retracement level of the recent decline from the 5 swing high to 7 low is also near the 5 level.
The main resistance is forming near the 0 level and the 100 hourly simple moving average (the recent breakdown zone). A successful close above the 0 level is must to move back into a positive zone.
More Losses in ETH?
If ethereum fails to recover above the 0 resistance, there could be more losses. The first major support is near the 5 level, below which the price could retest the 7 low.
The main support is near the 0 handle. A clear break below the 0 handle might start a substantial decrease. In the mentioned case, the price could even test 0.
Technical Indicators
Hourly MACD – The MACD for ETH/USD is now gaining momentum in the bearish zone.
Hourly RSI – The RSI for ETH/USD is now well below the 30 level.
Major Support Level – 0
Major Resistance Level – 0